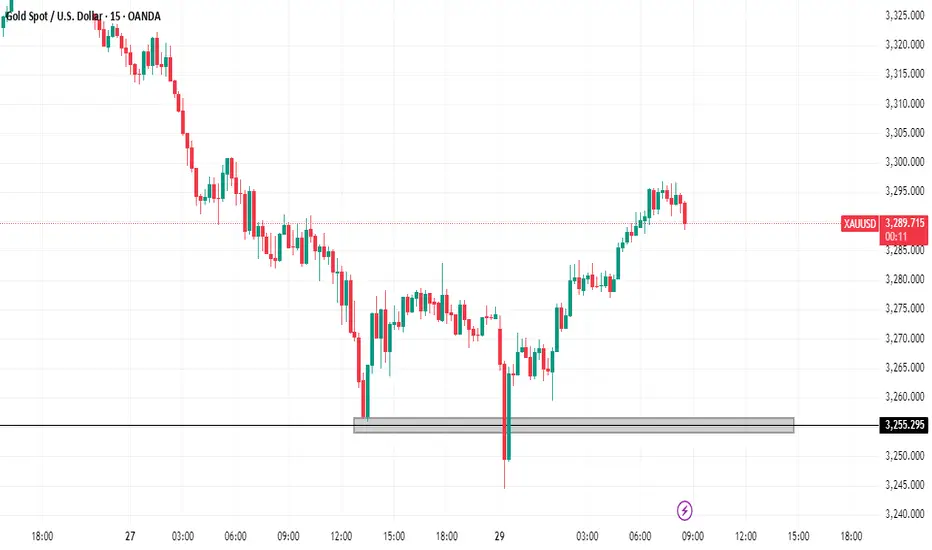
XAUUSD short from red zoneWill give gold a short a shot. It is pretty much a technical trade only. I will look to take a 200 pips out of it.
Goodluck
XAUUSD.F trade ideas
Gold is rising. Second starting point?Information summary:
1. The US dollar index has experienced the longest consecutive monthly decline since 2017. The weakening of the US dollar has increased the attractiveness of gold denominated in US dollars to non-US dollar holders, becoming an important support factor for gold prices.
2. Trump's continued pressure on the Federal Reserve to cut interest rates has formed a resonance effect with the weakening of the US dollar, which has jointly pushed up the short-term attractiveness of gold.
Multiple factors are intertwined, and gold has risen slightly again.
Market analysis:
Gold bottomed out and rebounded on Monday, showing a positive closing, and above 3300. After falling sideways for 5 consecutive trading days last week, although it fell for a short time on Monday, it did not continue. In this case, whether a new high can be reached, the watershed is the 3295 line. As long as the European session breaks the high, the long position is near the starting point of 3305 in the early trading session.
At present, the main focus is on the upper resistance around 3325. It opened directly upward on Tuesday, but did not break through too much space, unless it directly broke through 3325-3330; then the next resistance is around 3340. At present, the bulls are still running at a high level. The upward trend line generated after the reversal is more obvious, and the trend line has good effectiveness.
Since the current market is in the first wave of rise, the high point has not been confirmed. Quaid believes that when the high point is clear and the price falls back to the support area, consider entering the market to go long based on the support level. Of course, aggressive trading can choose to buy around 3320 and choose a suitable high point to take profit.
Operation strategy:
Short near the rebound 3340, stop loss 3350, profit range 3310-3300
Long near the fall 3305, stop loss 3290, profit range 3320-3335
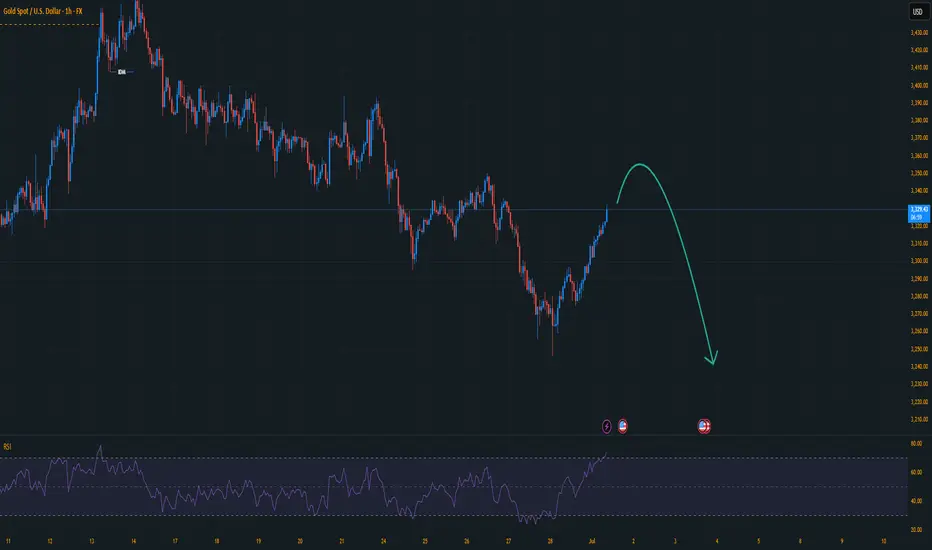
Gold in a Shifting Macro Landscape Fundamentals First: Why is Gold Falling While DXY is Too?
Normally, gold and the U.S. dollar share an inverse relationship (which means, when DXY weakens, gold rises). But recently, this correlation has broken down, and that divergence is a loud macro signal.
What’s Happening:
Trade Deal Optimism:
Headlines suggest the U.S. is nearing a resolution with China and other partners. With reduced geopolitical tension, investors are reallocating from safe-haven assets like gold into risk-on trades like equities and crypto.
Iran-Israel Ceasefire:
The temporary cooling of conflict has revived risk appetite. Traders are rotating out of war hedges (like gold and oil) and into tech, growth, and EM plays.
Real Yields Still Elevated:
Despite a softening Fed narrative, U.S. real yields remain positive, keeping pressure on non-yielding assets like gold. The fact that gold couldn't rally even as the 10-year note softened post-Moody's downgrade could be telling.
My Perspective:
This is the first clear signal in months that geopolitical hedging may have peaked. When gold decouples from its safe-haven narrative despite macro uncertainty, that often precedes a structural rotation phase, especially if institutional flows favor equities.
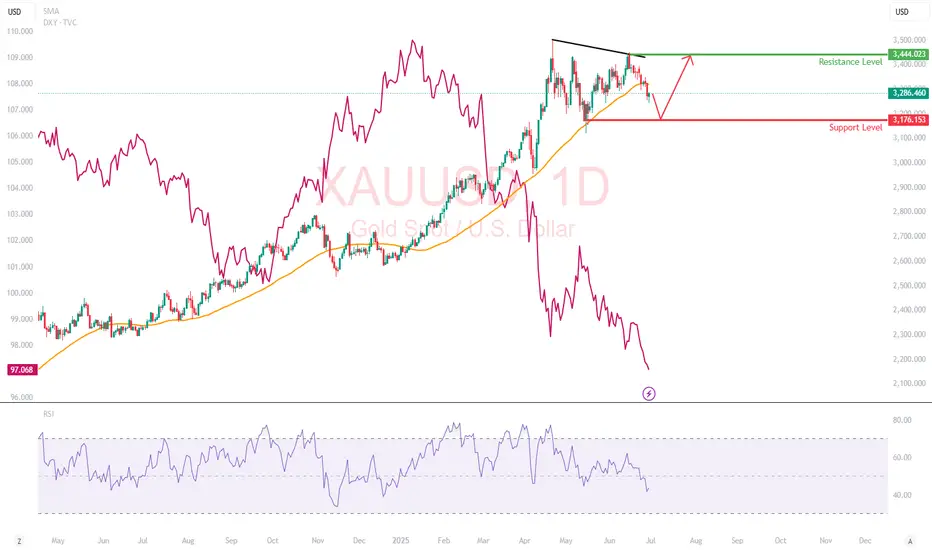
Technical Breakdown
Gold has broken below its 50-day SMA at $3,322 and is trading in the lower third of its 3-month range. While the daily candles show increasing selling pressure, especially on lower highs (a sign of weakening bullish momentum)
RSI : Falling toward 40, with no bullish divergence yet.
Support Level : $3,176: Previous swing low
Resistance Level : $3,444: previous swing high
What This Move Might Be Telling Us
When gold sells off on dollar weakness and geopolitical calm, the market isn’t just relaxing. It is rotating. The de-grossing of gold-heavy hedges: Some hedge funds may be taking profit on gold-heavy exposure from Q1’s rally.
Rise of risk appetite despite cracks: Markets are forward-pricing trade peace and earnings resilience, possibly too early. Gold might not be in trouble, but it’s on the bench. Unless something reignites fear (e.g., Fed policy mistake, Middle East flashpoint, or economic shock), capital may stay elsewhere.
Analysis of Gold's Opening Market Strategy on MondayOn last Friday, both the data and news fronts were bearish, leading to a step-by-step decline in gold prices. The bears completely dominated the market, and the feeble rebound made it difficult for long-position holders to exit. Gold trended lower in a volatile and slow decline, rebounding only to a high of 3,321 before plummeting all the way, consecutively breaking through the 3,300 psychological barrier, the 3,280 support level, and the daily trend line.
For the trend at next week's opening, the first target is to observe whether the 3,270 support level stabilizes and triggers a rebound. This level is not only a technical support but also a position where long positions can be considered for deployment. Market laws show that a rebound often follows a unilateral downtrend, and this area may trigger a price recovery. If the key support is broken, the downtrend is likely to continue, with the next focus on the 3,250-3,245 support zone.
In terms of operations, it is recommended to maintain a bearish strategy of "selling on rallies," with key attention paid to the resistance area of 3,313-3,321. Short positions should be deployed by relying on this level.
you are currently struggling with losses,or are unsure which of the numerous trading strategies to follow,You have the option to join our VIP program. I will assist you and provide you with accurate trading signals, enabling you to navigate the financial markets with greater confidence and potentially achieve optimal trading results.
Trading Strategy:
sell@3300-3295
TP:3250-3260
XAUUSDThe market broke the strong support to now resistance and more bearish momentum expected as the bulls let go of bears to take control.

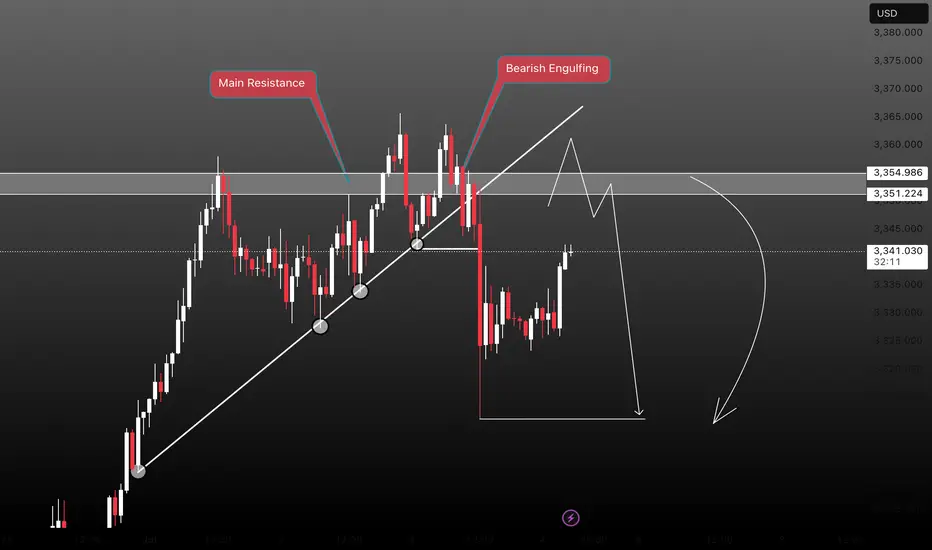
GOLD SHORT TRADEH1 TIMRFAME
1st Zone GOLD SHORT TRADE AT MAIN RESISTANCE AND ENGULFING ZONE
2nd Zone GOLD SHORT TRADE TLBP PULLBACK SELL AT SELL TRENDLINE
1st Signal : GOLD SELL MAIN RESISTANCE 3351- 3355
Stoploss : 3360
TP Level - 3345, 3340, 3335, 3330
2nd Signal : GOLD SELL TLBP PB TL 3360 - 3366
Stoploss : 3372
TP Levels - 3355, 3350, 3345, 3340, 3335, 3330
Manage Your Trade Properly
BREAK THE HIGHI can see gold getting ready to move upside again. If it's in our favour, check the reaction above the price of 3425. it may give other continuation thee above price 3425 to move more upside
OANDA:XAUUSD FOREXCOM:XAUUSD FXOPEN:XAUUSD FOREXCOM:XAUUSD
As always, market wins! trade with care. be a part of the market
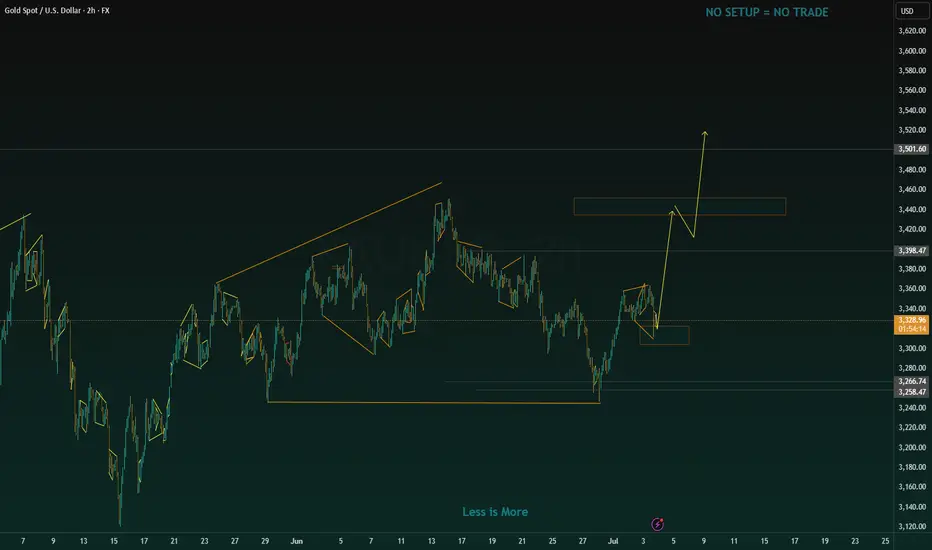
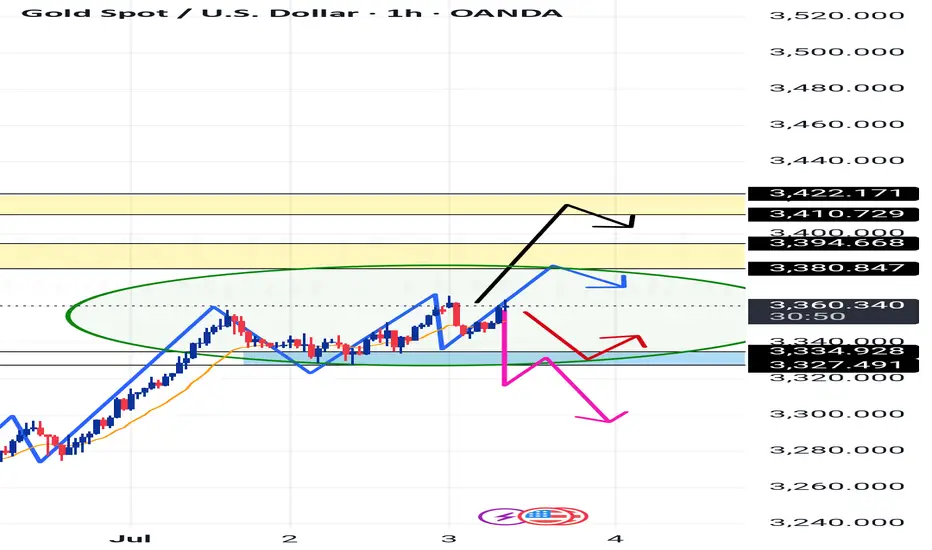
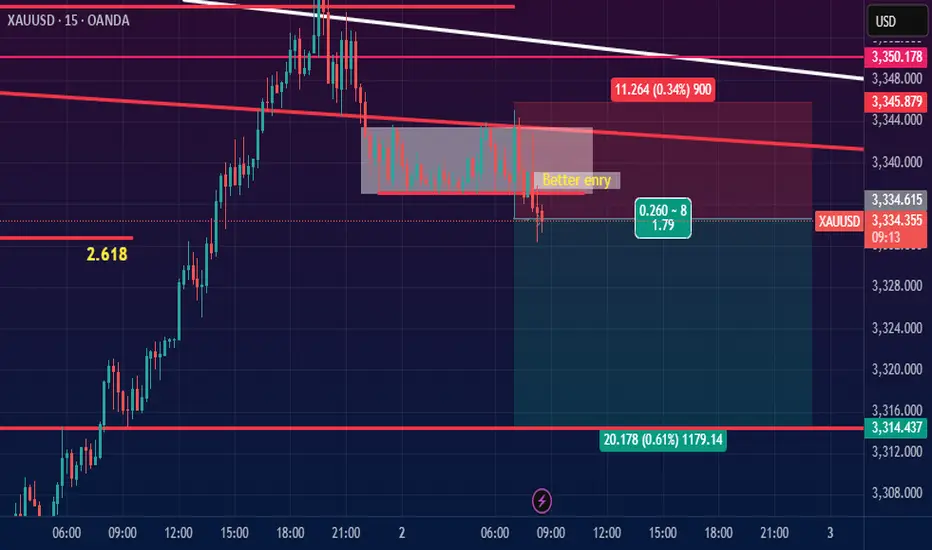
Plan for London on NFP Day (03.07.2025)⚠️ Disclaimer:
This is not financial advice. It’s simply my personal trade plan and analysis.
I just want to share knowledge for free – that’s all.
My concept is: Keep it simple, stupid.
Life is already complicated enough thanks to the people around me, so I prefer to keep things simple… at least when it comes to my charts. 😆
---
📈 London Session Trade Plan (only for London session)
Resistance Zones
Zone 1: 3422 – 3410
Zone 2: 3394 – 3380
Support Zone
Zone 1: 3334 – 3327
Entry Strategy – I’m watching for 4 main scenarios:
1. Blue Arrow:
If price reaches Resistance Zone 1 → wait for clear PA (Price Action) on M15 or M30 → then look to Sell
2. Black Arrow:
If price reaches Resistance Zone 2 → wait for PA on M15 or M30 → then Sell
3. Red Arrow:
If price drops to Support Zone 1 → wait for PA on M15 or M30 → then Buy
4. Pink Arrow:
If price breaks below Support Zone 1 → wait for price to pull back → then Sell
(In this case, I’ll use Fibonacci to assist with entries – key levels: 50.0 and 61.8)
But for today, I give this scenario a lower win rate compared to my other techniques. So I’ve decided not to use this strategy for the London session.
---
‼️Scenario 5 – Sideways Market
If price just keeps ranging inside the green circle and there's no clear PA → I will not react at all.
This is common before big events like NFP. No signal = No action.
---
✅ Reminders to Myself:
I'm an intraday trader who separates sessions by market behavior.
Today is NFP day, and price often moves wildly and irrationally.
It's okay to stay out of the market.
When in doubt
XAUUSD BUY NOWXAUUSD @ 3343.00
TP: 3353.00
SL: 3338.00
Do not get attached, do not get greedy, do not buck the trend.
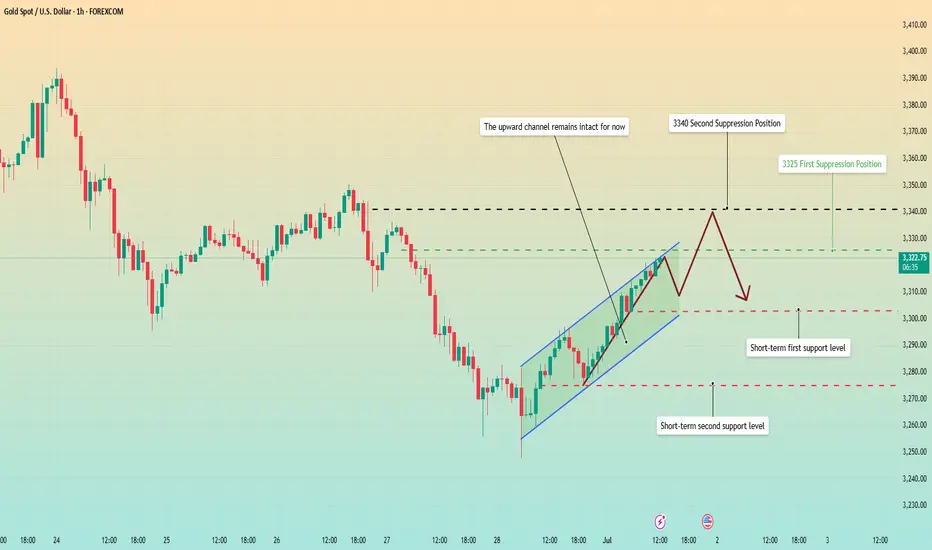
Focus on tomorrow’s non-farm payrolls!Gold hourly chart;
Gold short-term analysis; Gold 4-hour analysis shows that the stochastic indicator is golden cross, which is a bullish signal; MACD indicator double lines stick together upward, which is a bullish signal; 4-hour bias continues to rise; 4-hour downward trend channel is temporarily suppressed, and the pressure position is near 3355, which is the only empty point today; the short-term support position is temporarily near 3320;

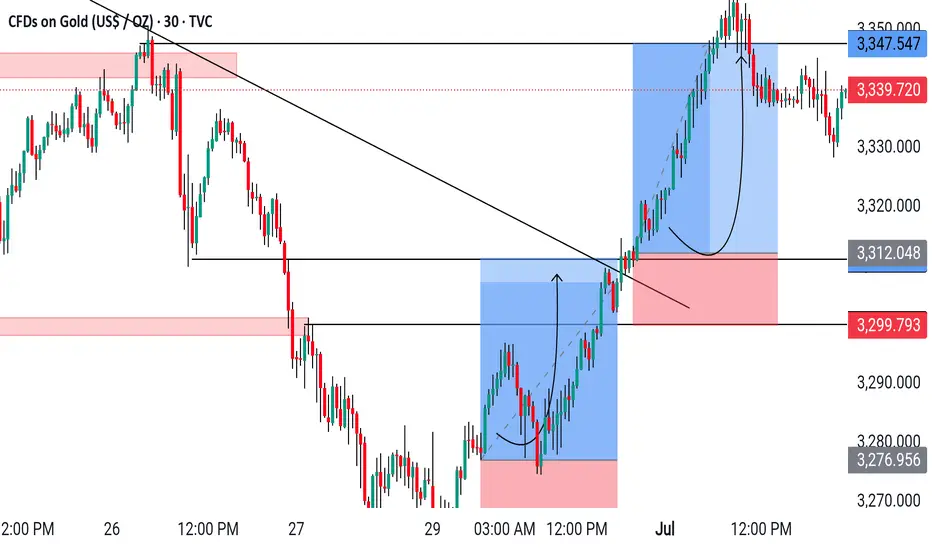
XAUUSD/GOLD M30 Chart Analysis .XAUUSD/GOLD 🎯🚀
Target SMASHED ✅💥
Pure accuracy, pure profit — enjoy the results! 🤑🔥
Stay tuned for the next sniper shot! 📊💰
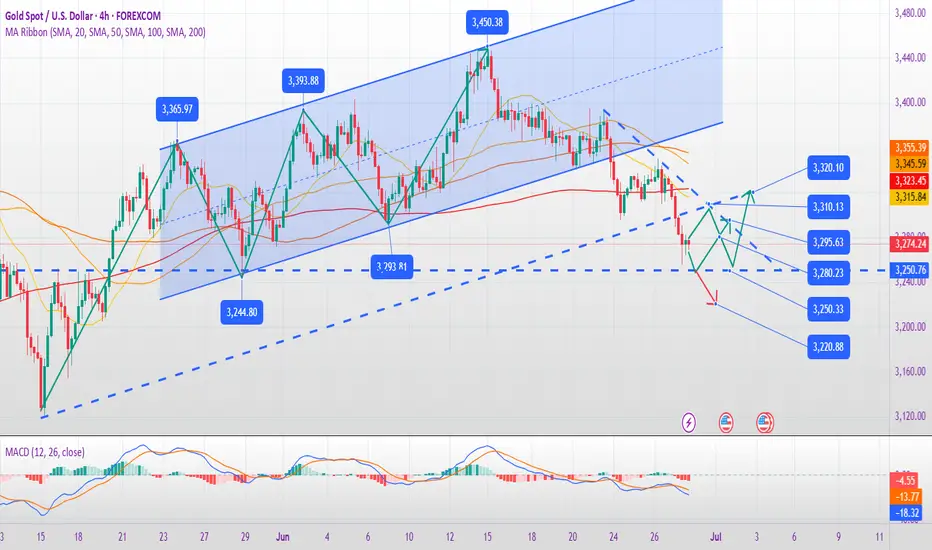
Gold Base Drop BaseGold needs a correction, it has made a very extreme increase yesterday, but the increase is not forever, it needs a healthy correction too, with a drop base drop pattern.
Gold technical analysis and operation suggestionsGold technical analysis and operation suggestions
Market review:
Yesterday, gold showed a bottoming-out and rebounding trend. It quickly dropped to 3250 in the Asian session and then stabilized and rebounded. It rose in the European and US sessions, reaching a high of 3296 before falling under pressure. After the US session stepped back to 3270 for the second time to confirm support, it accelerated to rise, breaking through the 3300 integer mark. The daily line closed with a bottoming-out and rebounding, indicating that the 3250 support is effective, and the short-term adjustment may come to an end.
Current trend:
Gold prices continued to rebound after opening today, and now hit the 3320 line. It is necessary to pay attention to the 3324 long-short watershed pressure. If it breaks through effectively, it will confirm the reversal, and you can step back and follow up with long orders; on the contrary, if it falls under pressure, consider arranging short orders at high levels.
Technical points:
4-hour chart: 3324 is the key long-short watershed, and the support below is 3295-3301 (yesterday's resistance conversion position).
Operation idea: high short and low long within the range, follow up after breaking through 3324.
Operation strategy:
Short order: 3321-24 light position short, stop loss 3332, target 3295-3301, hold after breaking down.
Long order: 3295-3301 stabilizes and goes long, stop loss 3287, target 3320-24, hold after breaking through.
Next week's gold trend analysis strategy:
1. News interpretation: Fed policy and market sentiment dominate the direction
✦ Review of key factors:
The situation in the Middle East has eased
The safe-haven demand for gold has declined, which is bearish for gold prices.
Fed Focus: PCE Price Index
If PCE data rises → Strengthen interest rate hike expectations → Gold prices are under pressure
If personal spending is weak → Interest rate hike expectations slow down → Favorable gold price rebound
Investors' wait-and-see sentiment heats up
→ There is no panic selling in the market, and it tends to fluctuate downward rather than plummet.
2. Technical analysis: Bearish dominance, pay attention to key support areas
Daily structure:
The bearish trend is clear, and the moving average system turns downward;
The price is running near the lower track of the Bollinger band, and there is a suspicion of short-term oversold;
The 3280-3295 area constitutes a pressure zone, which has not been broken after multiple tests.
Key points at the 4-hour level:
A step-down channel is clearly formed;
Support levels gradually move downward, a typical bearish pattern;
Lower support: 3270 → 3263 → 3250-3245
Upper pressure: 3280 → 3300 → 3310
III. Gold trend forecast for next week
📉 Main trend: bearish, short-term or bottoming out
If it falls to the 3245-3250 area, a short-term technical rebound can be expected;
After the rebound, it may be blocked again in the 3280-3295 range, suitable for short selling;
Unless it strongly recovers above 3310, it will be difficult to reverse the downward trend.
IV. Operation strategy suggestions (core)
Sell on highs 3285 - 3295 Stop loss 3310 Target 3255 / 3245 Layout short orders near resistance
Trend bottom-picking 3245 - 3250 Stop loss 3238 Target 3275 / 3280 Oversold rebound expected, try to buy long with a light position
Aggressive short selling near 3310 Stop loss above 3336 Target 3280 / 3263 Top and bottom conversion resistance level, if the test is not broken, short
V. Summary and Outlook
✅ Conclusion: Next week, the trend of gold will still be "high-short as the main and low-long as the auxiliary", focusing on the game between 3250 support and 3295 pressure level.
Gold has not yet broken out of the short structure, and the inertial decline after breaking 3295 will continue. It is recommended that traders avoid chasing ups and downs, strictly implement stop losses, and remain flexible.
Gold bulls rise, continue to go long after falling backBecause it broke through the key suppression of 3324, we can go long on the contrary. The upper long position target is 3348. Although many people insist on being bearish, we must grasp the trend of the market and analyze it with technical aspects as the main and news as the auxiliary. At present, long orders are already profitable. Be a person who makes comprehensive judgments and don’t be at a loss about market analysis because of stop loss. If your current gold operation is not ideal, I hope I can help you avoid detours in your investment. Welcome to communicate with me!
From the 4-hour analysis, the upper focus is on the 3345 line of pressure, the lower short-term support is around 3314-3316, and the key support is 3295-3301. The overall support is based on this range to maintain the main tone of low-multiple participation. In the middle position, watch more and do less, be cautious in chasing orders, and wait patiently for key points to enter the market.
Gold operation strategy:
Gold is long at 3316-24, and it will be long at 3295-3303 when it falls back, with a stop loss at 3293 and a target at 3348. If it breaks, continue to hold;

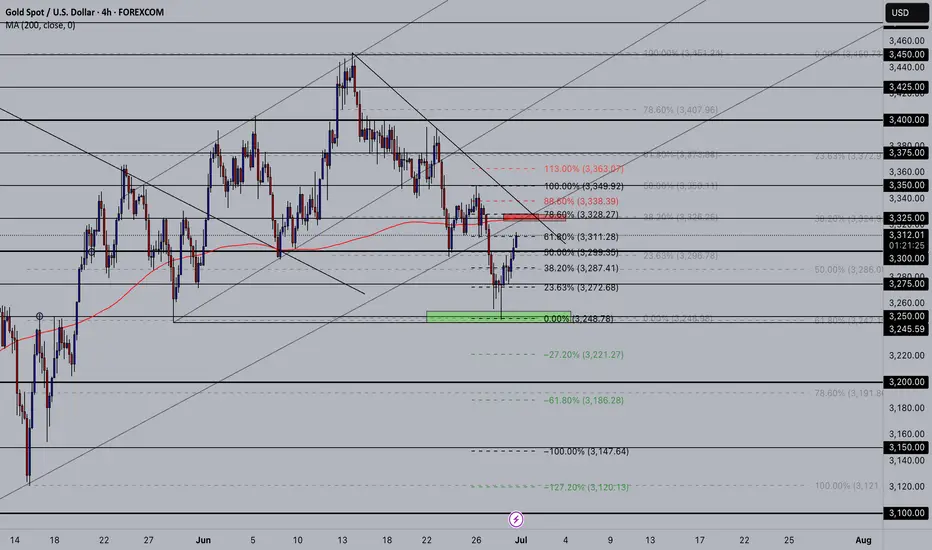
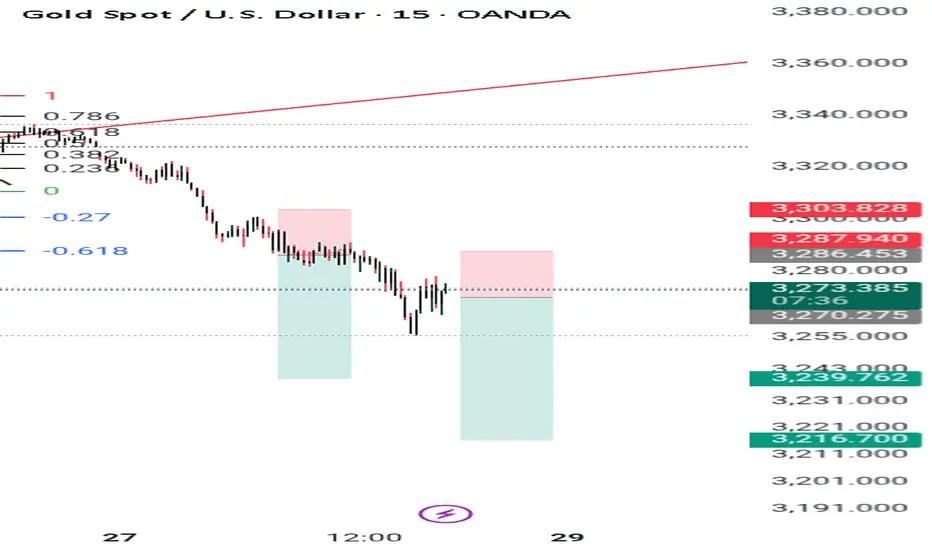
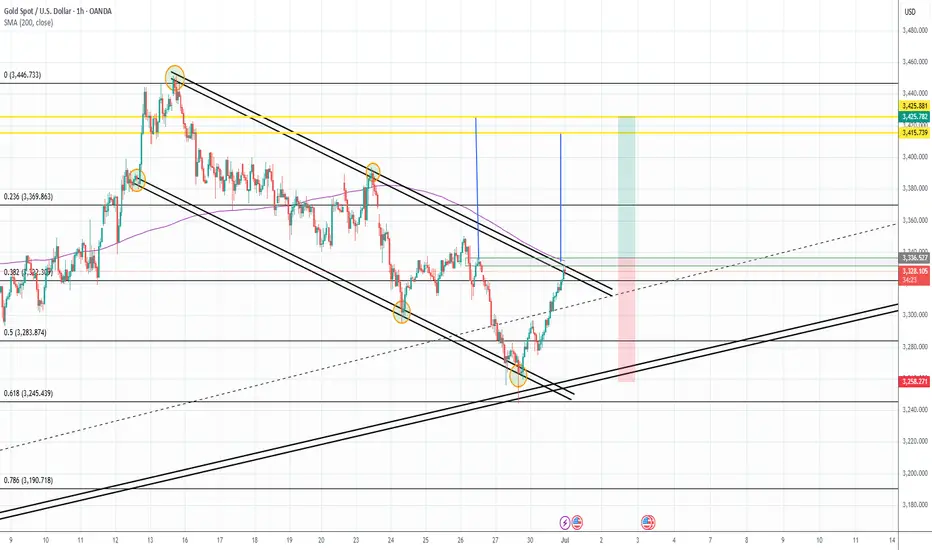
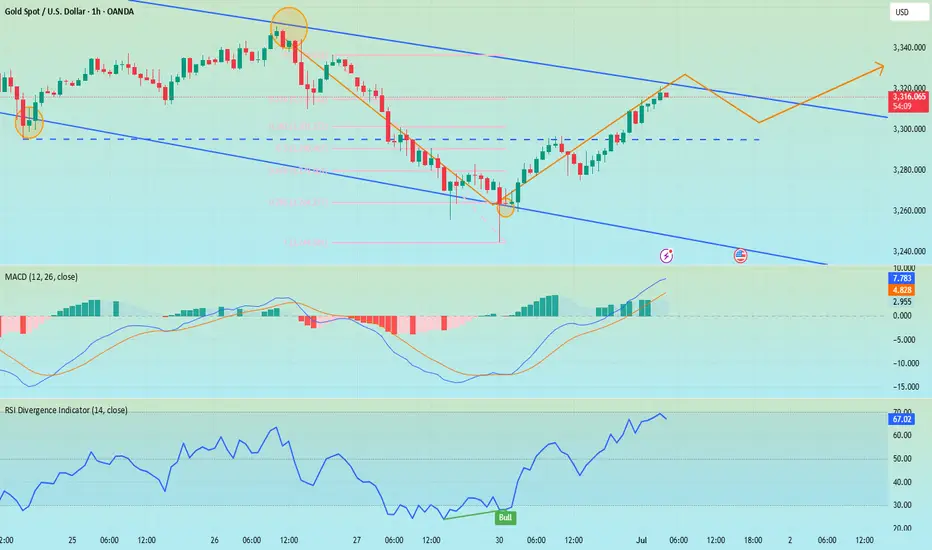
Gold Breaks Key Resistance — Bullish Spike in FormationGold dropped to the 61% Fibonacci retracement level, aligning with the long-term ascending trendline, where it showed a strong bullish rejection.
Currently, price is breaking out of the descending channel and the 200 SMA, and is beginning to form a potential bullish spike formation.
If this pattern completes and breaks to the upside, we would have three confluencing technical signals pointing to a possible target area around $3,425.881.
📌 I’ll wait for a confirmed breakout of the bullish spike to look for long entries.
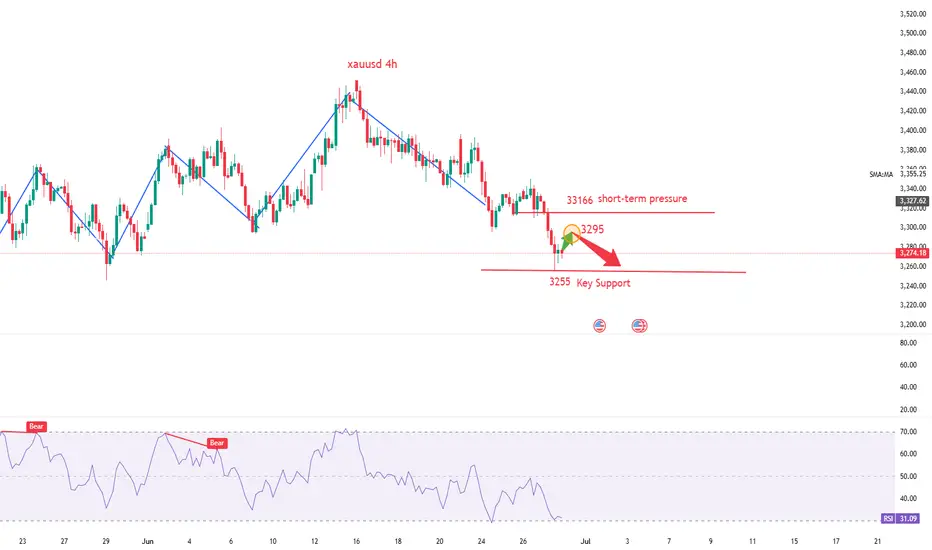
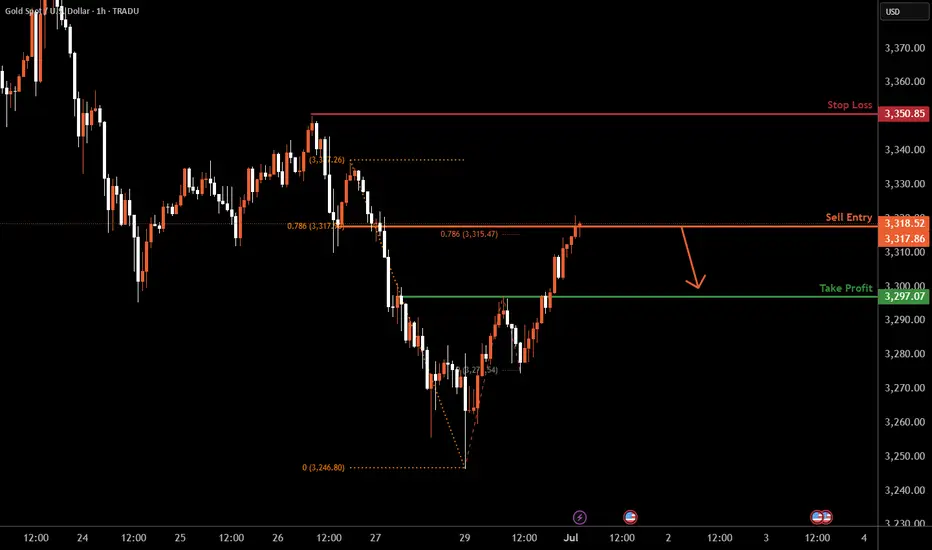
XAUUSD H1 I Bearish Drop Based on the H1 chart analysis, we can see that the price is trading near our sell entry at 33192, which is a pullback support.
Our take profit will be at 3297.07, a pullback support.
The stop loss will be placed at 3350.85, which is a swing high resistance.
High Risk Investment Warning
Trading Forex/CFDs on margin carries a high level of risk and may not be suitable for all investors. Leverage can work against you.
Stratos Markets Limited (tradu.com ):
CFDs are complex instruments and come with a high risk of losing money rapidly due to leverage. 63% of retail investor accounts lose money when trading CFDs with this provider. You should consider whether you understand how CFDs work and whether you can afford to take the high risk of losing your money.
Stratos Europe Ltd (tradu.com ):
CFDs are complex instruments and come with a high risk of losing money rapidly due to leverage. 63% of retail investor accounts lose money when trading CFDs with this provider. You should consider whether you understand how CFDs work and whether you can afford to take the high risk of losing your money.
Stratos Global LLC (tradu.com ):
Losses can exceed deposits.
Please be advised that the information presented on TradingView is provided to Tradu (‘Company’, ‘we’) by a third-party provider (‘TFA Global Pte Ltd’). Please be reminded that you are solely responsible for the trading decisions on your account. There is a very high degree of risk involved in trading. Any information and/or content is intended entirely for research, educational and informational purposes only and does not constitute investment or consultation advice or investment strategy. The information is not tailored to the investment needs of any specific person and therefore does not involve a consideration of any of the investment objectives, financial situation or needs of any viewer that may receive it. Kindly also note that past performance is not a reliable indicator of future results. Actual results may differ materially from those anticipated in forward-looking or past performance statements. We assume no liability as to the accuracy or completeness of any of the information and/or content provided herein and the Company cannot be held responsible for any omission, mistake nor for any loss or damage including without limitation to any loss of profit which may arise from reliance on any information supplied by TFA Global Pte Ltd.
The speaker(s) is neither an employee, agent nor representative of Tradu and is therefore acting independently. The opinions given are their own, constitute general market commentary, and do not constitute the opinion or advice of Tradu or any form of personal or investment advice. Tradu neither endorses nor guarantees offerings of third-party speakers, nor is Tradu responsible for the content, veracity or opinions of third-party speakers, presenters or participants.
The latest analysis and layout of gold in July made a good start📰 News information:
1. Geopolitical situation
2. PMI data
📈 Technical Analysis:
Yesterday, we gave the idea of looking at the upper resistance of 3310-3320. The 4H pressure is still at 3327. As long as this key resistance level is not effectively broken, gold will fall again. On the contrary, if it stabilizes above 3327, the trend may reverse. In the short term, pay attention to the upper resistance of 3327. If it is not broken, you can short with a light position. If it falls below 3300-3290, consider going long.
🎯 Trading Points:
SELL 3310-3320
TP 3305-3300
BUY 3300-3290
TP 3310-3320-3350
In addition to investment, life also includes poetry, distant places, and Allen. Facing the market is actually facing yourself, correcting your shortcomings, confronting your mistakes, and strictly disciplining yourself. I hope my analysis can help you🌐.
TVC:GOLD FXOPEN:XAUUSD PEPPERSTONE:XAUUSD FOREXCOM:XAUUSD OANDA:XAUUSD TVC:GOLD
Trading Strategies Amid Geopolitical and Policy GamesToday's gold price rebounded above $3,280 after opening with a dive to a low of $3,247, showing a volatile trend.
Influencing Factors
- Geopolitics: The ceasefire between Israel and Iran earlier caused gold prices to fall, but Trump's threat to bomb Iran again and maintain sanctions has revived market risk aversion, supporting gold prices with some bargain hunting.
- Monetary Policy: Expectations for Fed rate cuts have fluctuated. The CME FedWatch Tool shows an 81.9% probability of unchanged rates in July and a 76% probability of a cumulative 25-basis-point cut by September. U.S. economic data (e.g., personal consumption expenditure) and tariff policies are influencing gold's trajectory.
- Capital Flows: Global gold ETF demand turned negative in May, with outflows led by North American and Asian funds, putting downward pressure on gold prices.
Technical Analysis
Gold rebounded after a pullback last week, closing with two consecutive weekly gains. The $3,300-$3,310 range is a key resistance zone: a firm break above could signal a short-term trend reversal, while failure to do so may lead to a test of $3,200. On the daily chart, moving averages are bearish, MACD forms a death cross below the zero axis with expanding green bars (indicating dominant bearish momentum), but RSI at 39 near oversold levels suggests potential short-term rebound for correction.
Trading Strategy
Short gold on a rebound to the $3,305-$3,310 resistance zone, setting a stop-loss at $3,320. Initial targets are $3,280-$3,290, where profits can be gradually taken based on price action and market sentiment. If the decline continues, adjust targets downward to around $3,250, and flexibly adapt to real-time market conditions.
XAUUSD
sell@3300~3310
SL:3320
TP:3290~3280-3270
I am committed to sharing trading signals every day. Among them, real-time signals will be flexibly pushed according to market dynamics. All the signals sent out last week accurately matched the market trends, helping numerous traders achieve substantial profits. Regardless of your previous investment performance, I believe that with the support of my professional strategies and timely signals, I will surely be able to assist you in breaking through investment bottlenecks and achieving new breakthroughs in the trading field.
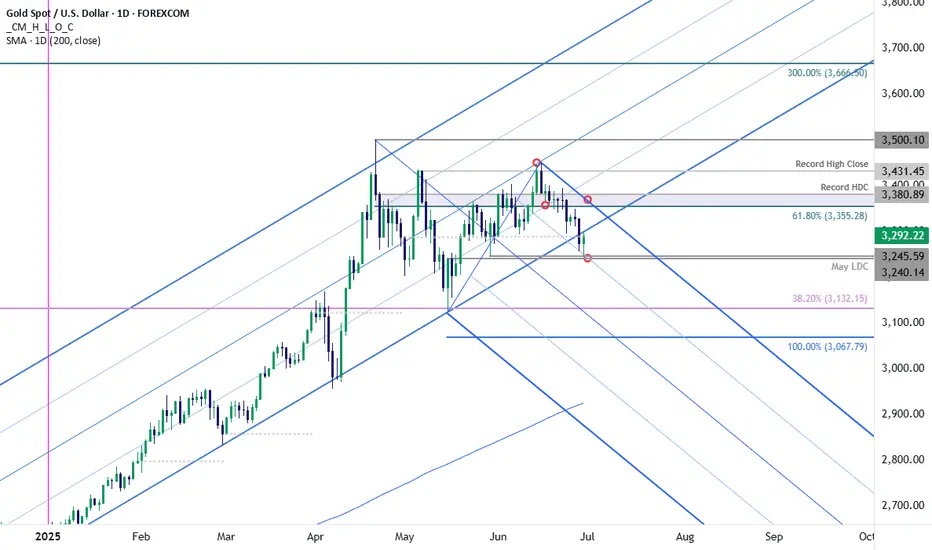
Gold Threatens Yearly Support- Bulls on NoticeGold is threatening a break of the yearly uptrend with Friday’s decline clearing the monthly range low. The focus into the start of the month is on technical support at the 5/29 swing low / May low-day close (LDC) 3240/45.
A break / close below this threshold would be needed to suggest a more significant correction is underway towards the 38.2% retracement of the November rally at 3132 and the 100% extension of the April decline at 3072- both areas of interest for possible downside exhaustion / price inflection IF reached. Resistance now at 3355/80 with a breach above the Record high-close at 3431 needed to mark resumption of the broader uptrend.
-MB
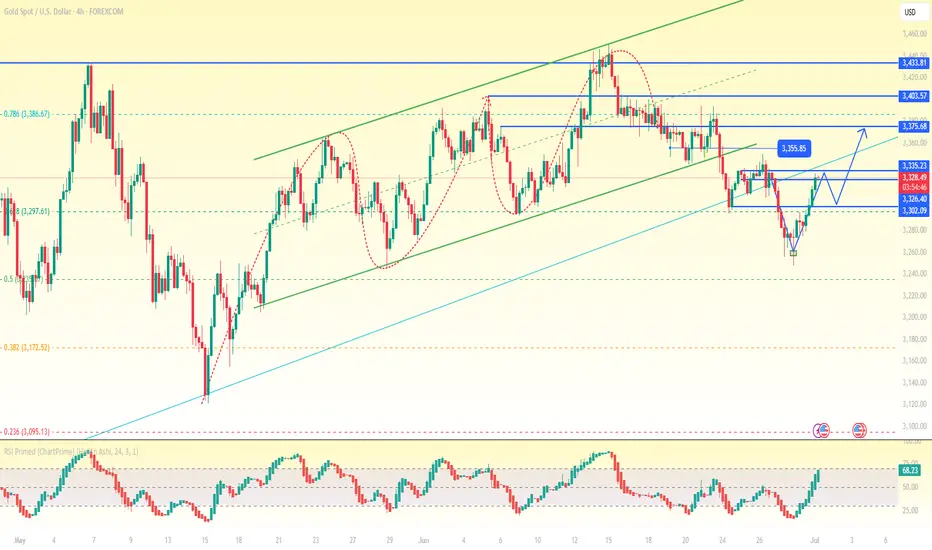
Daily XAUUSD AnalysisGold Took Supprt From The 3255 Level So a Pullback Could Be a Buying Opportunity