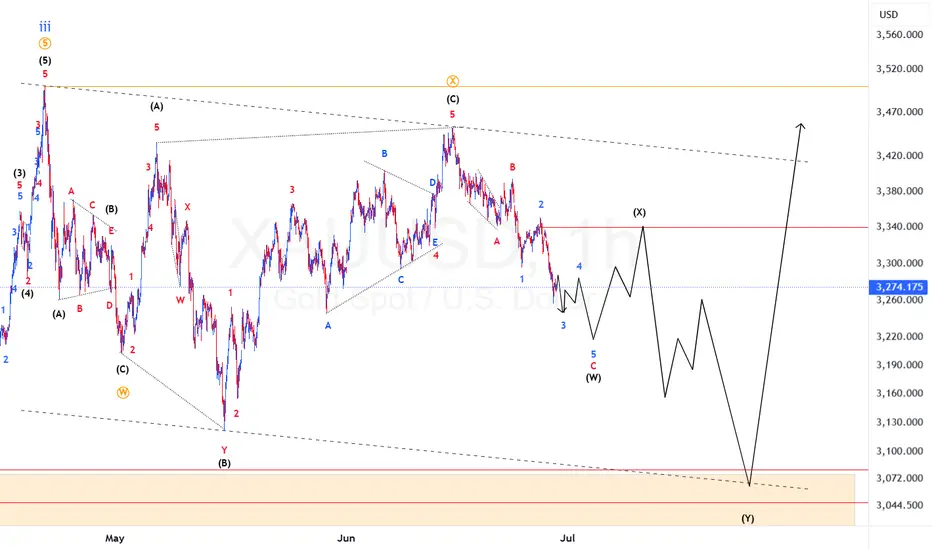
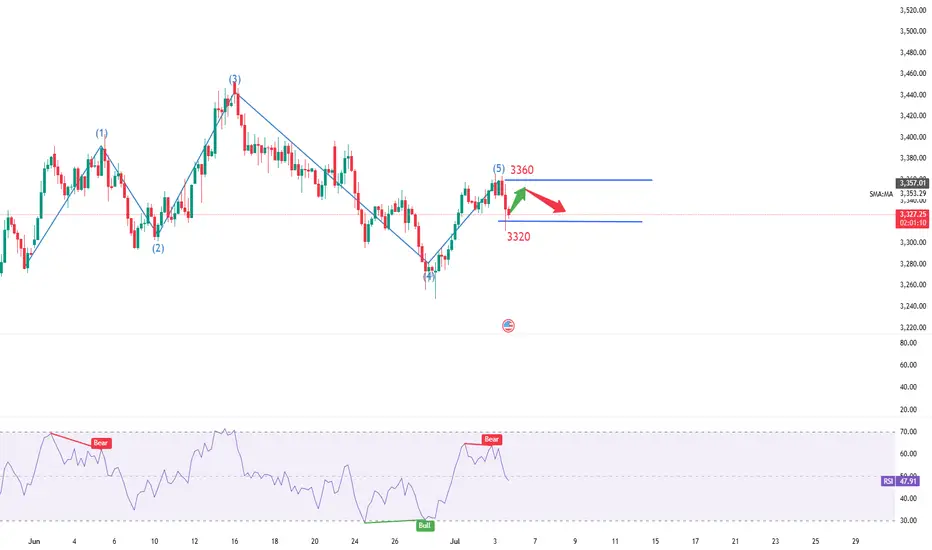
XAUUSD Elliot wave update: Is wave 4 still in play?From our previous count we were anticipating a drop for 4th wave completion. We can see now we have been dropping as anticipated. Given the current wave structure I am expecting a double 3 (wxy) to complete this 4th wave. If we are correct then we should expect price to continue down from current position before pulling back up and fall one more time. To take advantage of the move if not caught at the top, one should find areas where price will find resistance to short the market.
XAUUSD.F trade ideas
Definitive Micro-Analysis & Actionable Forecast: XAUUSDHigh-Level Strategy (Monthly/Weekly/Daily Recap)
Overall Market Condition: The primary trend has shifted from Bullish to Bearish/Corrective due to the Monthly Bearish Engulfing and Weekly Three Black Crows patterns.
Immediate Tactical Bias: The Daily Bullish Harami pattern strongly indicates a pause in the downtrend and the high probability of a short-term corrective rally (a "bounce").
Our Goal: To map out the entry, targets, and invalidation levels for this anticipated bounce.
Deep Dive: The Lower Timeframes (4H, 1H, 30M, 15M, 5M)
Consolidation After the Low (4H & 1H):
Candlestick Reading : As observed, after the low was made (~2318), the price action on the 1H and 4H charts has stopped making new lows. Instead, it is building a base, characterized by a series of Dojis and Spinning Tops. This is a classic sign of indecision and absorption, where selling pressure is drying up and buyers are beginning to tentatively step in. This is the "coiling spring" phase before the bounce.
The Trigger (15M & 5M):
Candlestick Reading: On the 15M and 5M charts, we are looking for the very first sign that buyers are taking control. The ideal trigger would be a clear, small-scale Bullish Engulfing or Tweezer Bottom pattern forming at the bottom of this consolidation range. As of the last candle on the 5M chart, we see a small green candle attempting to move up, but the trigger is not yet confirmed.
The Full Storyboard: From Entry to Exit with Price Levels
For those interested in further developing their trading skills based on these types of analyses, consider exploring the mentoring program offered by Shunya Trade.
I welcome your feedback on this analysis, as it will inform and enhance my future work.
Regards,
Shunya Trade
⚠️ Disclaimer: This post is educational content and does not constitute investment advice, financial advice, or trading recommendations. The views expressed here are based on technical analysis and are shared solely for informational purposes. The stock market is subject to risks, including capital loss, and readers should exercise due diligence before investing. We do not take responsibility for decisions made based on this content. Consult a certified financial advisor for personalized guidance.
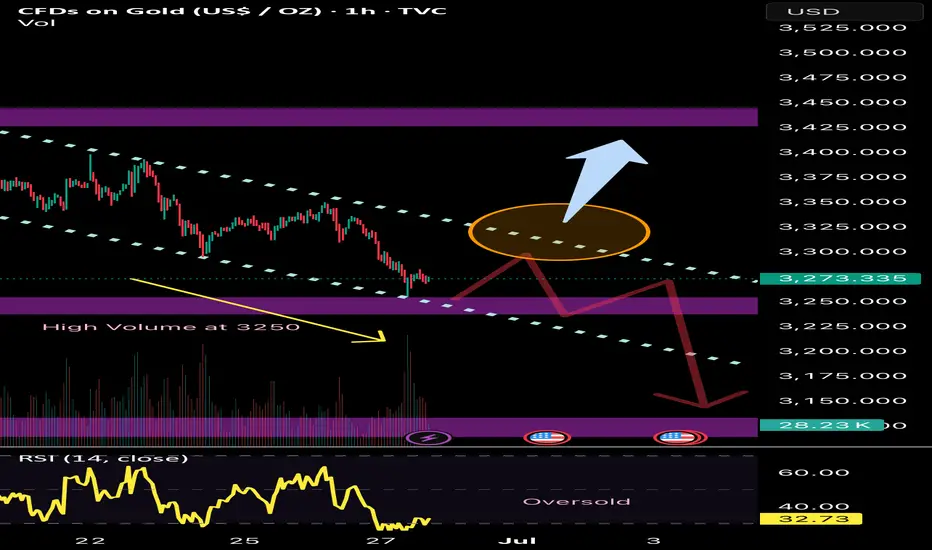
Will the FALL continues?Last trade idea was fulfilled and went into the downside. Targeted 3250. If this 3250 major support area breaks down, we can expect a bigger downside move.
However, there’s a huge buying that happened at that level. It may first have a pullback upwards before it continues its decline. RSI is also at oversold level.
Bullish reversal can be confirmed if 3350 gets broken.
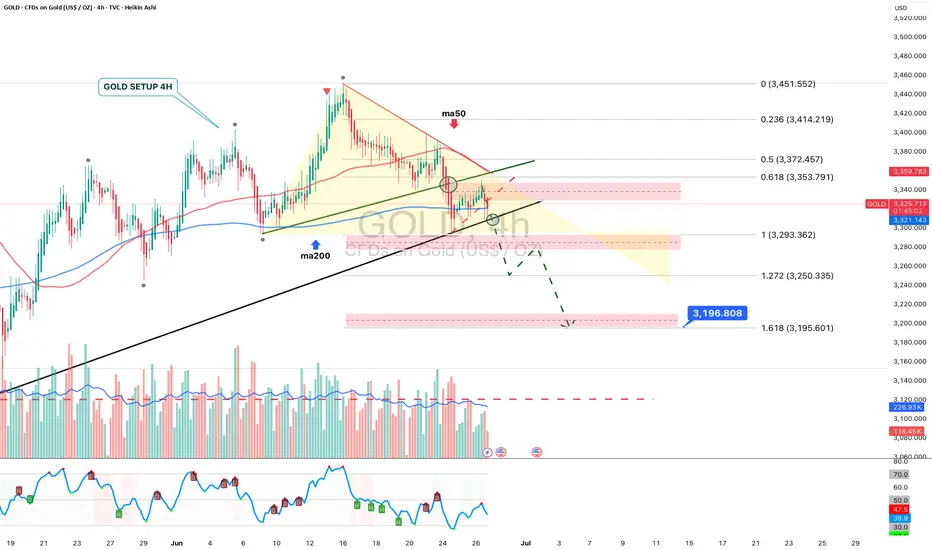
GOLD 4H: not all that glitters is bullish...The 4H chart shows a clean descending triangle breakdown. Price failed to reclaim the trendline and was rejected under both MA50 and MA200. The bounce into 3325–3340 was absorbed — classic liquidity sweep and fade. Volume confirms bearish control.
Technically, the breakdown below 3320 opens the way toward $3293 (1.0 Fibo), $3250 (1.272 extension), and final target at $3195 (1.618), where buyers might step in. RSI supports the continuation without signs of reversal. Structure broke — and the market is telling us where it's heading.
Tactical plan:
— Entry at market or on a retest of $3325–3335
— Targets: $3293 → $3250 → $3195
— Stop: above $3340 (above MA50 and broken trendline)
When gold looks shiny, smart traders look deeper. This breakout isn’t golden — it’s a trap for late bulls.
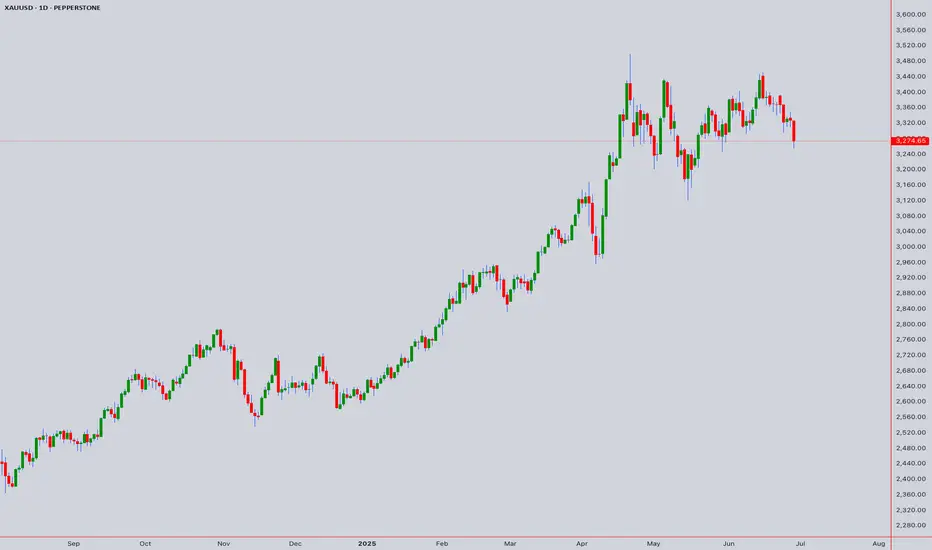
Ready, Steady...?Gold has consolidated the past few weeks and has now bounced from solid support.
The current wave 4 looks complete and should now be followed by a strong upward move in wave 5, wave 5's in the metals are the strongest...expect a move towards $4000 coming.
Your chance to get on board early and ride this bull run again!
Appreciate a thumbs up, good trading and God Bless you all!

Gold Trade Plan 27/06/2025Dear Traders,
📉 XAUUSD Technical Analysis – June 27, 2025
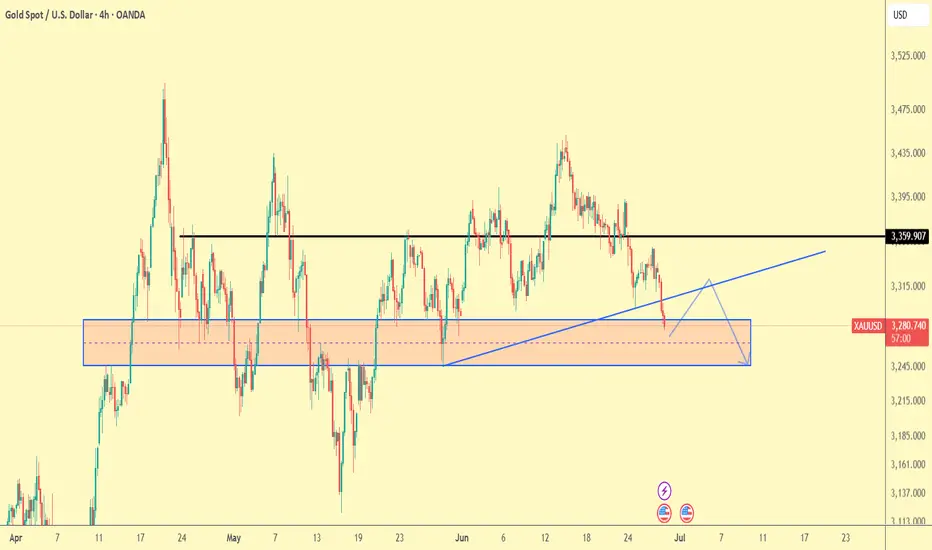
On the 4-hour chart, Gold has faced selling pressure after testing the resistance at 3359, and is now correcting down toward the key support zone at 3250–3280.
📌 Key Support Zone: 3250 – 3280
📌 Major Resistance: 3359
🔹 The price is currently testing the lower edge of this support zone. If we see bullish reversal candles (such as a hammer or bullish engulfing) in this area, we may expect a bounce back toward the rising trendline or even a retest of the 3359 level.
🔻 However, if the 3250 support fails to hold, a deeper drop toward 3200 or lower could follow.
🛑 The U.S.–China agreement news could have a direct impact on gold’s corrective trend. Caution is advised when entering trades.
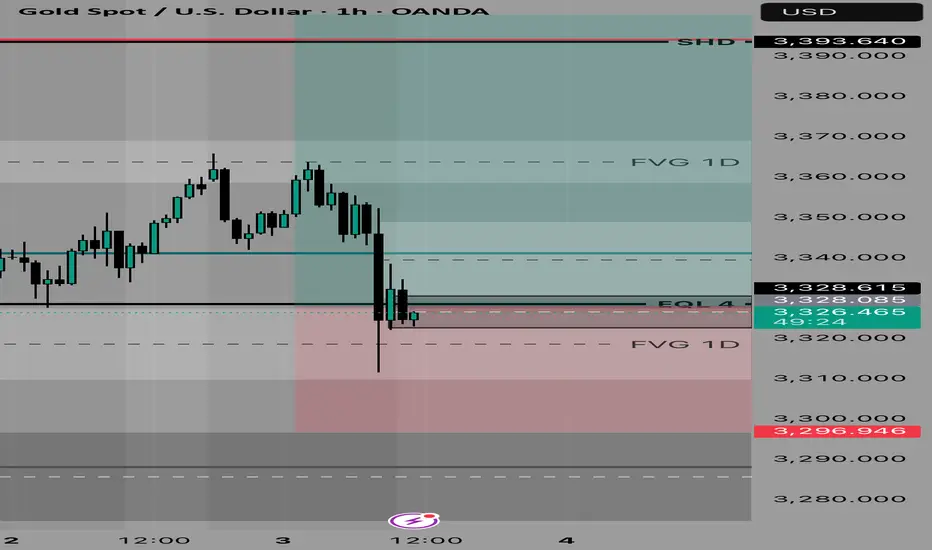
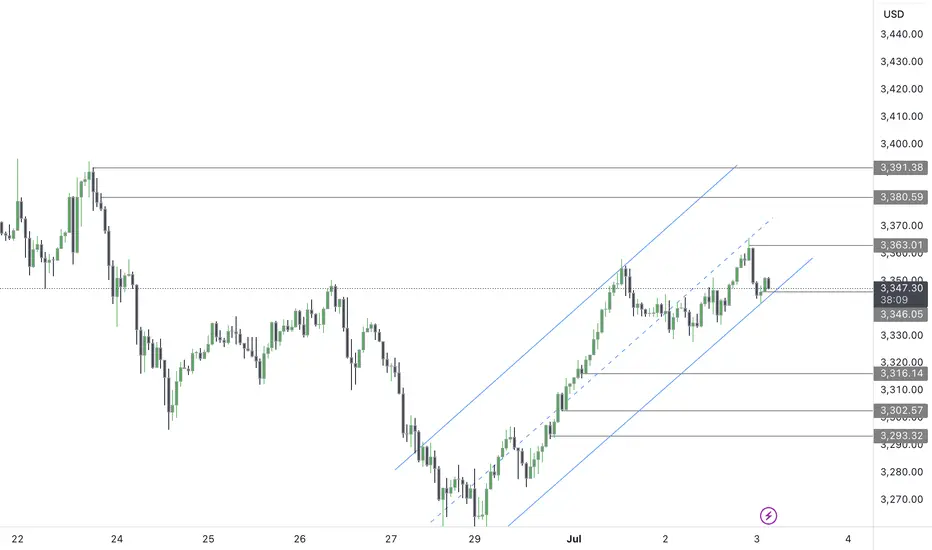
GOLD 1H CHART ROUTE MAP UPDATE & TRADING PLAN FOR THE WEEKHey Everyone,
Please see our updated 1h chart levels and targets for the coming week.
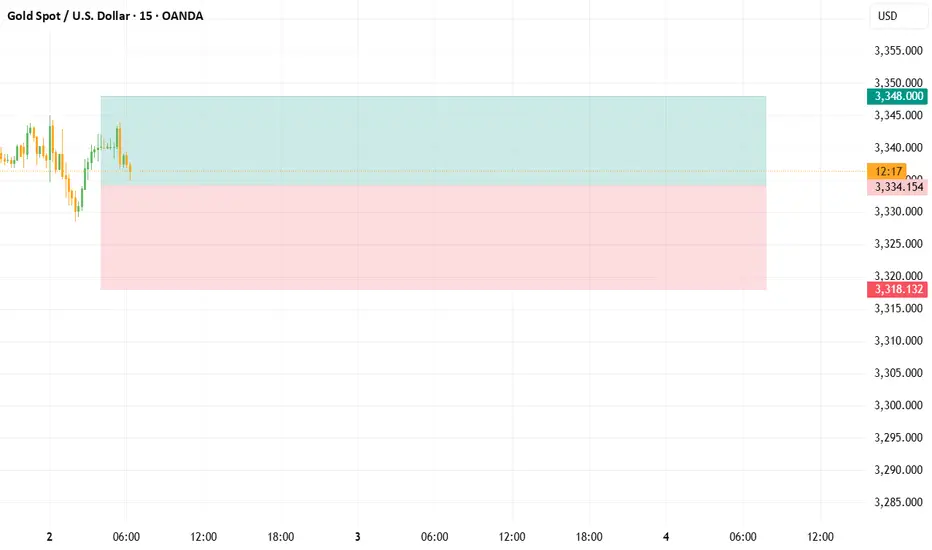
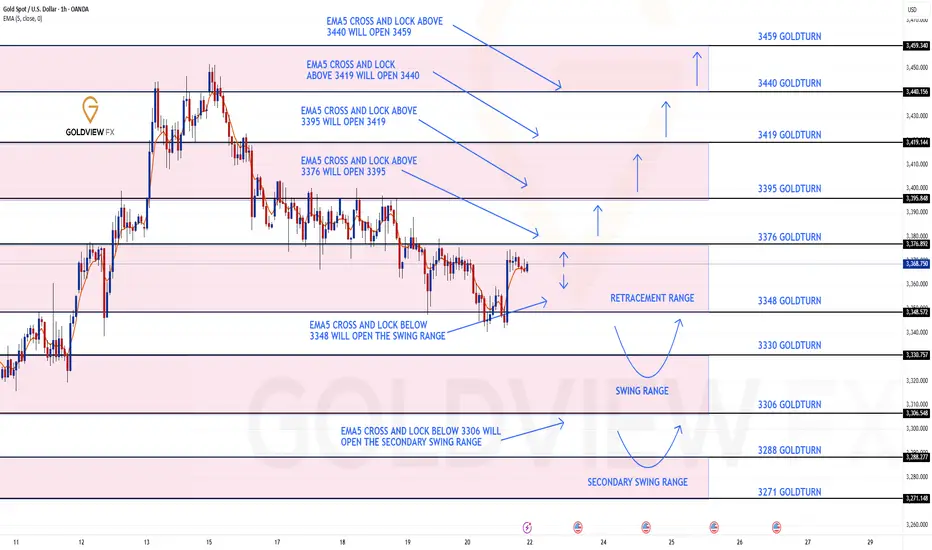
We are seeing price play between two weighted levels with a gap above at 3376 and a gap below at 3348. We will need to see ema5 cross and lock on either weighted level to determine the next range.
We will see levels tested side by side until one of the weighted levels break and lock to confirm direction for the next range.
We will keep the above in mind when taking buys from dips. Our updated levels and weighted levels will allow us to track the movement down and then catch bounces up.
We will continue to buy dips using our support levels taking 20 to 40 pips. As stated before each of our level structures give 20 to 40 pip bounces, which is enough for a nice entry and exit. If you back test the levels we shared every week for the past 24 months, you can see how effectively they were used to trade with or against short/mid term swings and trends.
The swing range give bigger bounces then our weighted levels that's the difference between weighted levels and swing ranges.
BULLISH TARGET
3376
EMA5 CROSS AND LOCK ABOVE 3376 WILL OPEN THE FOLLOWING BULLISH TARGETS
3395
EMA5 CROSS AND LOCK ABOVE 3395 WILL OPEN THE FOLLOWING BULLISH TARGET
3419
EMA5 CROSS AND LOCK ABOVE 3419 WILL OPEN THE FOLLOWING BULLISH TARGET
3440
BEARISH TARGETS
3348
EMA5 CROSS AND LOCK BELOW 3348 WILL OPEN THE SWING RANGE
3330
3306
EMA5 CROSS AND LOCK BELOW 3306 WILL OPEN THE SECONDARY SWING RANGE
3288
3271
As always, we will keep you all updated with regular updates throughout the week and how we manage the active ideas and setups. Thank you all for your likes, comments and follows, we really appreciate it!
Mr Gold
GoldViewFX
6.27 Risk aversion dissipates and gold prices adjust! The range As the Middle East war came to an end, the risk aversion sentiment in the global financial market subsided, the risk aversion funds dissipated, and the three major bullish markets of gold, crude oil, and silver all fell downward; at the same time, the US dollar index broke a new low !
Fundamentals:
1: The Middle East war has been temporarily paused, and both sides have entered the adjustment phase; however, irreconcilable contradictions may become the starting point of the next war at any time; although it has ended for now, we must not slack off. Once the two sides are on the verge of a war again, risk aversion will sweep the world again; this is not impossible;
This Middle East war came suddenly and ended suddenly; it was like a child's play washing the global financial market; therefore, the possibility of a resumption of war cannot be ruled out in the future;
At present, in the overall market:
1: In the short cycle, the gold price fluctuates downward, so in the short term, the short-term decline is seen, and the fluctuation is downward;
2: In terms of trend, the range is temporarily contracted, the BOLL of the daily K is contracted, the speed slows down, and the overall range is back to the range of fluctuations; there is no obvious long and short trend, and it returns to the range of fluctuations;
Today's technical trend chart:
1: In 4 hours, the stochastic indicator crosses downward, which is a main empty signal; in terms of form, it is temporarily under pressure from the central axis track of the 4-hour BOLL, and the empty trend continues downward, and the form tends to continue to oscillate downward; therefore, it is recommended to choose the high-altitude approach for 4 hours;
2: In the daily K, the stochastic indicator continues to cross downward, which is a empty signal; in terms of form, it is temporarily a broken Yin and Yang pattern, with no obvious trend; BOLL forms a contraction, the range of 3417-3277, the range is mainly in an oscillating trend, and the strong and weak dividing point is near 3347;
Comprehensive: The daily K is mainly in an oscillating trend, so it is recommended to deal with it according to the oscillating trend, choose to buy low and sell high; the reference pressure position is near 3347, the support position is near 3295 and 3278; the second pressure position is 3390-3400 pressure position; continue to choose the oscillating approach, and play a oscillating treatment of buying low and selling high;

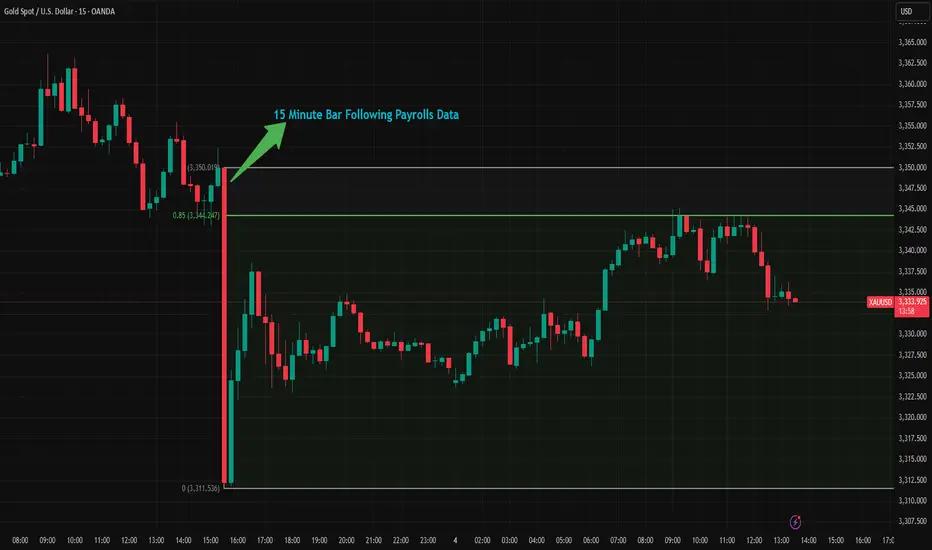
Why is the 147k Beat in Payrolls Data Not as Strong as it Seems?Yesterday’s U.S. nonfarm payrolls report came in above expectations, but a closer look at the details reveals a less encouraging picture. Despite the headline beat, market reactions quickly faded. For instance, gold initially dropped from 3350 to 3311 in the first 15 minutes after the release but has since recovered more than 75% of that decline. So why is the June jobs report not as strong as it first appeared?
According to the BLS report, nonfarm payrolls increased by 147k in June, surpassing the consensus estimate of 106k. However, when breaking down the numbers, private payrolls rose by just 74k, well below expectations. Most of the gains came from government and healthcare hiring. Government jobs accounted for 73k new positions, and 63k of those came from the education sector alone.
Some analysts suggest the high net hiring in education may be due more to a lack of firings, a consequence of a tight labor market in that sector. Meanwhile, the 59k increase in healthcare jobs is part of a long-term trend. Over the past two years, the U.S. has added an average of 70k healthcare jobs per month. This growth is largely driven by the needs of an aging population and reduced payrolls during and after the pandemic that have yet to fully recover.
If you exclude government and healthcare hiring, U.S. payrolls increased by just 15k in June.
The unemployment rate also came in better than expected, falling to 4.1% from 4.2%, while markets had anticipated a rise to 4.3%. However, this decline was driven by a drop in the labor force participation rate, which fell to 62.3% from 62.6% in just two months , a worrying sign that fewer people are actively participating in the labor market.
In the first 15 minutes after the data came, gold fell to 3311 from 3350. In the following 18 hours, gold recaptures 85% of the loss. Gold is still over the broken bearish trendline in 1-H timeframe. With tariff deadline in 9th July and incoming 10-12 tariff letters coming in from Trump in the next few days, gold could have potential to go upwards with market understands this jobs data is not strong as it seems.
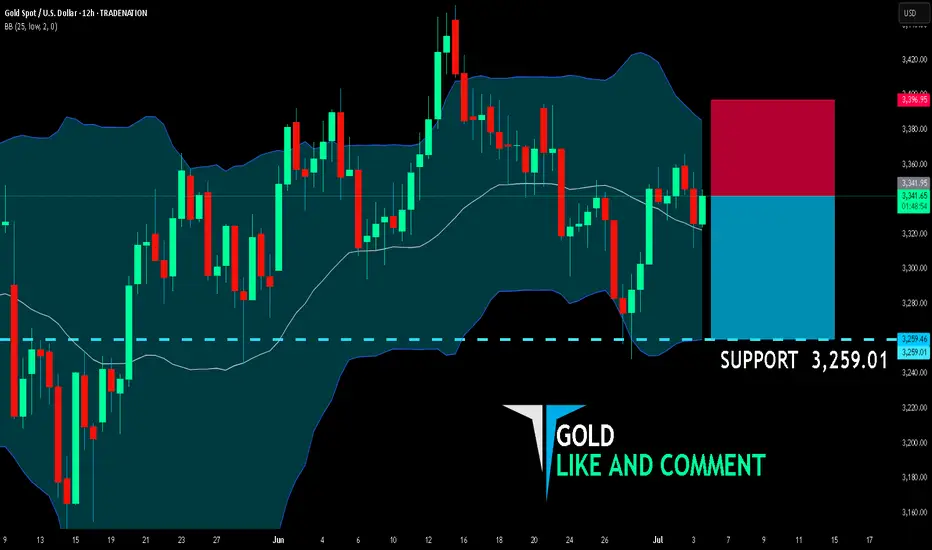
GOLD BEARS ARE STRONG HERE|SHORT
GOLD SIGNAL
Trade Direction: short
Entry Level: 3,341.95
Target Level: 3,259.01
Stop Loss: 3,396.95
RISK PROFILE
Risk level: medium
Suggested risk: 1%
Timeframe: 12h
Disclosure: I am part of Trade Nation's Influencer program and receive a monthly fee for using their TradingView charts in my analysis.
✅LIKE AND COMMENT MY IDEAS✅
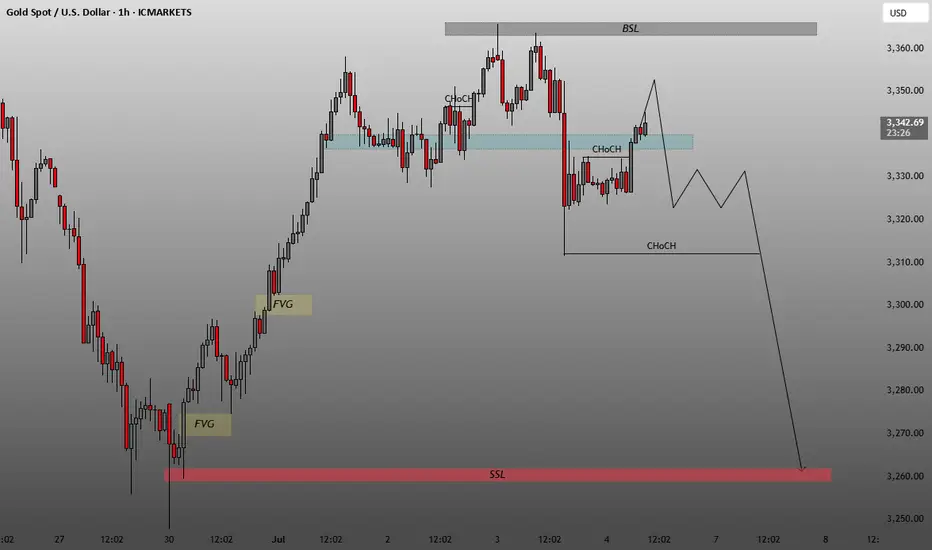
Indicates the target for potential bearish liquidity grab.BSL (Buy-Side Liquidity):
Marked near $3,360 at the top (gray zone).
Represents an area where buy stops may be resting above recent highs.
SSL (Sell-Side Liquidity):
Marked around $3,260 at the bottom (red zone).
Indicates the target for potential bearish liquidity grab.
FVG (Fair Value Gap):
Highlighted in yellow near $3,270–$3,280.
Unfilled imbalance that may attract price.
ChoCH (Change of Character):
Two ChoCH labels are marked:
One minor bullish ChoCH around the $3,328 area indicating a short-term shift in structure.
One bearish ChoCH below $3,310, suggesting a possible return to bearish bias if broken.
Blue Supply Zone:
An area of previous supply or resistance where price may reverse.
📉
Projected Price Path:
Initial move up into the blue supply zone, possibly to induce buyers or sweep short-term highs.
Followed by a strong bearish rejection, breaking below the lower ChoCH level (~$3,310).
A drop is anticipated all the way to the SSL zone (~$3,260), possibly filling the FVG on the way.
🧠 Summary:
This chart implies a smart money bearish setup:
Short-term liquidity sweep to the upside.
Break of structure (ChoCH) to confirm reversal.
Bearish continuation targeting:
Fair Value Gap (FVG) → ~$3,270s
Sell-Side Liquidity (SSL) → ~$3,260
XAUUSD – Bearish Month?🧭 Fundamental Bias: Bearish (-7/10)
– 🔥 NFP beat: 147K vs 110K → Fed cuts unlikely soon
– 💵 Dollar & Bond Yields UP
– 📈 Risk-on (Stocks ATH)
– 🛢️ Oil dropped = easing inflation
– 🏛️ No fresh Fed dovish hints
– 🕊️ Geopolitics stable for now (Iran/Trump)
📍 Technical View:
Price consolidating under supply zone (~3330).
Gold Latest Market Trend AnalysisThe data released by the U.S. Bureau of Labor Statistics showed that the U.S. seasonally adjusted non-farm payroll employment in June was 147,000, with the consensus forecast at 110,000. The previous value was revised up from 139,000 to 144,000. The annual rate of average hourly earnings in June stood at 3.7%, below the expected 3.90%, while the prior figure was revised down from 3.90% to 3.8%.
Following the release of the non-farm payroll report, interest rate futures traders abandoned their bets on a Federal Reserve rate cut in July. Currently, the market-implied probability of a Fed rate cut in September is approximately 80%, down from 98% prior to the report. On Thursday, gold exhibited a seesaw pattern, surging initially to hit resistance near $3,365 per ounce before retreating. During the U.S. session, it broke below support levels and further declined to hover around $3,311, where it staged a rebound. Gold remains in a high-range consolidation under selling pressure.
you are currently struggling with losses,or are unsure which of the numerous trading strategies to follow,You have the option to join our VIP program. I will assist you and provide you with accurate trading signals, enabling you to navigate the financial markets with greater confidence and potentially achieve optimal trading results.
Trading Strategy:
sell@3350-3355
TP:3320-3325
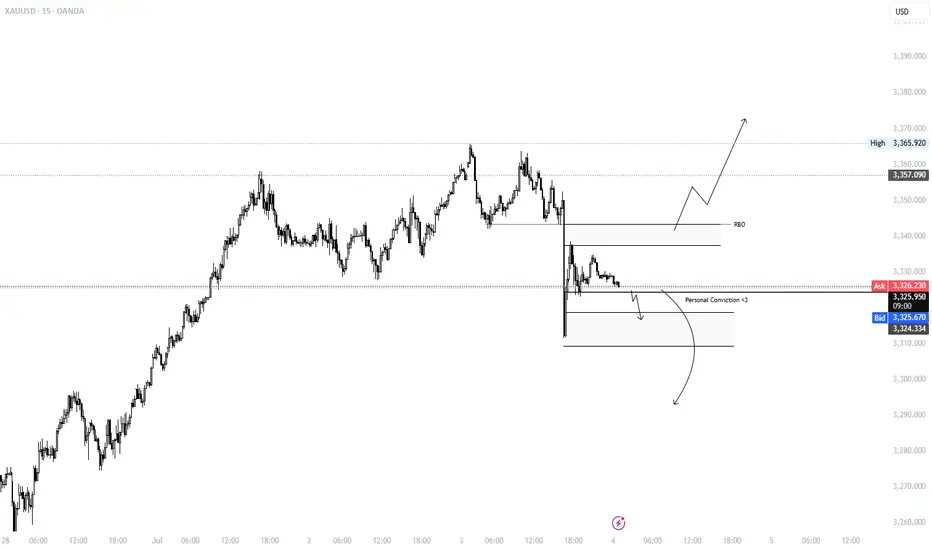
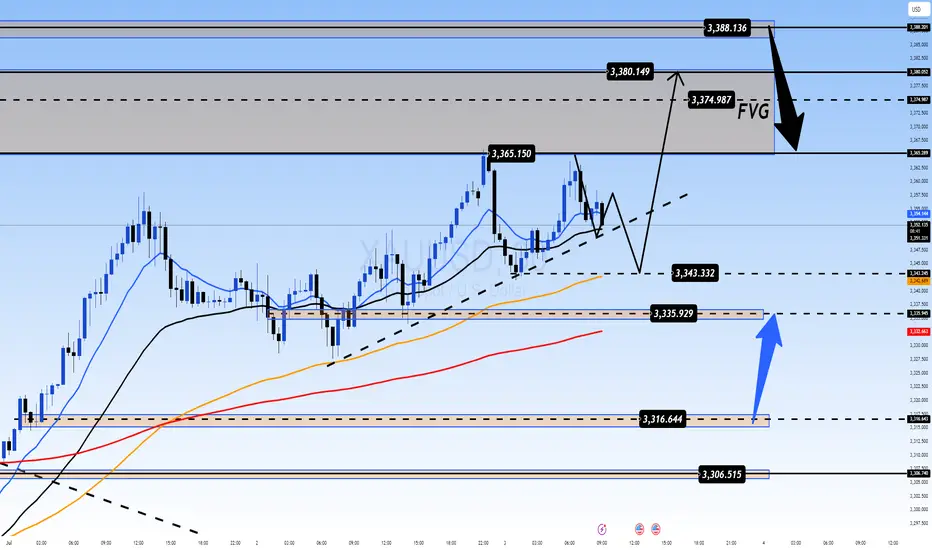
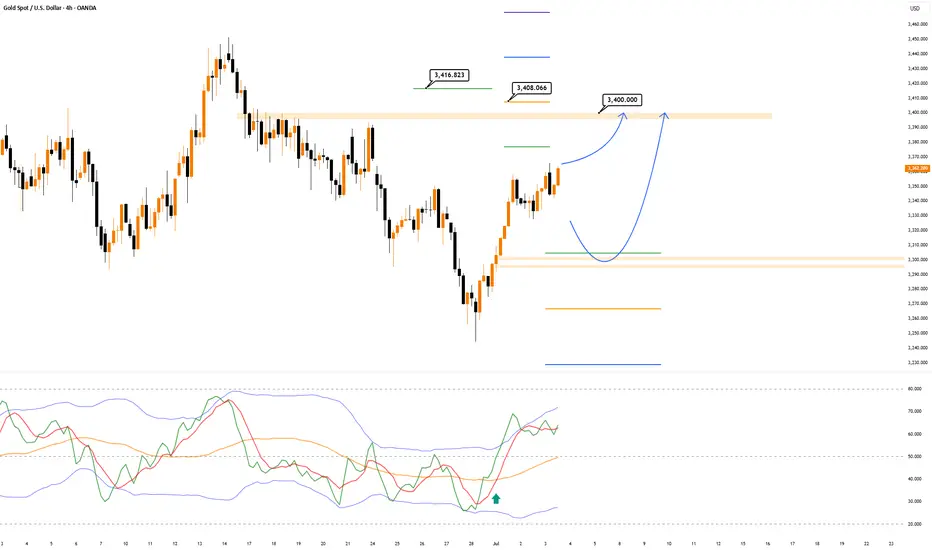
Gold Ready to Explode Ahead of NFP and Trump’s “Super Bill”?Gold Ready to Explode Ahead of NFP and Trump’s “Super Bill”? | Global Macro Focus
🌍 MACRO UPDATE – What the World is Watching:
Gold continues its bullish trajectory as the USD weakens sharply following last night’s disappointing ADP jobs report (-33K vs expected +99K). This soft labour data has fueled further speculation that the Fed could begin rate cuts as early as September, with a 90% probability now being priced in.
In the political arena, Donald Trump’s recent statement that House Republicans are aligned to push forward a so-called “Super Bill” has triggered fresh uncertainty around US fiscal policy. This could elevate safe-haven demand for gold, especially if it leads to increased tensions over debt ceilings or government spending.
With the US Non-Farm Payrolls (NFP) due later today and the UK and US markets heading into a long weekend, traders should brace for heightened volatility and liquidity gaps.
📈 TECHNICAL OUTLOOK – What the Charts Are Saying:
Overall Trend: Bullish structure remains intact as gold breaks and holds above 3365.
EMA Setup: Price trades above EMA 13/34/89/200 – signaling strong upside momentum.
Fair Value Gap (FVG): 3374 – 3388 area remains an unfilled FVG zone; possible magnet for short-term price action.
Key Resistance Levels: 3365, 3374, 3380, 3388, 3393
Key Support Levels: 3343, 3335, 3325, 3316, 3304
Trendline & Structure: The ascending trendline from 3316 remains unbroken, providing a potential bounce point if price corrects.
🎯 TRADE SETUPS – Strategic Zones to Watch:
🔵 Buy (Short-Term Scalp):
Entry: 3335 – 3333
SL: 3329
TP: 3340 → 3350 → 3360 → 3370
🟢 Buy Zone (Swing Perspective):
Entry: 3316 – 3314
SL: 3310
TP: 3320 → 3336 → 3350 → 3360
🔴 Sell Scalp (Reversal Zone)
Entry: 3374 – 3376
SL: 3380
TP: 3370 → 3360 → 3350
⚠️ Sell Zone (High-Risk Rejection):
Entry: 3388 – 3390
SL: 3394
TP: 3380 → 3370 → 3360
🔎 NOTE FOR GLOBAL TRADERS:
With UK markets partially closed and US session shortened ahead of the Independence Day holiday, liquidity may be thin and volatility could spike unexpectedly. Always place stop-loss and avoid emotional entries near key resistance.
💬 Do you believe gold can break and close above the FVG zone (3388) before the weekend volatility hits full throttle? Let’s discuss.
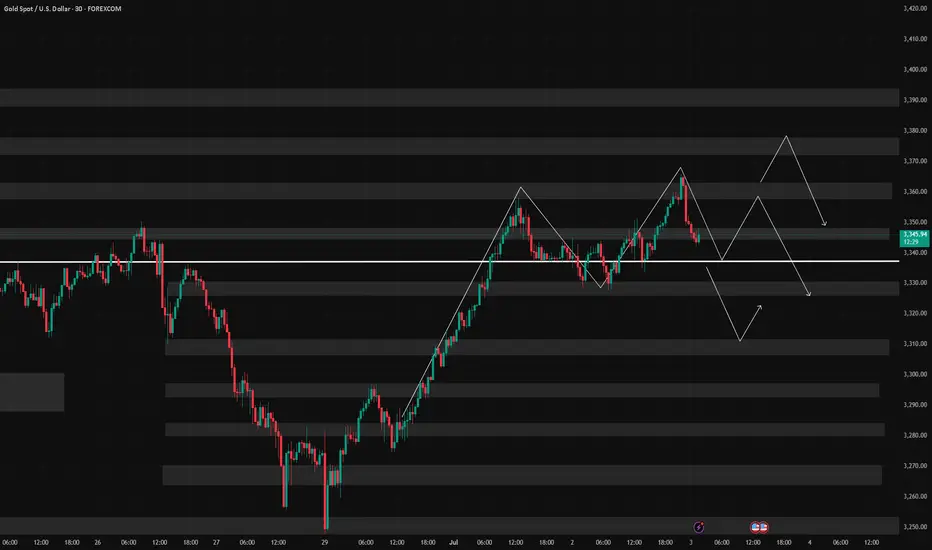
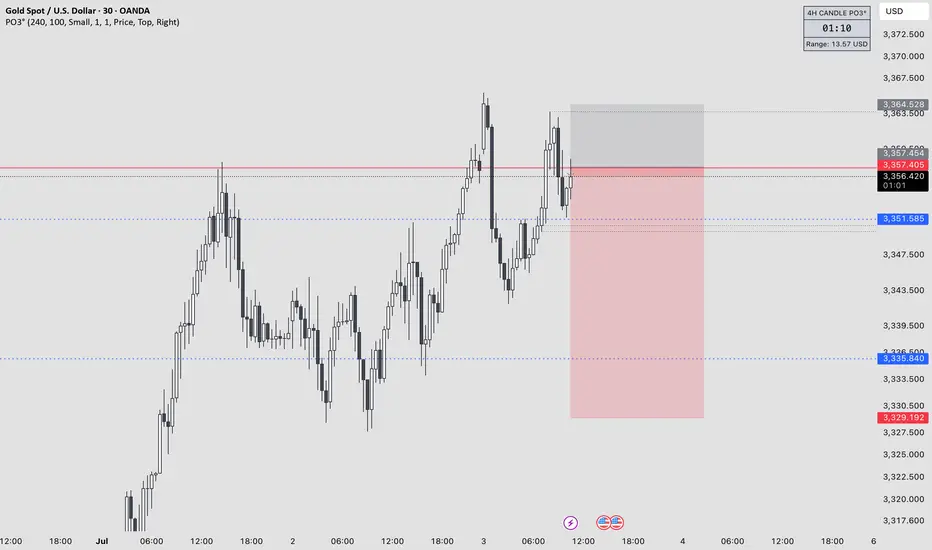
7/3: Focus on Short Positions, Watch Support Near 3320Good morning, everyone!
Yesterday, gold tested support near 3328 but failed to break below it effectively. The price then rebounded toward the 3350 level. At today’s open, gold briefly extended to around 3365 before pulling back.
Technically:
On the daily (1D) chart, the price remains capped by the MA20, with no confirmed breakout yet.
Support levels below are relatively dense, and moving averages are increasingly converging, suggesting a breakout in either direction is approaching.
Key intraday support lies in the 3321–3316 zone.
On the 2-hour chart, we are seeing the first signs of a bearish divergence, indicating a need for technical correction. Much like Tuesday’s setup, there are two possible scenarios:
If 3342–3334 holds, the price may extend slightly higher, intensifying divergence before pulling back;
If 3337 breaks, we could see a drop toward 3320, where correction would occur through a direct decline.
From a fundamental perspective, several high-impact U.S. data releases are scheduled for the New York session, which may increase volatility and make trading more challenging.
Trading suggestion:
For most traders, the safest approach is to wait for data to be released, then look for oversold rebounds or overbought corrections following sharp market reactions.
This style requires patience and strong risk control—avoid being overly aggressive or greedy, as such behavior can easily lead to trapped positions or even liquidation.
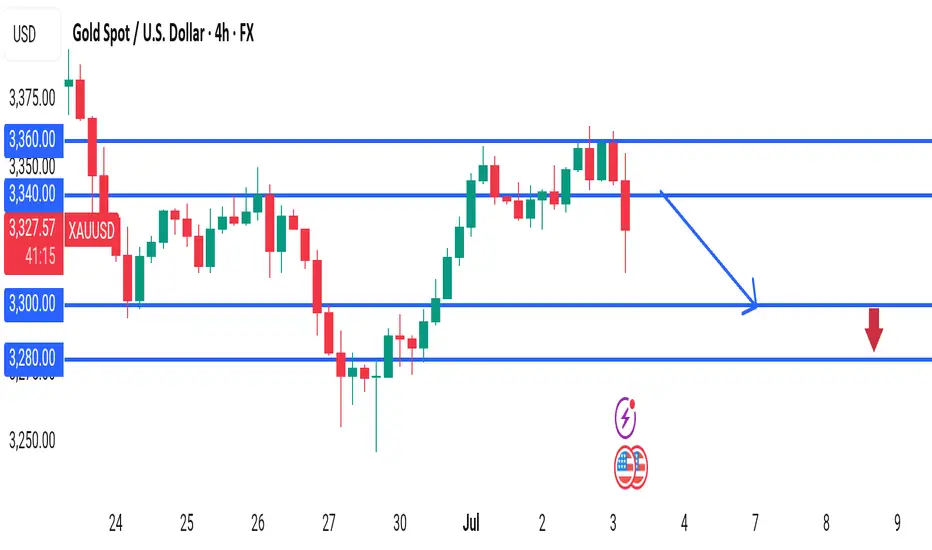
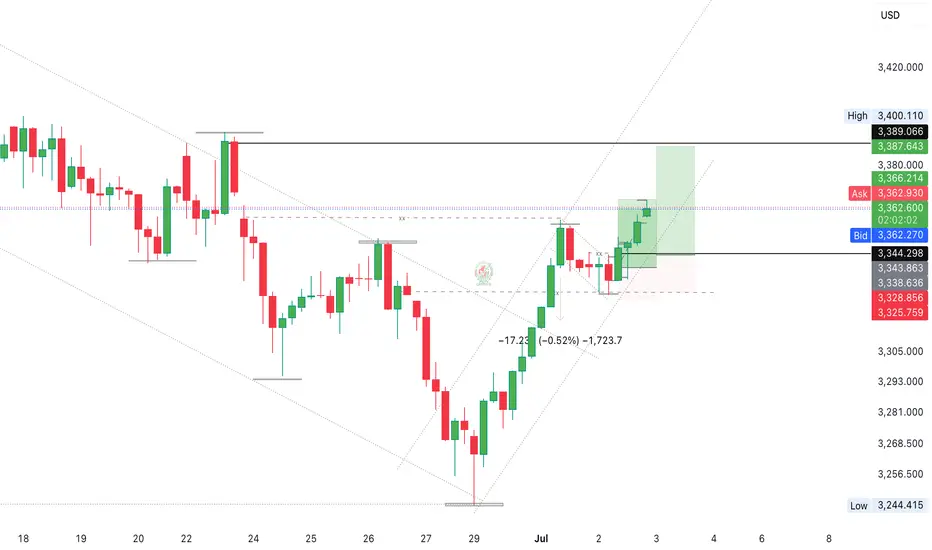
GOLD XAUUSD 4H – Smart Money SELL Opportunity
Gold (XAUUSD) is currently trading around 3,328.96, showing signs of exhaustion near previous highs. Price failed to break above 3,355 zone, indicating liquidity build-up and potential for Smart Money manipulation.
This is a SELL-ONLY setup — waiting for price to react from premium levels to short the market.
---
SELL Trade Plan:
🔻 Sell Limit: 3,340.00 - 3,355.00
🛑 Stop Loss: 3,360.00 (Above liquidity grab zone)
🎯 Take Profit 1: 3,300.00
🎯 Take Profit 2: 3,280.00
---
Why Sell?
✅ Price is approaching major distribution zone.
✅ Liquidity resting above 3,340 - 3,355 likely to attract manipulation wicks.
✅ After manipulation, Smart Money expected to drive price lower.
No buy confirmation. Structure favors sellers — trade what you see, not what you feel.
---
Summary:
Bias: SELL ONLY 🔥
Setup: Wait for price to tap 3,340 - 3,355, rejection confirms entry.
Risk Management: Mandatory — Protect your capital.
---
💬 Drop your thoughts below — are you catching this sell move?
#Gold #XAUUSD #Forex #SmartMoney #TradingView #LiquidityHunt #SellSetup #FrankFx14
GOLD BULLS We saw gold impose a strong bullish strength since the open of this new week, and even at the beginning of the new month (JULY).
Based on this analysis, this bullish momentum has structured in a bullish trend channel which has been shown, we still have more top liquidity to mitigate as we have made a bearish retracement for a continued bullish rally to 3360's, 3380's and 3400's.
Further updates would be given as the market gains momentum
Gold Market Eyes 3380s After 3350s mitigated Gold market currently priced in the 3350s, with the daily candle formation suggesting an intent to mitigate the previous day's open. This setup may trigger a full bullish sentiment, potentially driving price action toward the 3380s. follow for more Insights , comment and boost idea
XAU/USD GOLD Short 4:1XAU/USD GOLD Short 4:1, last idea was correct closed in profits, I will take two positions here.
1. 1:1 TP
2. 4:1 TP
Enjoy!
Gold's price is expected to go up✅ Gold's price is expected to go up, possibly reaching $3400 or more. This could happen after a small pause or a direct climb. A technical signal also supports this upward trend.
❌ However, be careful! The upcoming U.S. jobs report (NFP) can drastically change gold's direction. It's best to wait until the market reacts to that news before making new predictions.
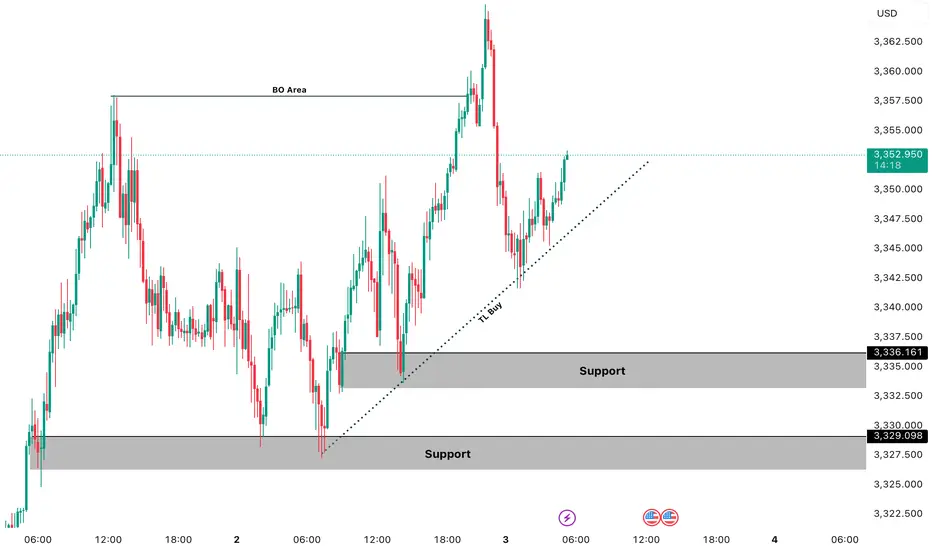
GOLD LOND TRADE IDEA We Are Looking Gold Bullish Today ,
TL BUY AREA : 3347 💡
1ST SUPPORT BUY : 3336, 3333 💡
2ND SUPPORT BUY: 3329, 3325 💡
If Gold Break The Trendline Then We See Gold Bearish Price Then We Buy At Support The Target Will Be ATH Liquidity 3390
If Gold Breaks Also 2nd Support Then Continue Bearish Trend Then We Trade Sell On a2nd Support Break
Manage Trades Properly Dont Forget To Follow Us For More Free Trades
XAUUSD No chasing long or early manual entriesBUY LIMIT - XAUUSD @ 3328.00
TP: 3348.00
SL: 3320.00
Do not increase positions, do not carry orders, not backhanded