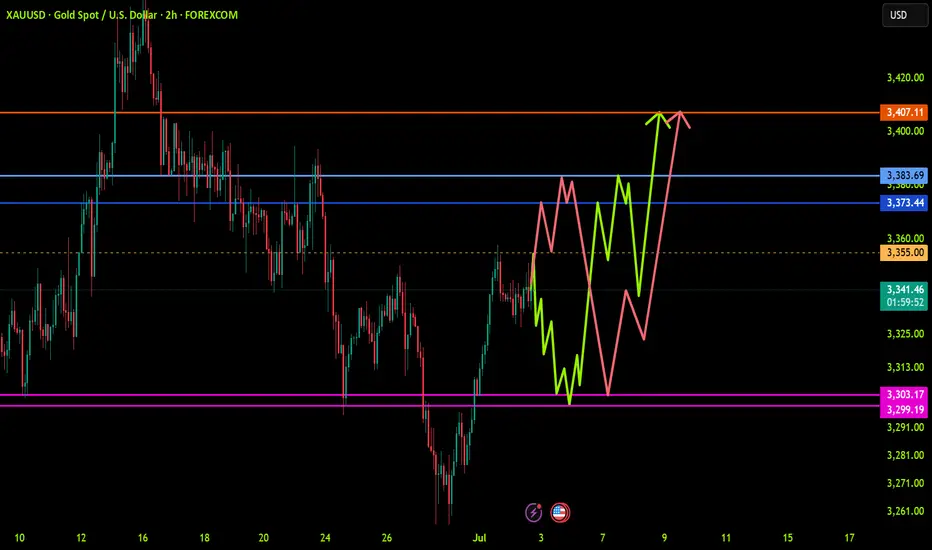
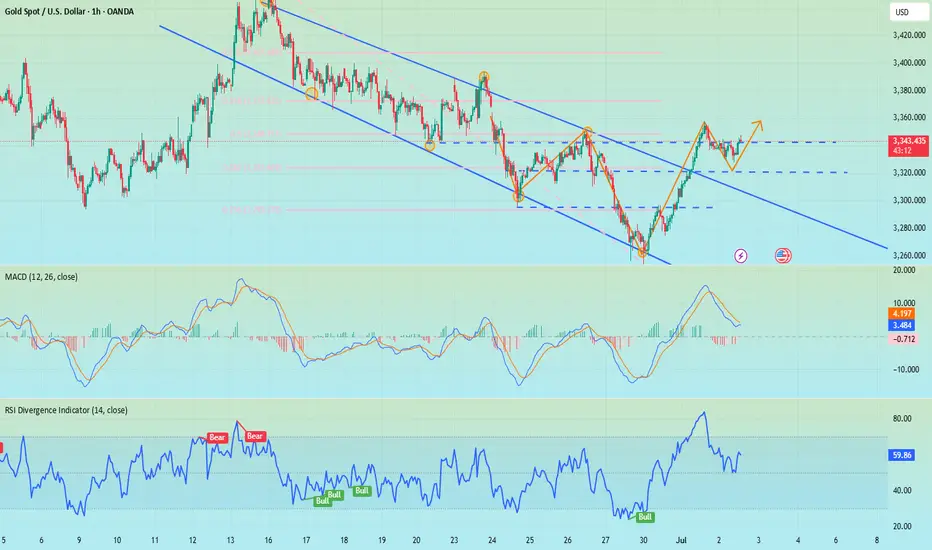
XAUUSD: Trend in 2H timeframevery important levels for GOLD, we have two trends,
Please pay special attention to the colored levels.
Trends are very accurate,
>>>>>>>>>>>>>>>>>>> The setup is very sensitive <<<<<<<<<<<<<<<<<<<<<<<<
Be careful
BEST
MT
XAUUSD.F trade ideas
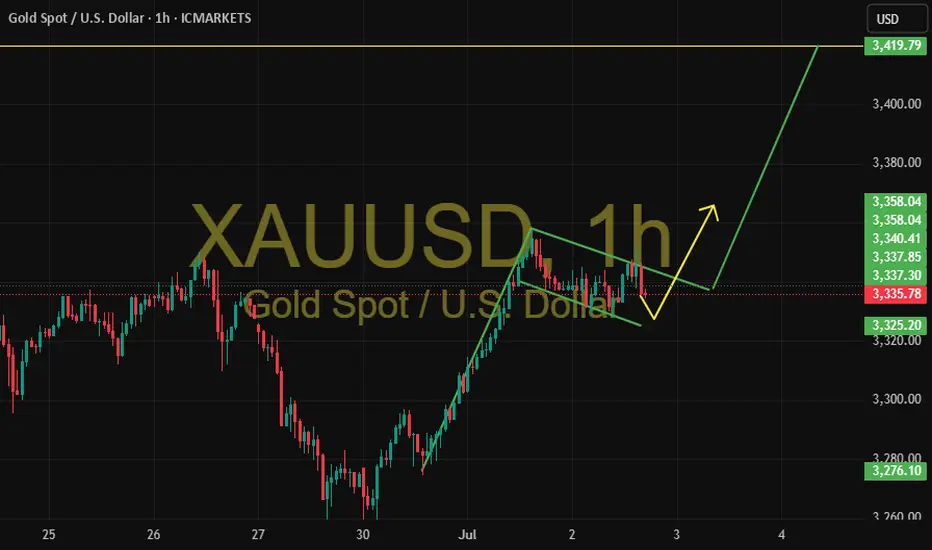
XAUUSD – Bullish Flag Pattern on the Hourly Chart📌 XAUUSD – Bullish Flag Pattern on the Hourly Chart
Gold completed a strong upward move last week and then entered a corrective phase forming a classic bullish flag pattern with a descending channel.
🟡 Currently, price is consolidating within the pattern boundaries. As long as it holds the support area around 3,325, the favored scenario is a continuation of the bullish trend upon an upward breakout.
🎯 Technical target after breakout: 3,419, based on the flagpole height.
📉 In case of a downside break, the scenario will be reassessed.
🔍 This analysis is for educational purposes only and not a trading recommendation.
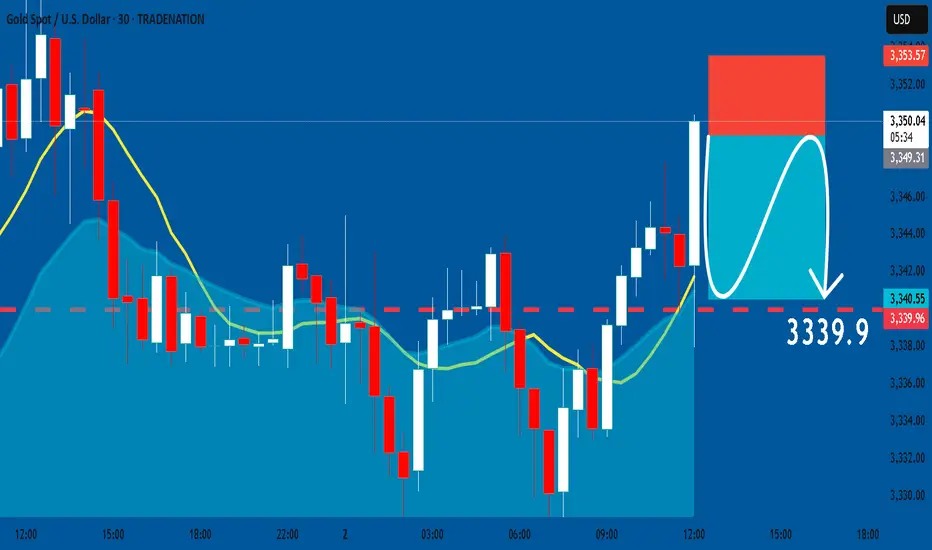
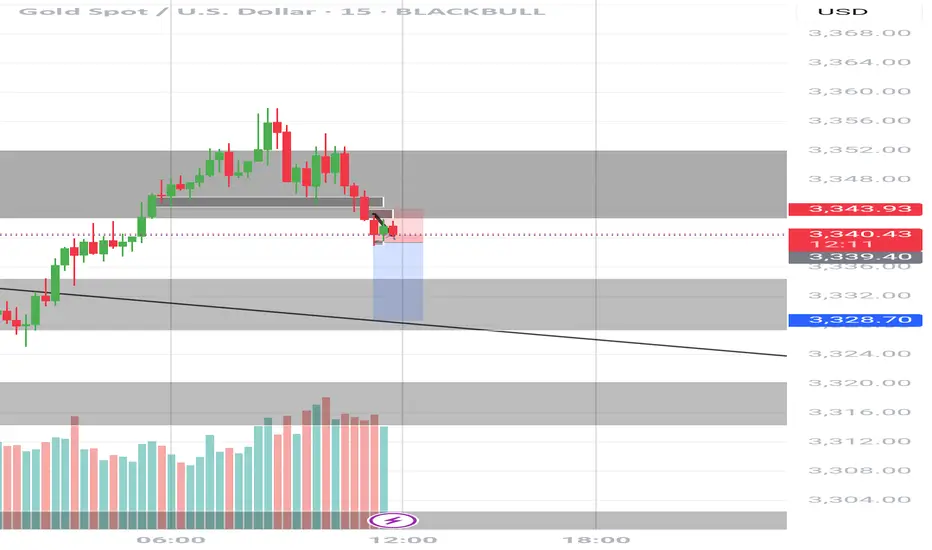
GOLD: Short Signal with Entry/SL/TP
GOLD
- Classic bearish pattern
- Our team expects retracement
SUGGESTED TRADE:
Swing Trade
Sell GOLD
Entry - 3349.3
Stop - 3353.5
Take - 3339.9
Our Risk - 1%
Start protection of your profits from lower levels
Disclosure: I am part of Trade Nation's Influencer program and receive a monthly fee for using their TradingView charts in my analysis.
❤️ Please, support our work with like & comment! ❤️
How do we plan before ADP and NFP?📰 News information:
1. ADP data, for reference of tomorrow's NFP data
2. Interest rate cuts and Powell's dovish comments
3. Geopolitical impact on the gold market
📈 Technical Analysis:
The market will continue to fluctuate before the ADP data, and the market will continue to rise after the adjustment. In the 4H cycle, the upper rail of the pressure is temporarily suspended, and the Bollinger Bands also close. This is why I emphasize the need to pay attention to the 3323 support line below. At present, gold rebounded, I think it will touch 3348 at most, that is, it rebounded to 50%. Therefore, before the ADP data, I still hold the position of 3340-3350 for shorting, and find support for long at 3325-3315 below. I have marked the pattern of head and shoulders bottom in the figure. I have been engaged in spot, futures, foreign exchange and other transactions for many years. My analysis ideas can be referred to by brothers
🎯 Trading Points:
SELL 3340-3350
TP 3330-3325-3315-3295
BUY 3323-3315-3305
TP 3340-3350-3360-3375
In addition to investment, life also includes poetry, distant places, and Allen. Facing the market is actually facing yourself, correcting your shortcomings, confronting your mistakes, and strictly disciplining yourself. I hope my analysis can help you🌐.
TVC:GOLD OANDA:XAUUSD FX:XAUUSD FOREXCOM:XAUUSD PEPPERSTONE:XAUUSD FXOPEN:XAUUSD
Gold Under Pressure As Dollar StrengthenGold remains under pressure after a false breakout at $3,350, as the dollar's sudden strength dominates the market. Despite Powell's slightly dovish tone, Tuesday's PMI and JOLTs job data favored the dollar, keeping the market in limbo. Technically, gold has established a new range between $3,350 and $3,300. A drop to the lower end of this range could spark short-term buying opportunities. With the ADP numbers on the horizon, the market awaits further cues.
GOLD SHORT TRADE SIGNALGold Sell Now 3338 / 3343
Stoploss : 3347
Target : 3324
Reason Main Resistance Rejection
Bearish Engulfing Conformation To Sell

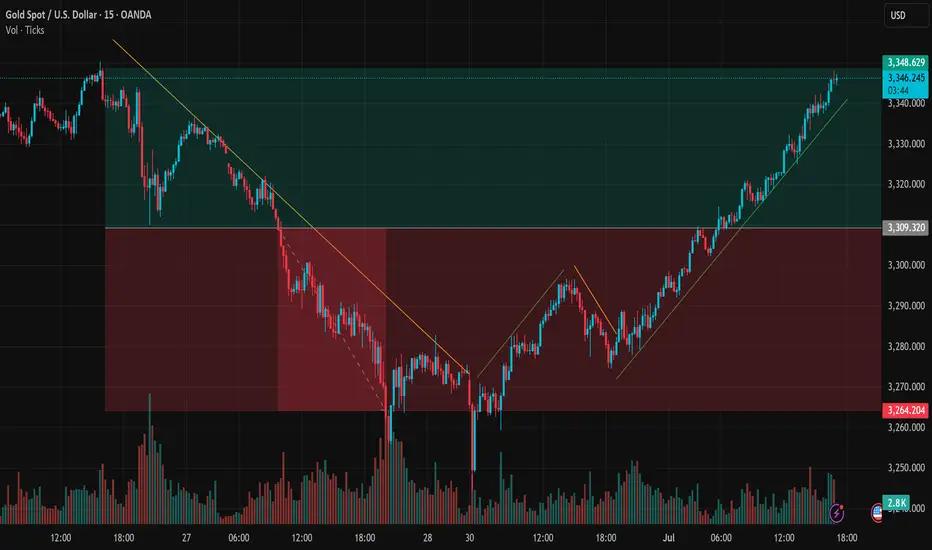
Gold breaks trend – bullish wave returnsIn the most recent trading session, gold (XAUUSD) has made a strong rebound from the key support zone around $3,263 and is now approaching a short-term resistance near $3,347 – signaling a potential continuation of the bullish momentum in the short term.
1. Price Structure & Market Behavior After reaching a local top around $3,347–$3,350, gold entered a clear downtrend.
However, the breakout of the descending trendline (yellow line) with solid bullish candles is a strong reversal signal.
The market has formed higher highs and higher lows with strong bullish candles, confirming a V-shape reversal pattern from the bottom zone.
2. Key Support & Resistance Levels Immediate resistance: $3,347–$3,350 – previous rejection zone.
Short-term support: $3,308 – newly broken resistance now acting as support.
Major support: $3,263 – previous low with strong bullish bounce, highlighting significant buyer interest.
3. Suggested Trading Strategy Given the strong breakout and bullish trend structure, traders may consider a buy-the-dip strategy around $3,308–$3,315 on potential pullbacks.
Stop-loss should be placed below $3,263 to protect against false breakouts.
Short-term take-profit targets can be set at $3,350–$3,360. If this level breaks, extended targets could reach $3,375.
Volume & Momentum Volume is increasing along with price, confirming strong buyer participation.
Bullish candles are closing near highs, showing weak selling pressure and suggesting the uptrend may continue.
Conclusion: Gold has resumed a short-term uptrend after breaking its previous downtrend. Traders should favor bullish setups and look for pullbacks to enter at better prices. Watch the $3,347 zone closely – if gold breaks and holds above it, further upside is likely.
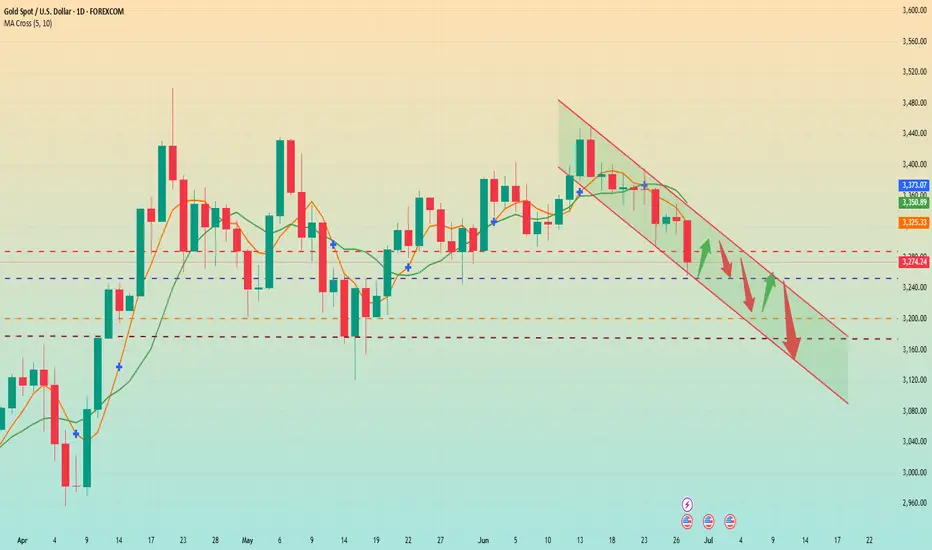
XAUUSD-Major Reversal Ahead?14-Years Cycle complete in April2025 Description:
Gold (XAUUSD) has completed a significant 14-year cycle with the recent peak near $3,485 in April 2025, following a similar 12-year rally pattern that previously ended in August 2011.
The price is now showing signs of exhaustion:
RSI on the monthly chart is extremely overbought (85.91), matching historical reversal levels.
Strong Fibonacci confluence at 1.0 extension ($3,485) suggests a possible cycle top.
Historical symmetry: Prior major top in 2011 came 12 years after the breakout in 1999 — this move mirrors that with a 14-year cycle.

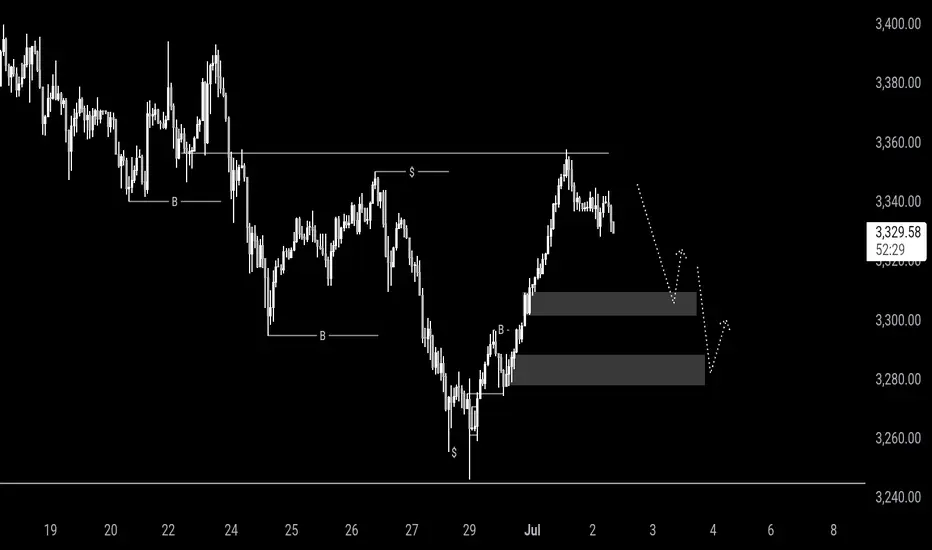
Trading Game of the Day 1-JULY-2025Trading Plan :-
1-PDA:-swing point high
2-FVG:- 15 minutes TF
3-CISD :-15 minutes TF
4-The price returned to the FVG and order block above then make rejection block on 3 mins
with CISD ON 3 mins
5- then entry short bearish with the first target (double buttom)
THANK YOU

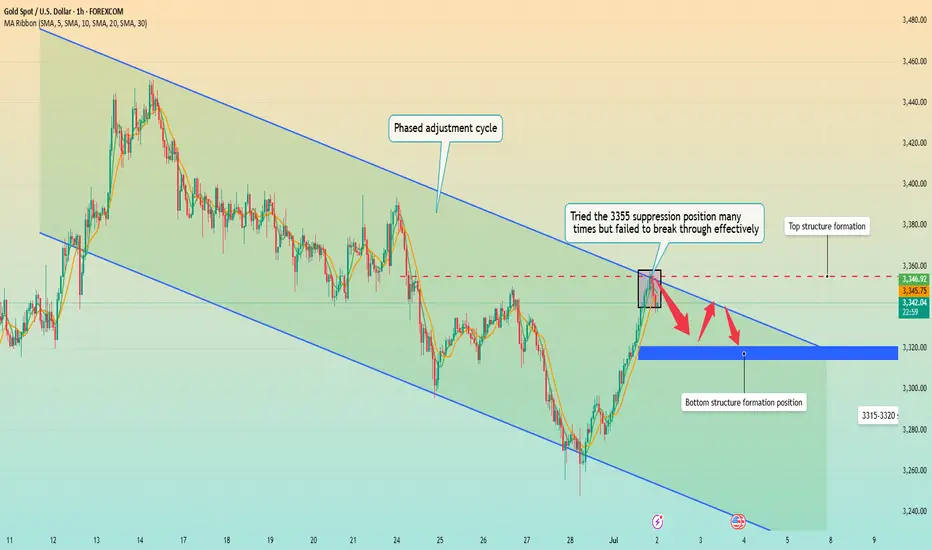
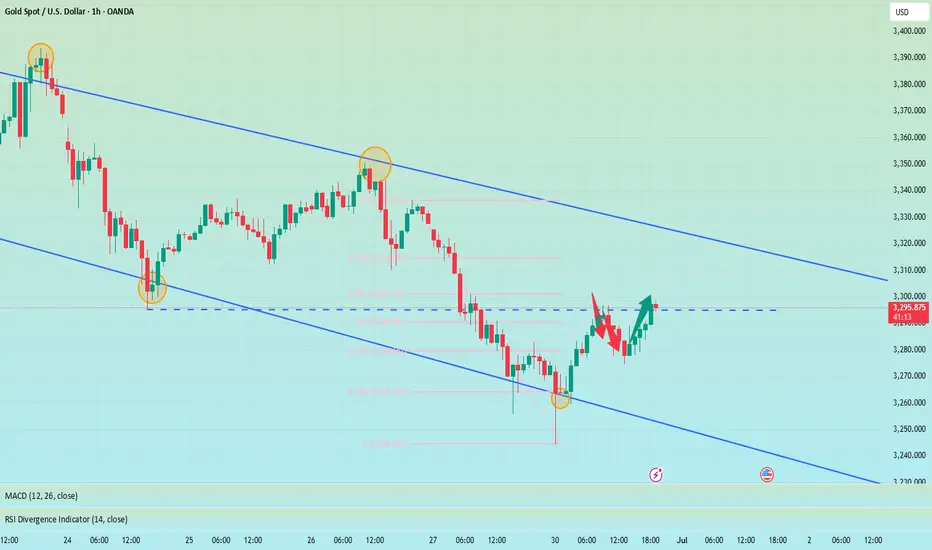
Gold falls back, is a bottom structure emerging?In terms of one-hour structure, this round of phased adjustment started from 3450 has not ended yet, but it will soon, especially the rapid rebound after the bottom of 3260 on Monday. This rebound has strong momentum. After bottoming out and rebounding, it is currently fluctuating around 3340, with a large overall span. This also shows that after the price has risen, the amplitude of the correction has increased, which means that the upward space is limited. This adjustment is likely to be over soon, but there is no definite bottom structure yet, so we need to wait for some time.
Before going out of the definite bottom structure, based on the principle of following the trend, you can try to short with a light position. At present, in terms of the one-hour pattern, the key point is here at 3355, and it is currently falling back from this position to 3340. If it falls back to the 3320 area today and stabilizes above it, you can operate a long strategy. On the whole, Quaid suggests that the short-term operation strategy for gold today should be mainly long on pullbacks, supplemented by shorting on rebounds.
Operation strategy:
Short at 3345, stop loss at 3355, profit range 3330-3325.
Long at 3320, stop loss at 3310, profit range 3340-3345.
Guys we selling hold right?Price has extended so much without any major retracement, we have hit a higher timeframe sup/res line and head and shoulders have formed. entered on bear engulfing breaking neckline of a head and shoulders formation. but now price is retracing back? surely just a retest of the neckline before continuing down? Sorry if this is poor analysis im new to trading. have I missed anything vital that I should have taken into account before I placed this trade?
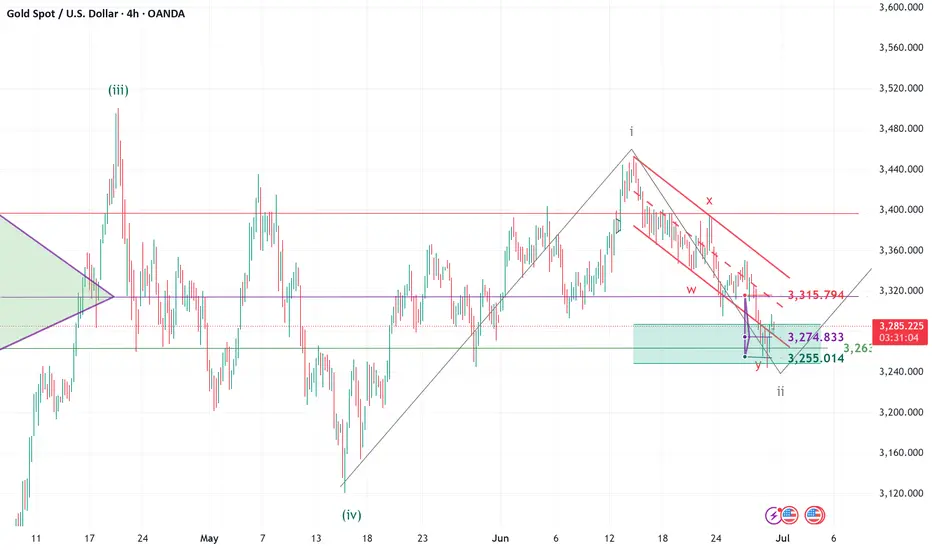
ELLIOTT WAVE XAUUSD H4 update
EW Trade Set Up H4
monitoring the end of subminuette wave ii
subminuette wave ii is going to end in a double zigzag.
Waiting for an accumulation in the price range 3250/3315 before subminuette iii starts.
daily key levels (area)
3315
3275 POC
3250
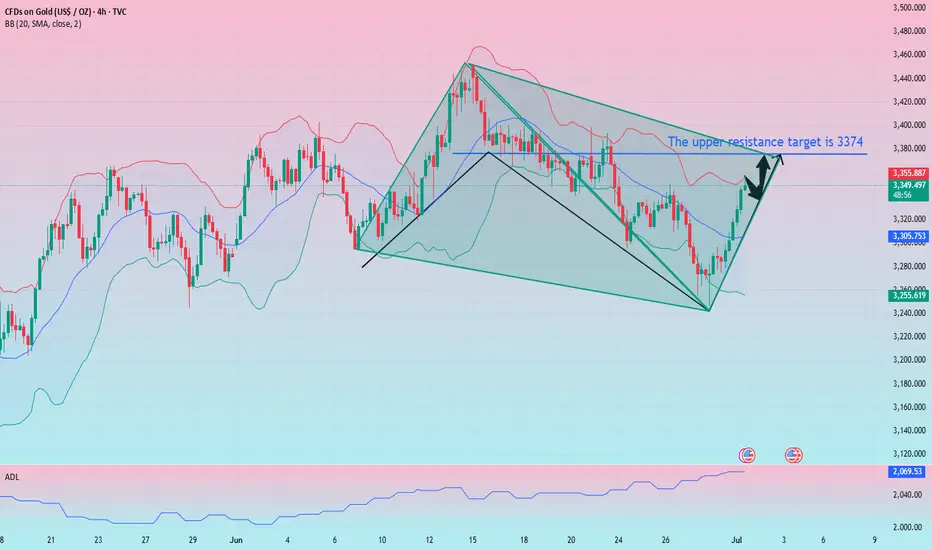
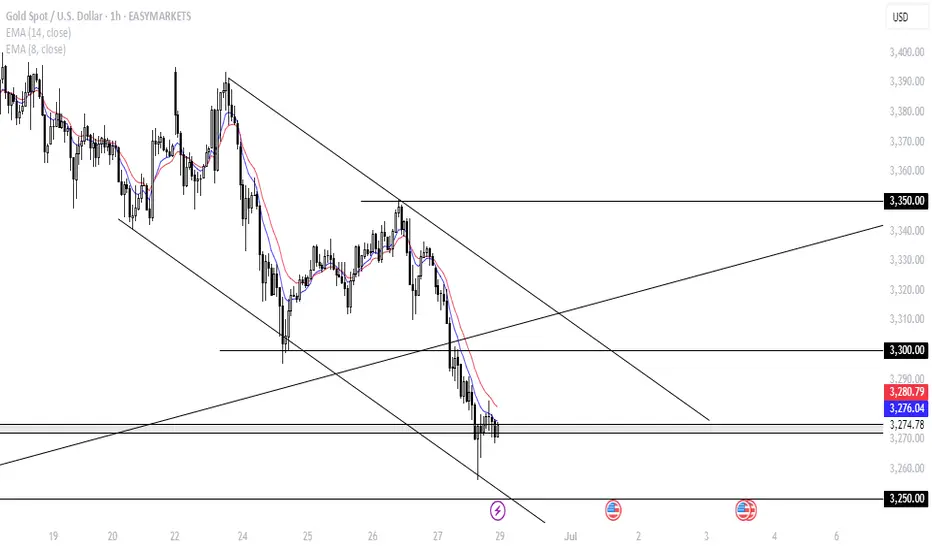
Gold continues to rise slowly
Gold weekly and monthly level: For the monthly level, many people think that the bull market is over when they see the continuous long upper shadow cross K, and they don’t think that it can’t even effectively lose the 5-day moving average, and it is still in a strong stage in the strong stage, and it is also running on the upper track of the upward channel, indicating that the bull market has yet to continue. If it directly pulls up and engulfs the high point of last month this month, a group of bearish people will be wiped out. It has always been emphasized that you should not underestimate the trend of the past two years, and don’t guess the top. This top will reach a height that everyone can’t imagine. Following the bull trend is the right choice. Holding on to the low-level bullish band bottom position in your hand is the happiest moment in the past two years and the most witnessing moment of strength; and the weekly level, as mentioned at the weekend, don’t look at the big negative last week and lose the lower track of the channel. It is also completely possible to directly come back with a big positive this week.
Gold daily level, there has been a continuous positive breakthrough during the day. Once the closing confirms that the breakthrough is effective, it will continue to rise tomorrow and directly approach the lower track of the previous yellow channel. 340 0 line; then going forward, we have to fight for the last key pressure point, the 3500-3452 previous high trend connection line, which roughly corresponds to 3440. Once it breaks through here directly, 3500 will inevitably be unstoppable and move towards 3700; however, there is no need to be too anxious at the moment, be down-to-earth, and overcome the resistance level step by step, but you must try to look far ahead to see more clearly
Gold hourly line level: From the opening to now, it has been rising slowly all the way, with a small negative in the middle, all positive, this kind of pull-up pattern must not be tested for shorts, and during the European session, it also broke through the upper rail resistance level of the 3335 downward channel, and there was a second pull-up in the US session; it just couldn't step back, and even the 10-day moving average didn't give a chance. If you want to step back and follow the long position, there is no chance for the time being, and going long directly seems more radical; you can wait patiently, be bullish, and don't go short; if you can confirm that it is above 3335 today, you can try to follow the bullish trend, and the upper resistance target is 3374
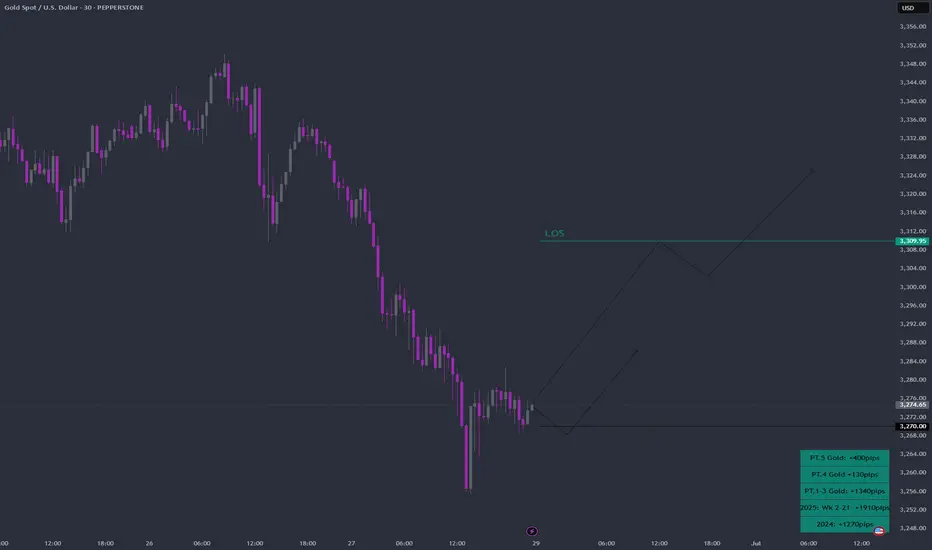
Everybody loves Gold Part 6Great week in Part 5.
Starting this week with a strong bias towards the upside.
Here's a breakdown of trading dynamics:
1. Expecting price to break past green line, level of significance (LOS) for continuation up
2. Price might bounce back for which; will be looking for a continuation from -50/-100 or -150pips to the upside
3. Will be looking for double tops/bottom along the way
As always price action determines trades
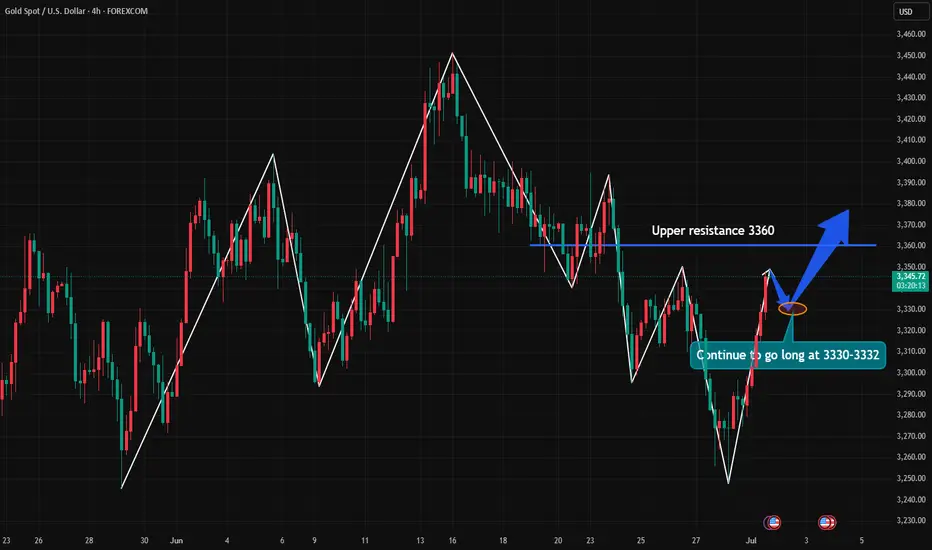
Gold prices are gathering momentumThe key position of the four-hour gold chart dominates the short-term rhythm. At present, the 3300 resistance has completed the transformation to support, and the price remains stable above this position to maintain a short-term bullish pattern. The hourly chart shows that after a strong overnight close, the previous high has been broken in the morning session today. The gold price is expected to continue the offensive and test the core resistance area of 3360 at the daily level. The operation strategy is mainly to do more on the callback, focusing on the pressure performance after the price is above 3360. If a reversal K-line pattern appears, a short position can be arranged. Losing the 3300 support indicates the risk of a trend reversal. Focus on the two-way breakthrough signal of the 3300 support band and the 3360 resistance range during the day
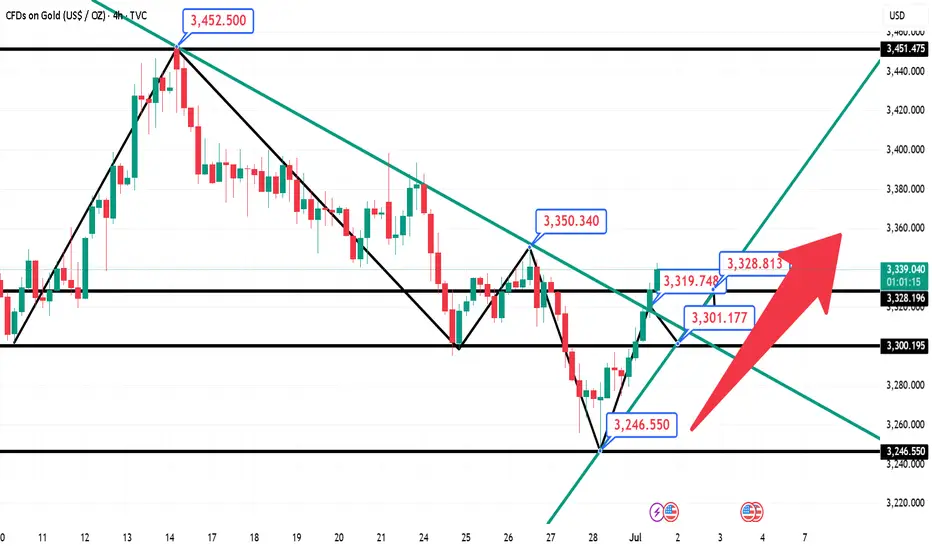
7.2 Gold bulls continue to rise, bears come to an end temporarilFrom the 4-hour analysis, the upper focus is on the 3345 line of suppression, the lower short-term support focuses on the 3314-3316 line, and the key support of 3295-3301 line is focused on. The overall support is based on this range to maintain the main tone of low-multiple participation. In the middle position, watch more and do less, be cautious in chasing orders, and wait patiently for key points to enter the market.
Gold operation strategy:
1. Gold 3316-24 line long, retrace to 3295-3303 line to add more positions, stop loss 3293, target 3340-45 line, continue to hold if broken;
Byt setup tiqgpt MARKET NARRATIVE: Analyzing the provided charts for Gold Spot / U.S. Dollar (XAUUSD) across multiple timeframes, we observe a consistent uptrend from the 1D to the 1m timeframe. The 1D chart shows a recent bullish candle following a series of indecisive movements, indicating potential accumulation by institutions. The 4H and 1H charts display a clear impulsive move upwards, suggesting strong buying pressure. The 15m, 5m, and 1m charts further confirm this momentum with successive bullish candles and minimal retracement, indicating ongoing demand and limited supply.
INSTITUTIONAL THESIS: Institutions appear to be in an accumulation phase, driving the price upwards through consistent buying. The lack of significant pullbacks across lower timeframes suggests a strong institutional commitment to higher prices, likely targeting liquidity above recent highs.
LEARNING POINT: The consistent bullish momentum across all timeframes without significant retracement indicates a strong institutional presence and a potential continuation of the uptrend.
SIGNAL: WAIT SYMBOL: XAUUSD ENTRY PRICE: $3,330.50 STOP LOSS: $3,325.00 (just below the recent minor pullback on the 1m chart, which can act as a short-term liquidity area) TARGET PRICE: $3,340.00 (just below the next psychological round number, providing a reasonable target for institutional profit-taking) CONDITION: Buy on a slight retracement to $3,330.50, confirming continued demand. RATIONALE: Calculated risk/reward ratio of 1:1.7 (Risk=$5.50, Reward=$9.50) does not meet minimum 2:1 requirement. Waiting for better institutional setup with improved risk parameters. STRATEGIES USED: Multi-timeframe momentum trading, targeting minor pullbacks for entry. URGENCY: MEDIUM TIMEFRAME: Short-term CONFIDENCE SCORE: 85% (based on the alignment of bullish signals across multiple timeframes) RISK/REWARD RATIO: Risk=$5.50, Reward=$9.50, Ratio=1:1.7 (Below 2:1 minimum)
Risk = Entry Price - Stop Loss = $3,330.50 - $3,325.00 = $5.50
Reward = Target Price - Entry Price = $3,340.00 - $3,330.50 = $9.50
Ratio = Reward ÷ Risk = $9.50 ÷ $5.50 ≈ 1.73
Given that the risk/reward ratio is less than 2:1, the recommendation is to WAIT for a better entry point or adjust the target/stop to improve the ratio.
The limit is 3320. Rebound and still short📰 News information:
1. Gold market liquidity at the end of the month
2. Impact of geopolitical situation
📈 Technical Analysis:
Currently, gold has rebounded to around 3295, reaching our ideal trading area. I have given the short-selling trading idea in the previous post. At present, in the short term, we still maintain the short-selling trading idea before effectively breaking through the upper resistance. Focus on the 3325 line of resistance
🎯 Trading Points:
SELL 3295-3310-3320
TP 3285-3270
In addition to investment, life also includes poetry, distant places, and Allen. Facing the market is actually facing yourself, correcting your shortcomings, confronting your mistakes, and strictly disciplining yourself. I hope my analysis can help you🌐.
OANDA:XAUUSD FOREXCOM:XAUUSD FX:XAUUSD PEPPERSTONE:XAUUSD FXOPEN:XAUUSD TVC:GOLD
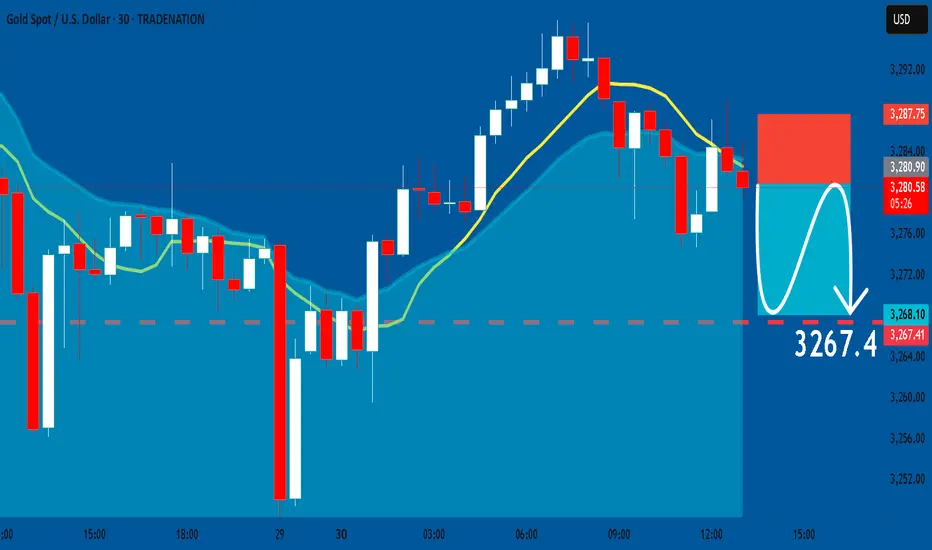
GOLD: Bearish Continuation & Short Signal
GOLD
- Classic bearish formation
- Our team expects pullback
SUGGESTED TRADE:
Swing Trade
Short GOLD
Entry - 3280.9
Sl - 3287.7
Tp - 3267.4
Our Risk - 1%
Start protection of your profits from lower levels
Disclosure: I am part of Trade Nation's Influencer program and receive a monthly fee for using their TradingView charts in my analysis.
❤️ Please, support our work with like & comment! ❤️
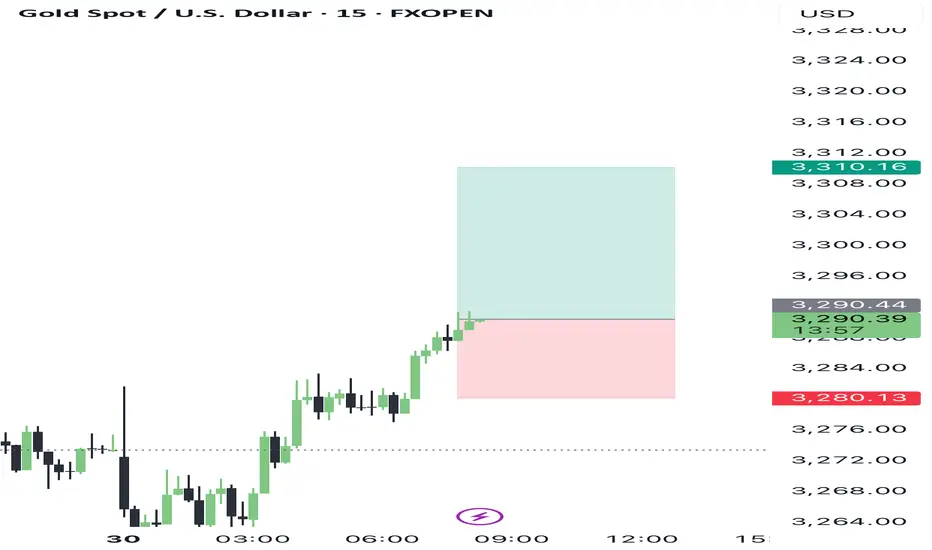
Bullish TiqGPT setup todayMARKET NARRATIVE: Analyzing the Gold Spot (XAUUSD) across multiple timeframes, we observe a consistent pattern of recovery from a recent downtrend. The 1D chart shows a series of declining peaks, but recent candles indicate a potential reversal or pullback. The 4H and 1H charts confirm this with a clear recovery from the lows, suggesting a shift in market sentiment. The 15m, 5m, and 1m charts show a more granular view of this recovery, with price action forming higher lows and higher highs, indicative of a short-term bullish momentum.
INSTITUTIONAL THESIS: Institutions appear to be in a phase of accumulation after a significant sell-off, targeting liquidity above previous highs to trap late bearish entries. The recent bullish candles across lower timeframes suggest an engineered push to create a bullish sentiment, likely to induce retail traders into the market before a potential larger move.
LEARNING POINT: "1H and 4H show recovery with potential liquidity sweeps above recent highs indicating a shift from bearish to bullish sentiment."
SIGNAL: WAIT SYMBOL: XAUUSD ENTRY PRICE: $3,290.25 STOP LOSS: $3,280.00 (just below the recent swing low on the 15m chart) TARGET PRICE: $3,310.00 (near the previous high on the 1H chart) CONDITION: Buy limit order at $3,290.25 after confirming a bullish continuation pattern on the 15m chart. **RATIONALE: Calculated risk/reward ratio of 1:1.9 (Risk=**0.25, Reward=**9.75) does not meet minimum 2:1 requirement. Waiting for better institutional setup with improved risk parameters.
Market Structure: Recovery from lows on higher timeframes with higher lows and higher highs on lower timeframes.
Momentum: Bullish candles forming consistently across multiple timeframes.
Liquidity: Targeting stops above $3,300, a psychological resistance and previous high.
Strategies Used: Multi-timeframe recovery analysis, liquidity targeting above recent highs.
URGENCY: MEDIUM
TIMEFRAME: Short-term
CONFIDENCE SCORE: 85% (based on current bullish momentum and institutional activity)
**RISK/REWARD RATIO: Risk=$10.25, Reward=$19.75, Ratio=1:1.9 (Below 2:1 minimum)
RISK/REWARD CALCULATION:
Risk = Entry Price - Stop Loss = $3,290.25 - $3,280.00 = $10.25
Reward = Target Price - Entry Price = $3,310.00 - $3,290.25 = $19.75
Ratio = Reward ÷ Risk = $19.75 ÷ $10.25 ≈ 1.93
FINAL DECISION: WAIT The calculated risk/reward ratio is slightly below the minimum threshold of 2:1. Therefore, while the setup shows bullish potential, the current positioning does not offer sufficient reward relative to the risk. Awaiting a better entry point or adjustment in stop loss/target prices could enhance the trade's viability.
XAUUSDWe still need to go touch 3500, but its gonna take its time.
Daily broke the last higher Low to the downside. On the internal structure
On H4 we shifted to a downtrend.

TECHNICALS: Gold on buythrough out last week gold made a reversal pattern on the 1HR TF. It might touch the 3250 price level before heading to the 3350 take profit level this week or it could take off directly from the range it closed at last week. either way, gold is heading for a buy this week based on technical analysis. have a wonderful trading week ahead!!!
Non-agricultural data is coming. Will it affect the market trendBecause there will be non-agricultural data next week, Quaid thinks that the market will not be in a hurry to perform at the beginning of the week. And Friday is the US Independence Day, and the market will be closed in advance; maybe only Wednesday and Thursday are really needed.
This week, gold closed below 3300, and the daily line was also broken, and gold officially entered a bearish trend.
First look at the monthly line chart
Because next Monday is the last day of June, the monthly line will start to close, so you can still pay attention to the support of the monthly line. The MA5 moving average below the monthly line is currently around 3170. Moreover, with the support of non-agricultural data next week, the possibility of touching around 3170 is not ruled out.
Secondly, from the weekly line chart
The weekly line is basically the same as the monthly line. The MA20 moving average below is also around 3170. So next week, I think we should focus on around 3170. The monthly line and the weekly line resonate, so the probability of touching this position is very high.
Finally, let's look at the daily chart. The daily chart shows a downward trend and the short-term support has been broken. The current support is around 3250. I think there is a high probability of a small sideways consolidation at the beginning of the week. If the market conditions are eager to change, it may rebound slightly and then continue to decline. If it falls below 3250, it will continue to fall towards 3200. If this level is broken, it may hit the low point of 3170-3175.