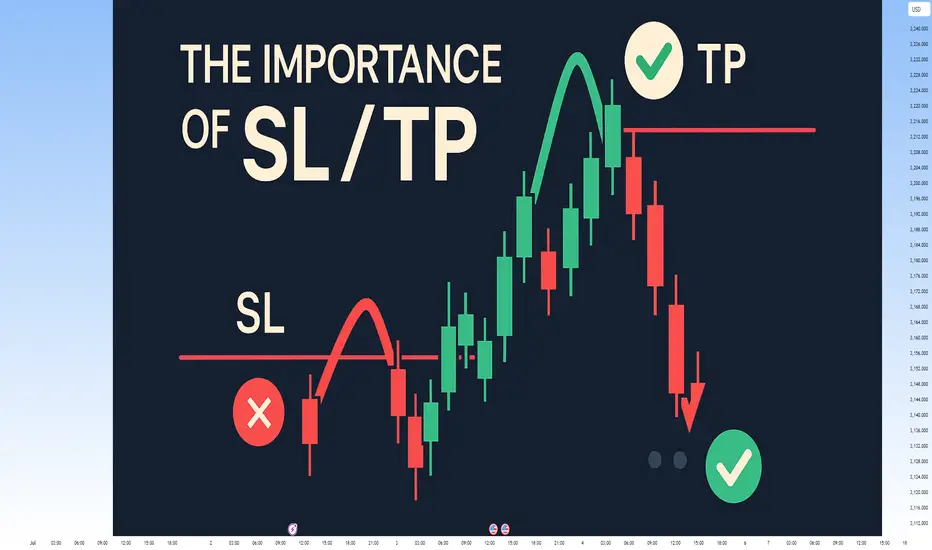
The Power of Setting SL and TP: Secret to Mastering Your TradeThe Power of Setting SL and TP: The Secret to Mastering Your Trade
Hey there, traders! 👋 Let’s talk about something that can make a world of difference in your trading journey – Stop Loss (SL) and Take Profit (TP). These simple tools may look basic, but they are essential for every trader to stay consistent and profitable in the long run.
In today’s post, we’ll dive into the importance of setting SL and TP for each trade and how these two tools can change your trading game. Whether you’re new to trading or have been in the game for a while, understanding and applying SL and TP correctly is key to building a solid and profitable trading strategy. Let’s get started!
1. What Exactly Are SL and TP?
Stop Loss (SL):
A Stop Loss is the level where you decide to cut your losses if the market moves against your trade. It's your safety net, ensuring that your losses stay manageable. For example, if you’re trading XAU/USD at $1800 and don’t want to lose more than $50, you’d set your SL at $1750.
Take Profit (TP):
Take Profit is the level at which you’ll close your trade once the price reaches your desired profit. This helps you lock in profits automatically, without the temptation to stay in the market too long. For example, if you think gold will rise to $1850, you’d set your TP at that level to secure the profit.
2. Why Are SL and TP Crucial?
A. Eliminating Emotion from Your Trades
One of the hardest challenges in trading is keeping emotions out of the equation. Fear and greed can cause you to hold onto losing positions for too long or exit too soon. SL and TP automate your exits, allowing you to trade with a clear plan and reduce emotional decision-making.
B. Managing Risk Like a Pro
Risk management is the backbone of any successful trading strategy. SL limits your losses by setting a predefined level where your trade will automatically close. Without SLs, you could risk losing more than you intended, which can damage your trading account.
C. Securing Consistent Profits
TP helps you to capture profits at the right time. Without it, you might let your profits slip away as the market moves against you. A TP ensures you don’t miss out on locking in gains when the market reaches your target.
D. Building Consistency
By setting SL and TP, you create a consistent and structured approach to your trading. If you trade with a 1:2 risk-to-reward ratio, where you risk $1 to make $2, you can build long-term profitability, even if you lose some trades along the way. Consistency is the key to success in trading.
3. How to Set SL and TP Like a Pro
A. Start with Proper Analysis
Before entering any trade, always analyze the market context. Use technical analysis (like support and resistance levels, Fibonacci, and trendlines) to place your SL and TP at logical levels. For example, set your SL slightly below support for a buy trade, or slightly above resistance for a sell trade.
B. Risk-to-Reward Ratio
A good rule of thumb is to have a 1:2 risk-to-reward ratio. This means if you risk $50 on a trade, you aim to make at least $100. This allows you to lose half of your trades but still come out ahead in the long run. Always set your TP in relation to your risk tolerance.
C. Use Indicators to Help
Use indicators like EMA, RSI, Fibonacci retracements, and pivot points to determine the best levels for your SL and TP. For example, if you see a strong bullish trend and are entering a buy position, placing your TP near the next Fibonacci extension level is a great strategy.
D. Keep Volatility in Mind
Market volatility plays a big role in where you place your SL and TP. In highly volatile markets, tight SL might get hit too early. Adjust your SL to reflect the market’s movement. Similarly, your TP should be flexible enough to account for volatility.
4. Benefits of Setting SL and TP
A. Reducing Emotional Trading
Emotional trading is the quickest way to lose money. SL and TP take emotion out of the equation, making trading more objective and disciplined. You know exactly when you’re getting in, and when to get out – no guessing!
B. Avoiding Overtrading
Without clear SL and TP levels, you might overtrade, holding positions for too long or exiting too early. This lack of structure leads to emotional decisions and bad habits. Having SL and TP in place ensures that you trade only when it makes sense.
C. Gaining Confidence
By setting clear SL and TP levels, you gain confidence in your trading strategy. You know that your risk is limited and your profits are protected. This allows you to trade with a calm mindset, focusing on quality trades instead of rushing into everything.
5. Conclusion
Setting SL and TP is one of the most important skills for any trader, whether you're new to the market or experienced. They help you manage risk, capture profits, and build a disciplined approach to trading. By incorporating SL and TP into your trading plan, you can protect your capital, lock in profits, and ensure consistent growth in your trading journey.
So remember, Plan your trade and trade your plan – and always set your SL and TP before entering any trade.
Happy Trading! Stay disciplined, stay profitable! 💰🚀
XAUUSD.F trade ideas
Gold short-term trading strategy updateGold short-term trading strategy update
I. Analysis of key price ranges
Bull market attack path (need to break through to confirm)
First resistance level: 3355~3360 (yesterday's high, pressure zone in Asian session)
Breakthrough signal: three consecutive K lines on the hourly chart stand above 3360, and trading volume increases
Second resistance level: 3375~3380 (golden ratio 0.618 + weekly Bollinger band middle track)
Final goal: 3400 integer mark (breakthrough will trigger algorithmic trading buy, accelerate to 3425/3450)
Bear market counterattack defense line (break through and reverse the trend)
First support level: 3315 (5-day moving average + 4-hour chart EMA55)
Key observation point: Can this position be maintained before the European session?
Life and death line: 3300~3295 (psychological barrier + opening price of this week)
Breakthrough target: 3275 (low point on June 28) → 3255~3245 (200-day moving average + weekly level support)
II. Intraday long and short tactical deployment
▶ Long strategy (defensive counterattack type)
Entry conditions:
Appearance near 3315: ① 15-minute chart Pinbar reversal pattern ② RSI bottom divergence (30-minute cycle)
Stop loss setting: 3308 (invalid before breaking through the previous low)
Target ladder:
3340 (Asian session high)
3355 (reduce position 50%)
3375 (stop loss to cost price)
▶ Short strategy (trend-following strategy)
Entry time:
Appearance in the 3355~3360 area: ① Shooting star/evening star ② 4-hour TD sequence selling structure
Or 3302 effective breakthrough and callback confirmation (5-minute chart closed below 3300)
Stop loss rules:
High stop loss 3378 (break through yesterday's high 1.5 times ATR)
Break through short-term stop loss 3318 (pullback after support turns into resistance)
Target space:
3275 (profit and loss ratio 1:3)
3255 (medium-term holding requires cooperation with non-agricultural data)
III. Institutional order flow monitoring
CME futures data:
There is a large option barrier above 3350 (25,000 call options expire)
There is an accumulation of algorithmic trading buying in the 3300~3315 range (high-frequency trading support level)
London fixing price reminder:
This morning's fixing price is 3326. If the afternoon fixing price is lower than 3310, bearish sentiment will increase
IV. Emergency Warning
Today's US ADP employment data
Expected: +185,000 |
Data>200,000: bearish for gold (quick test of 3300)
Data<150,000: positive for breaking through 3355
Geo-risk time window
Iran nuclear negotiation deadline
★ Final conclusion:
Asia-Europe session: 3315~3355 range operation (sell high and buy low)
US session: wait for ADP data to trigger a breakthrough, strictly stop loss of $3 (leverage accounts need to reduce positions to one-third)
Breakthrough formula:
"Break through 3355 and chase more, don't guess the top before 3400;
3300 is lost and then pulled back, consider catching the flying knife at 3255"
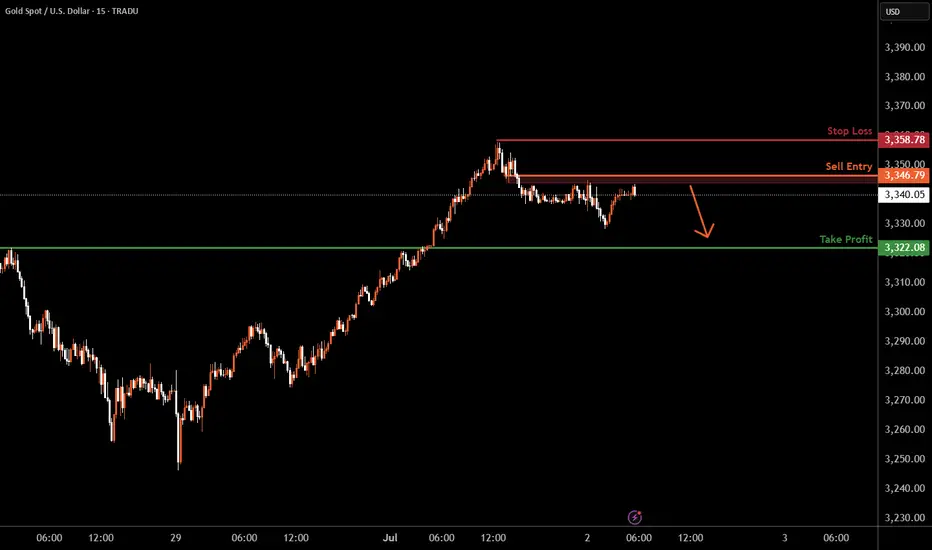
XAUUSD M15 I Bearish Drop Based on the H4 chart analysis, we can see that the price is trading near our sell entry at 3343 -3346.77, an overlap resistance
Our take profit will be at 3322.08, a pullback support.
The stop loss will be placed at 3358.78 which is a swing-high resistance.
High Risk Investment Warning
Trading Forex/CFDs on margin carries a high level of risk and may not be suitable for all investors. Leverage can work against you.
Stratos Markets Limited (tradu.com ):
CFDs are complex instruments and come with a high risk of losing money rapidly due to leverage. 63% of retail investor accounts lose money when trading CFDs with this provider. You should consider whether you understand how CFDs work and whether you can afford to take the high risk of losing your money.
Stratos Europe Ltd (tradu.com ):
CFDs are complex instruments and come with a high risk of losing money rapidly due to leverage. 63% of retail investor accounts lose money when trading CFDs with this provider. You should consider whether you understand how CFDs work and whether you can afford to take the high risk of losing your money.
Stratos Global LLC (tradu.com ):
Losses can exceed deposits.
Please be advised that the information presented on TradingView is provided to Tradu (‘Company’, ‘we’) by a third-party provider (‘TFA Global Pte Ltd’). Please be reminded that you are solely responsible for the trading decisions on your account. There is a very high degree of risk involved in trading. Any information and/or content is intended entirely for research, educational and informational purposes only and does not constitute investment or consultation advice or investment strategy. The information is not tailored to the investment needs of any specific person and therefore does not involve a consideration of any of the investment objectives, financial situation or needs of any viewer that may receive it. Kindly also note that past performance is not a reliable indicator of future results. Actual results may differ materially from those anticipated in forward-looking or past performance statements. We assume no liability as to the accuracy or completeness of any of the information and/or content provided herein and the Company cannot be held responsible for any omission, mistake nor for any loss or damage including without limitation to any loss of profit which may arise from reliance on any information supplied by TFA Global Pte Ltd.
The speaker(s) is neither an employee, agent nor representative of Tradu and is therefore acting independently. The opinions given are their own, constitute general market commentary, and do not constitute the opinion or advice of Tradu or any form of personal or investment advice. Tradu neither endorses nor guarantees offerings of third-party speakers, nor is Tradu responsible for the content, veracity or opinions of third-party speakers, presenters or participants.
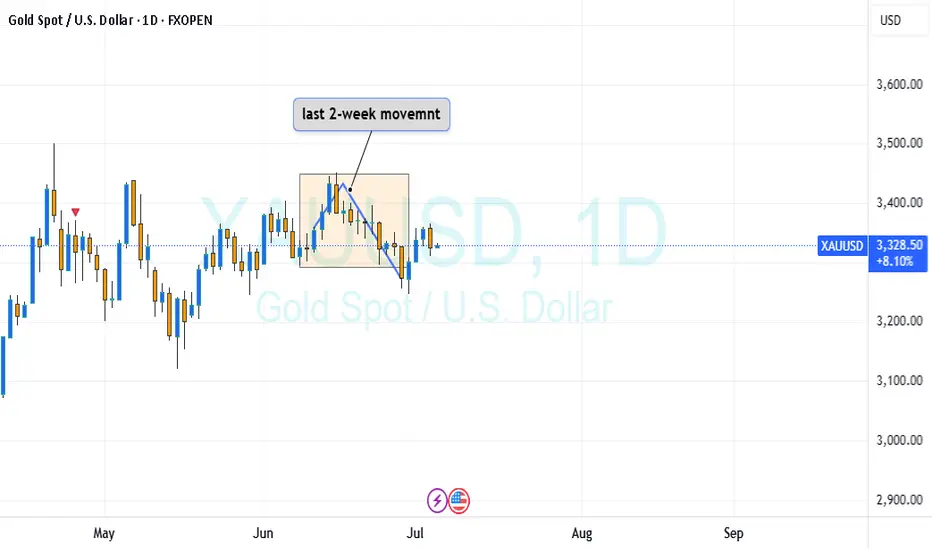
XAU/USD Retrace ideaRetrace of asain Session highs and lows are very possible,possible previous day high trend

XAU USD 2HR CHART ANALYSIS 🔎 XAUUSD (Gold Spot) 2H Chart Analysis:
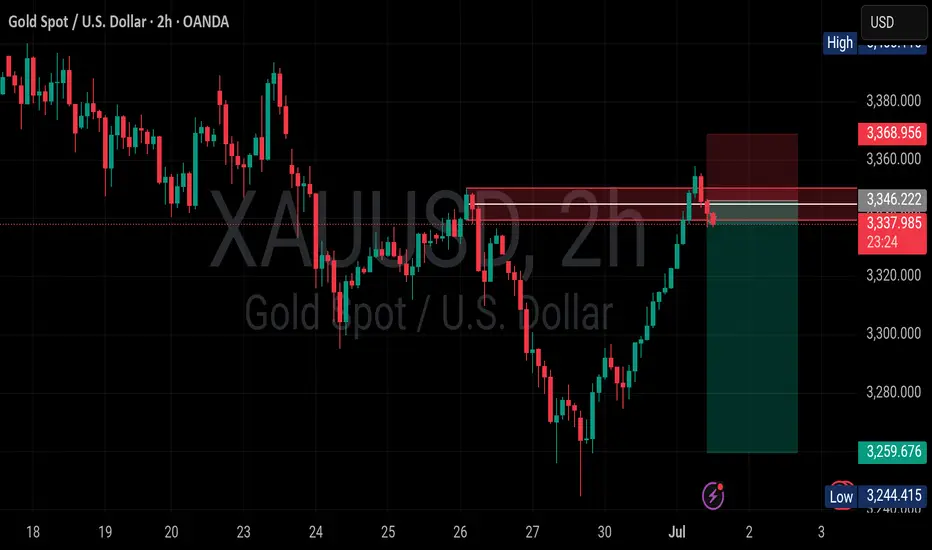
✅ Price recently made a strong bullish rally up to the resistance zone between 3346–3368.
✅ A supply zone has been marked in this area, which is currently causing a bearish reaction.
✅ BOS (Break of Structure) and ChoCH (Change of Character) labels on the chart indicate that the overall market structure has been bearish, and price has now retraced to this supply area for a potential pullback.
✅ The trader appears to have taken a short position with a stop loss around 3368 and a target around 3259, giving a risk-reward ratio of approximately 1:3.
---
🔎 Possible Scenarios:
✅ Bearish Scenario (preferred):
If the supply zone at 3346–3368 holds and price rejects from there, the logical target could be the previous support near 3259, in line with market structure and bearish momentum.
✅ Bullish Scenario (invalidation):
If price breaks above 3368 with strength and confirms a candle close above, that would invalidate the supply zone, and the uptrend may resume toward higher levels around 3418 (previous highs).
---
🔎 Key Levels:
✔️ Resistance (Supply Zone): 3346–3368
✔️ Support (Demand Zone): 3259–3244
✔️ Market Structure: bearish, with a pullback into supply
✔️ Stop loss (for the short): above 3368
✔️ Target: around 3259
---
This analysis is not financial advice and does not constitute a trade recommendation.
OANDA:XAUUSD
GOLD - $4000+ in the 2020s I believe gold is real wealth.
You can hold in your hand, protect it and use it as you see fit.
Hold a stack of gold coins in your hand and see for yourself that there is nothing else quite like it.
There is also the metaphysical property of gold to attract more wealth, acknowledged in many cultures.
This has been true for me since I started accumulating physical gold.
So I am price agnostic about it.
I buy it and hold it because I like it.
I believe it is a unique way to store wealth energy in this world.
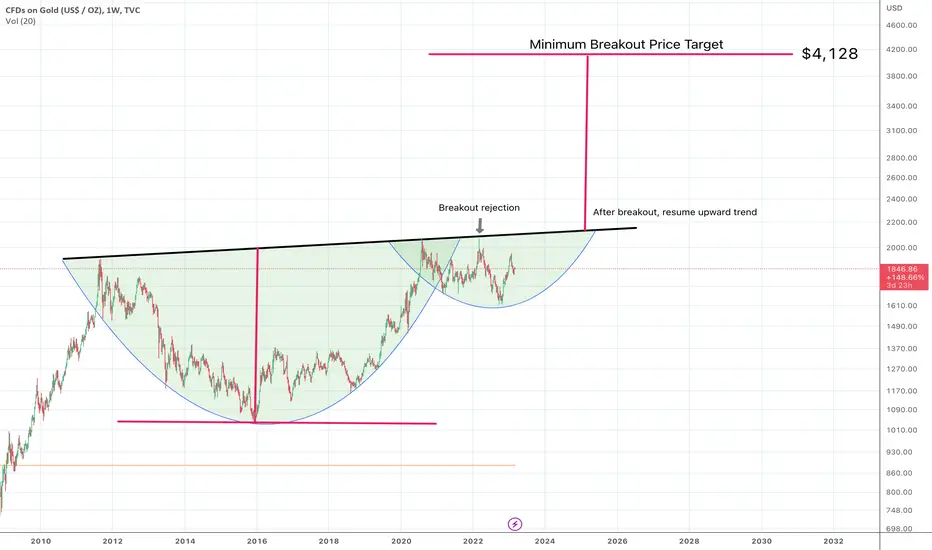
Looking at the chart, the days of buying physical gold at these sub $2000 prices may soon come to an end.
We have a huge cup, and a developed handle that is taking its time to break upwards.
The breakout was already rejected once. That will make the breakout all the more violent when it finally comes.
According to the minimum target of a cup and handle pattern, the gold price per oz will have a "4" handle before this decade is finished.
If you can, hold physical gold, in secret, well-guarded.
The fundamentals for a gold resurgence have been there for years now - fiat currency inflation and a scramble to store wealth.
Most people are still in a mindset of playing the trading game, or the interest - bearing game. Trying to beat the market and get something for nothing.
Those are net loss games now, and for the near future. There is a risk in holding your money in paper assets that few are talking about.
Those games will return when we create sound money again.
Good luck and enjoy!
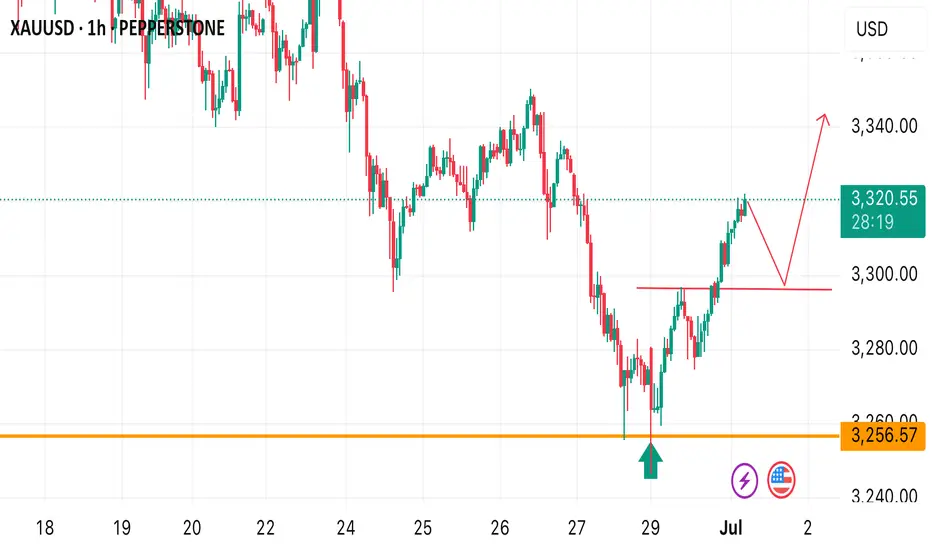
XAUUSD POSSIBLE BUY OPPORTUNITY Price rebounded around the 3256.57 finding a support at that price level. From the H1 timeframe, a pull back to 3296.56 provides a buy opportunity. Keep watch on gold for a potential bullish move!
OVERALL BEARISH TREND ON GOLD FOR THE WEEK There is an overall bearish Trend on Gold, but the Price will retrace upwards to take out a level of inducement, which is the pullback after the break of the structure and also clear the liquidity at the previous high that was created last week on the high timeframe. So you can still get a retacement to buy on h1 to clear those levels/areas. Although the main trend is bearish
Gold set up playing wellExpecting price to retrace to the zone playing out well
Follow for more ideas
GOLD Will Grow! Buy!
Here is our detailed technical review for GOLD.
Time Frame: 1D
Current Trend: Bullish
Sentiment: Oversold (based on 7-period RSI)
Forecast: Bullish
The market is approaching a significant support area 3,281.18.
The underlined horizontal cluster clearly indicates a highly probable bullish movement with target 3,396.94 level.
P.S
The term oversold refers to a condition where an asset has traded lower in price and has the potential for a price bounce.
Overbought refers to market scenarios where the instrument is traded considerably higher than its fair value. Overvaluation is caused by market sentiments when there is positive news.
Disclosure: I am part of Trade Nation's Influencer program and receive a monthly fee for using their TradingView charts in my analysis.
Like and subscribe and comment my ideas if you enjoy them!

xauusdGold enters support by reaching daily trend line
If gold continues to hold support
Gold is expected to reach its previous high again
Gold 1H: Potential Rejection or Continuation PlayGold (XAUUSD) Technical Outlook – 1H Timeframe
Price is currently reacting near 3275, with a potential scenario for either a bullish continuation toward the 3287–3290 zone or a rejection that could push the market back down toward the 3250–3245 support area.
Key levels to monitor:
🔹 Resistance: 3287–3290
🔹 Mid-support: 3270
🔹 Lower support: 3250–3245
I will wait for price confirmation around these levels before considering new entries.

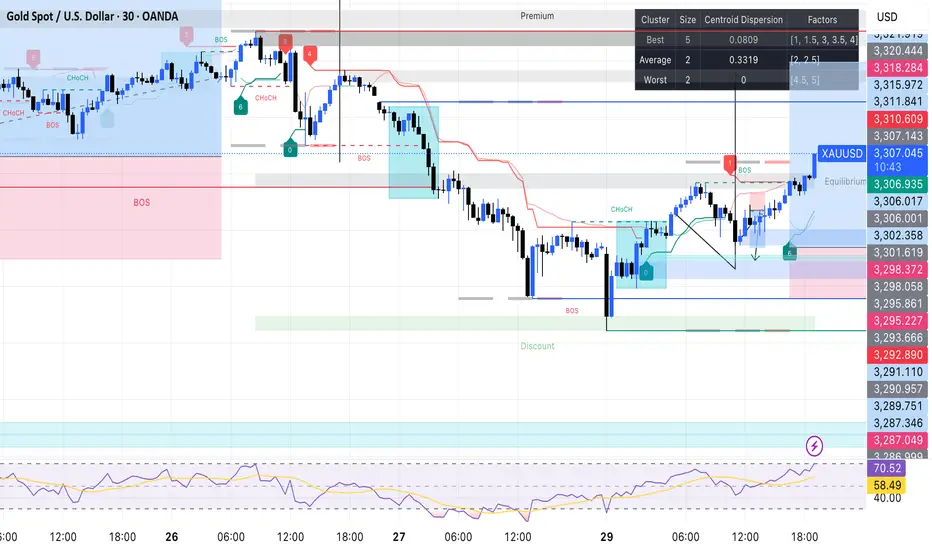
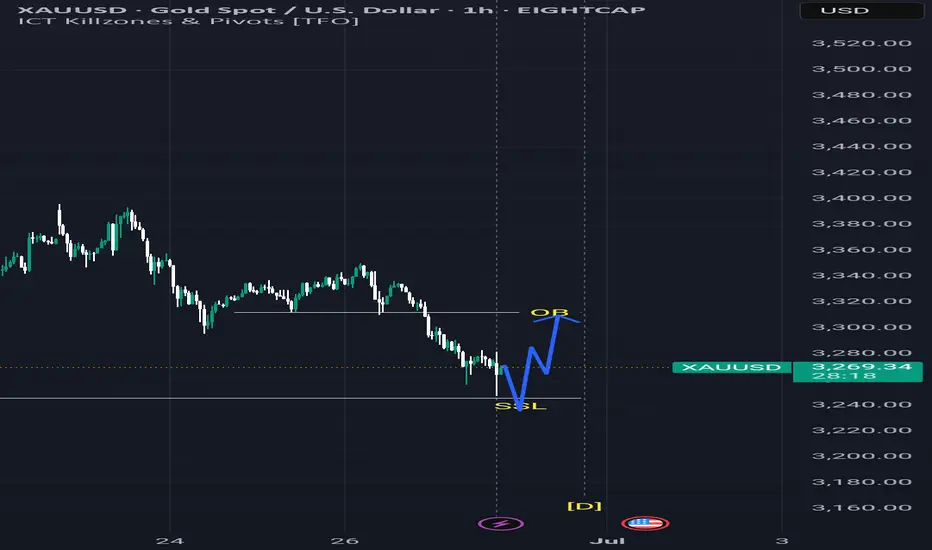
XAUUSD June 29,2025🟦 XAUUSD Analysis – June 29, 2025
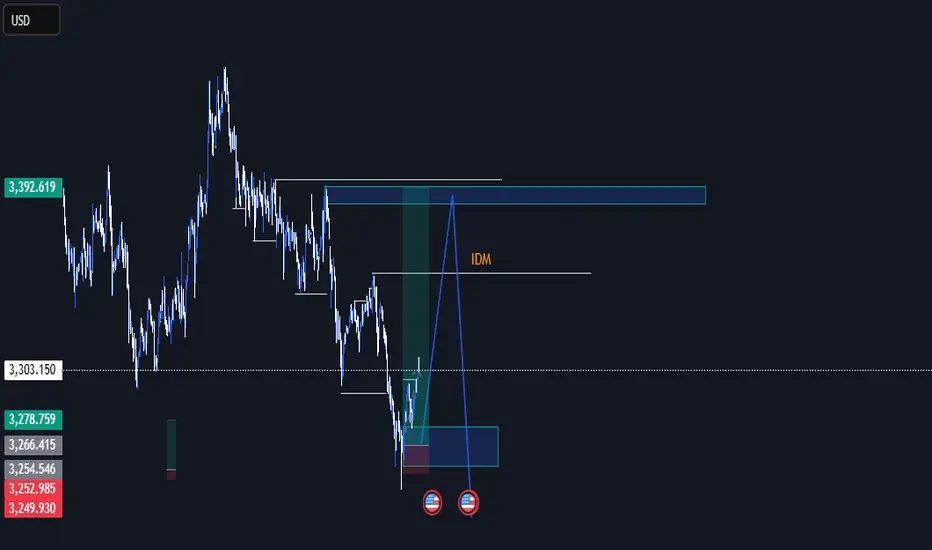
Market Structure:
Price is in a bearish trend on the 1H timeframe.
Liquidity is resting below a recent low around $3,240 (Sell-Side Liquidity – SSL).
There is a visible Order Block (OB) around $3,310–$3,320, which could act as a magnet if price reverses.
Anticipated Move (Blue Path):
1. Price is expected to drop below the SSL to trigger stop-losses and collect liquidity.
2. After the liquidity grab, a bullish reversal is likely.
3. Price may then rally toward the OB, which could act as resistance or a point for institutional selling.
---
🔎 Probability Breakdown:
Event: Break below SSL (~$3,240)
Likelihood: ✅ High
Note: Classic liquidity grab setup
Event: Bullish reversal after sweep
Likelihood: ⚠️ Moderate–High
Note: Wait for confirmation (BOS, FVG, bullish candle)
Event: Rally to OB (~$3,310–$3,320)
Likelihood: ⚠️ Moderate
Note: Depends on bullish structure forming
Event: Rejection from OB
Likelihood: ✅ High
Note: OB may act as supply zone
---
⚠️ Caution:
This scenario is only valid if price grabs SSL first.
No entry should be made without a proper bullish confirmation (e.g., break of structure, fair value gap fill, or strong bullish candle).
Always use risk management – this is a hypothetical setup, not financial advice.
---
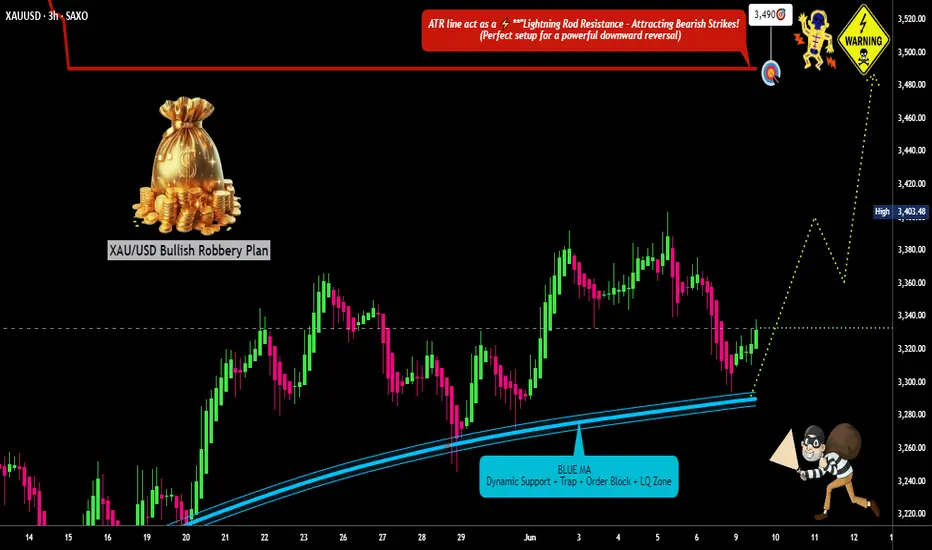
"The Great Gold Heist" – XAU/USD Master Plan🏆 "The Great Gold Heist" – XAU/USD Master Plan (High-Risk, High-Reward Loot!) 🚨💰
🌟 Attention, Market Robbers & Money Makers! 🌟
Hola! Oi! Bonjour! Hallo! Marhaba! 🤑💸
🔥 Based on the legendary Thief Trading Strategy (technical + fundamental heist tactics), here’s our blueprint to STEAL massive profits from the XAU/USD (Gold vs. Dollar) market! 🔥
🎯 The Heist Plan (Long Entry Setup)
Entry Point 📈: *"The vault is UNLOCKED! Swipe bullish loot at any price—but for a cleaner steal, set Buy Limits within 15-30M recent swing lows/highs. ALERT UP! ⏰"*
Stop Loss 🛑: "Thief’s SL hides at the nearest swing low (3H TF: 3250.00) OR below the last daily candle wick. Adjust based on your risk appetite & lot size!"
Target 🏴☠️: 3490.00 (or escape early if the cops—err, bears—show up!)
⚡ Scalper’s Quick Loot Guide:
"Only scalp LONG! Rich? Go all-in. Broke? Join the swing traders & rob slow ‘n’ steady. Use Trailing SL to lock profits!"
📊 Market Status:
XAU/USD (GOLD) – Neutral (But Bullish Sneak Attack Likely! 🐂💥)
"The heist is ON, but watch for traps—overbought zones, consolidation, and bearish robbers lurking!"
🔍 Pro Thief Moves:
✅ Fundamentals Matter! (COT Reports, Geopolitics, Macro Data, Sentiment—check our BIO0 for the full loot list!) 🔗👉🏻☝🏻
✅ News = Danger! Avoid new trades during releases. Trail your SLs to protect stolen cash! 📰🚨
💖 Support the Heist Crew!
"Hit the BOOST BUTTON 💥 to strengthen our robbery squad! More boosts = easier money steals daily!"
🚀 Stay tuned—another heist drops soon! 🐱👤💎
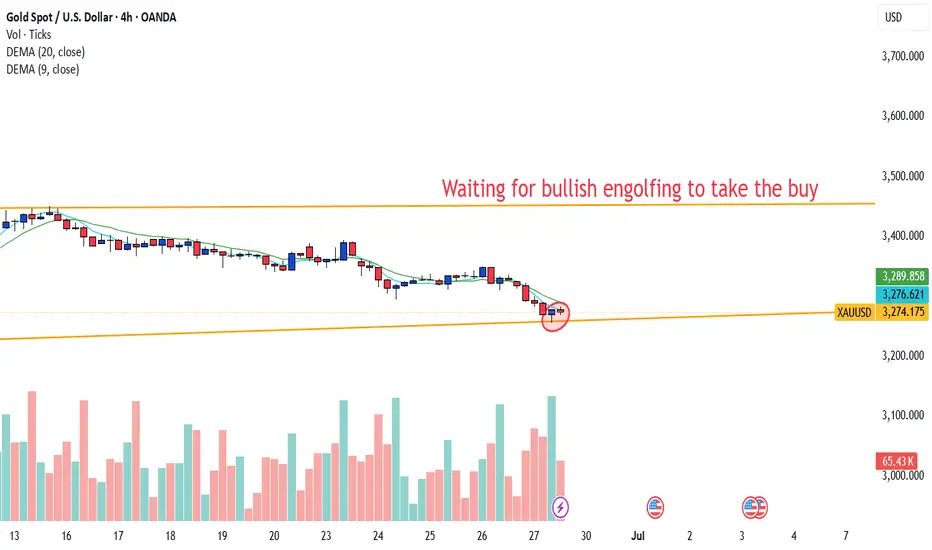
Gold Will recover Next weekWaiting for a Three bullish candlesticks to take our buy next week , be ready on londay or wednesday for high probability win
Technical Overview (Daily Time Frame) - GOLDTVC:GOLD
HELLO TRADERS
Let's start...
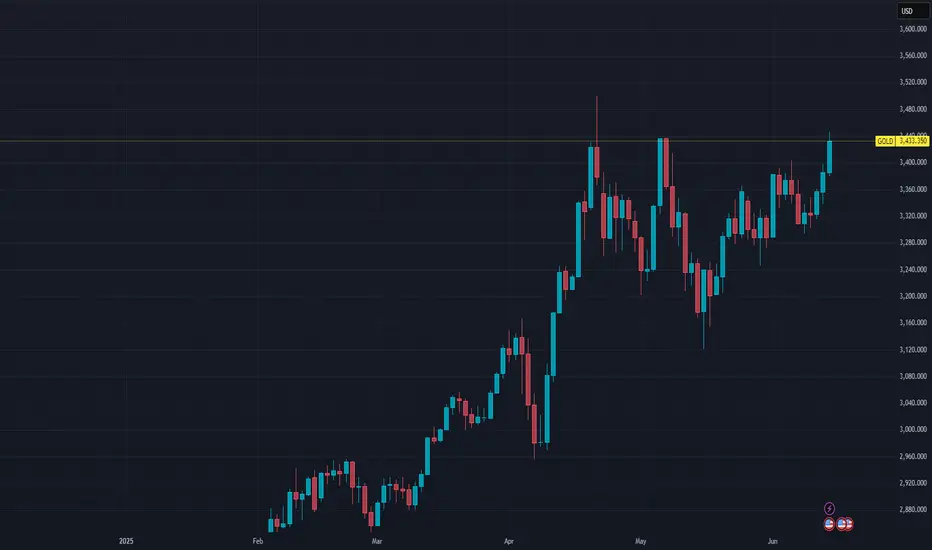
✅ Trend Structure:
The overall structure is bullish, with higher highs and higher lows from March onward.
Price has recently broken out of the consolidation zone and is now trading at $3,443, approaching a key resistance zone.
📏 Key Levels:
Immediate Resistance: $3,480 – $3,500 (previous highs from April)
Major Resistance: $3,560 – $3,600
Immediate Support: $3,360 – $3,320 (former range highs)
Major Support: $3,240
📊 Candlestick Signal:
The last few candles show strong bullish momentum and increasing range, indicating breakout strength.
📈 Scenario 1: Buy Setup (Breakout Continuation)
Entry: Buy at $3,450 – $3,460 (After being sure for no more rejection at 3,440-3,450)
Stop Loss (SL): $3,410
Target Price (TP):
TP1: $3,480
TP2: $3,500 (near-term resistance)
TP3: $3,550 (April swing high)
TP4: $3,600 (Geopolitical ,psychological and Fibonacci extension level)
📌 Reason: Momentum breakout of previous consolidation. Entering on strength with a pullback toward breakout retest is safer.
📉 Scenario 2: Sell Setup (Fake Breakout / Rejection)
Trigger: Only if there's a daily close below $3,400 or a strong rejection candle
Entry: Sell below $3,400
Stop Loss (SL): $3,455
Target Price (TP):
TP1: $3,360
TP2: $3,320 (previous support area)
TP3: $3,280
📌 Reason: Rejection at resistance may lead to short-term correction or liquidity sweep before higher move.
📌 CAREFULL: Classic “breakout and retest” setup. Safer than chasing highs. i.e. BUY setup safer than SELL setup.
GOOD LUCK
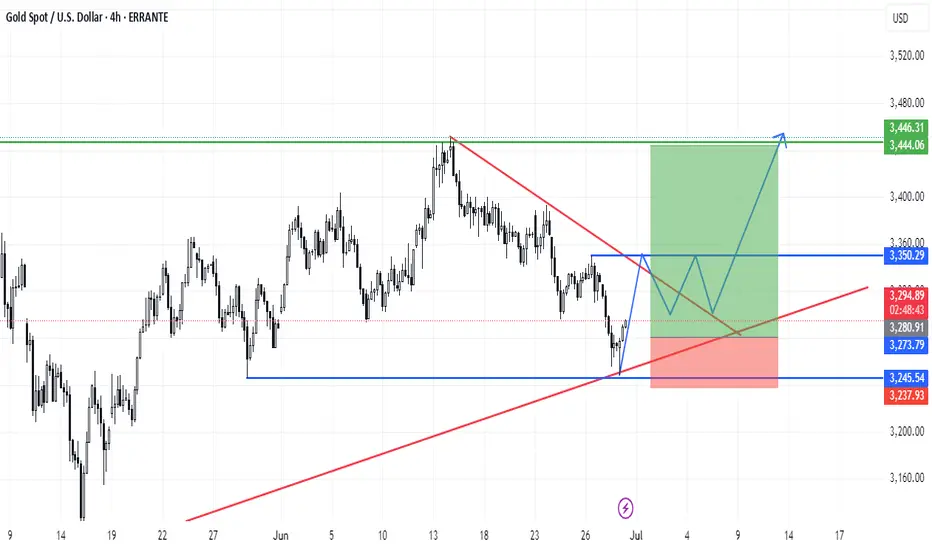
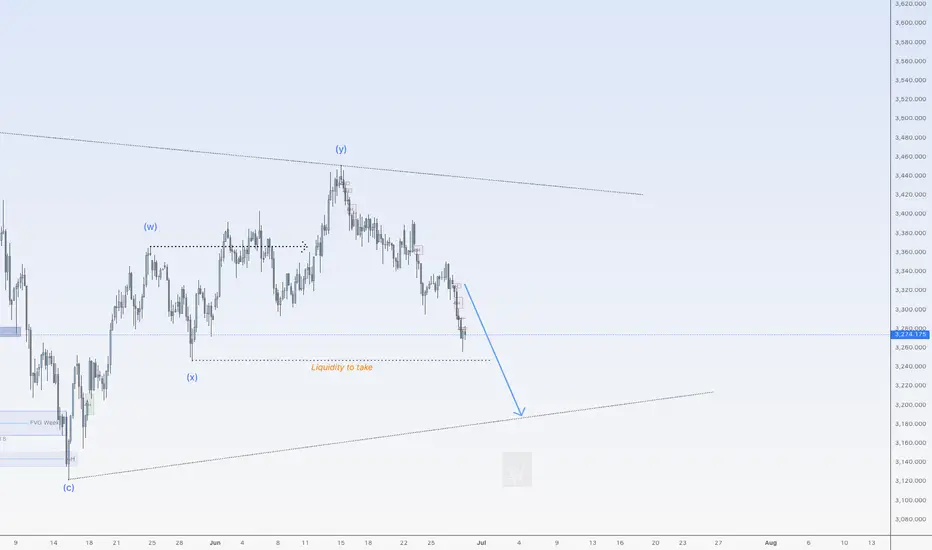
Down for goldHi traders,
Last week gold went lower then expected (wavecount updated).
The last wave down could be wave 2 or it's part of a big Triangle/ Flat.
Next week we could see this pair to go lower to sweep the liquidity below the lows and fill the 4H bullish FVG.
After that it could go up again.
Let's see what price does and react.
Trade idea: Wait for a small correction up on a lower timeframe to finish and trade (short term) shorts.
If you want to learn more about trading FVG's & liquidity sweeps with wave analysis, please make sure to follow me.
This shared post is only my point of view on what could be the next move in this pair based on my technical analysis.
Don't be emotional, just trade your plan!
Eduwave
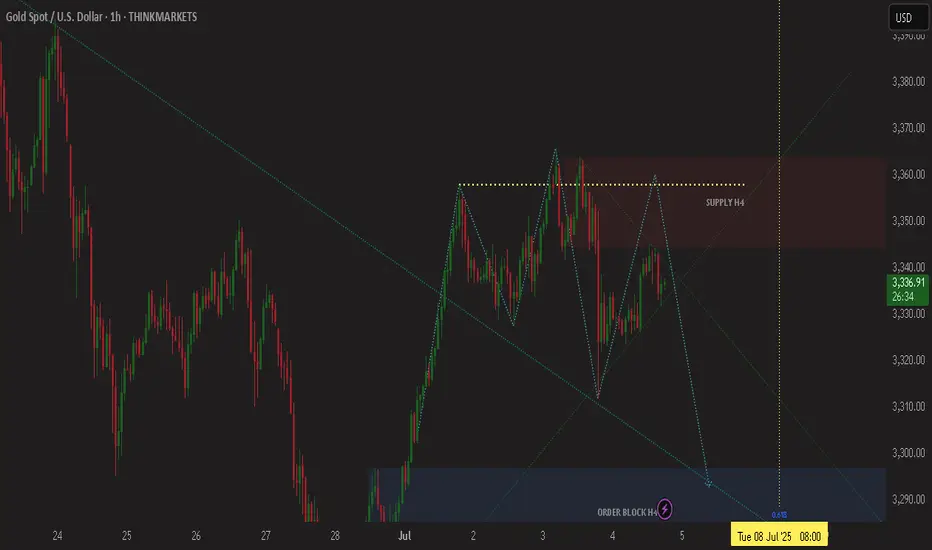
XAUUSD Market Roadmap (June 30 – July 4, 2025)XAUUSD Market Roadmap (June 30 – July 4, 2025)
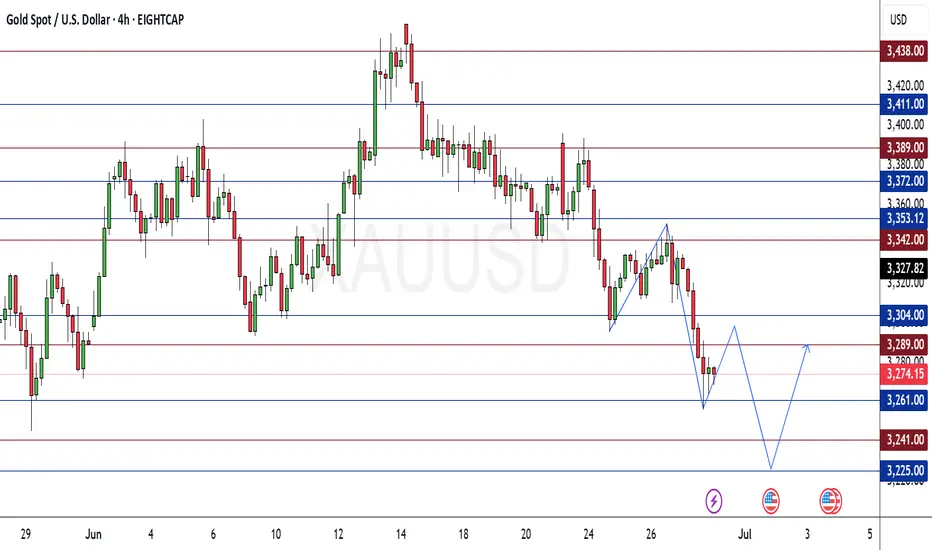
Currently, XAUUSD is showing a rejection at the 3261 demand zone, signaling a potential short-term pullback. As long as the price remains above the 3241 demand level, there is a possibility of testing the 3289 supply zone. However, if sellers re-enter from that area, the market may resume its decline toward the next demand target at 3225.
Key Levels:
Demand (current rejection zone): 3261
Demand (critical support): 3241
Supply (resistance target): 3289
Next downside target: 3225
Disclaimer:
This analysis is for informational purposes only and does not constitute financial advice or a recommendation to buy or sell any financial instrument. Always conduct your own analysis and apply proper risk management before making any trading decisions.
XAUUSD Short Opportunity🔻 XAUUSD Short Opportunity – Targeting 3258.840
Gold is showing signs of weakness after testing key resistance zones.
I'm currently watching a short-term sell setup with a downside target at 3258.840.
If bearish pressure continues, this level could be hit soon.
📉 Keep an eye on confirmation candles and momentum shifts.
👉 Follow me for more real-time setups and precision entries in Gold & Forex!
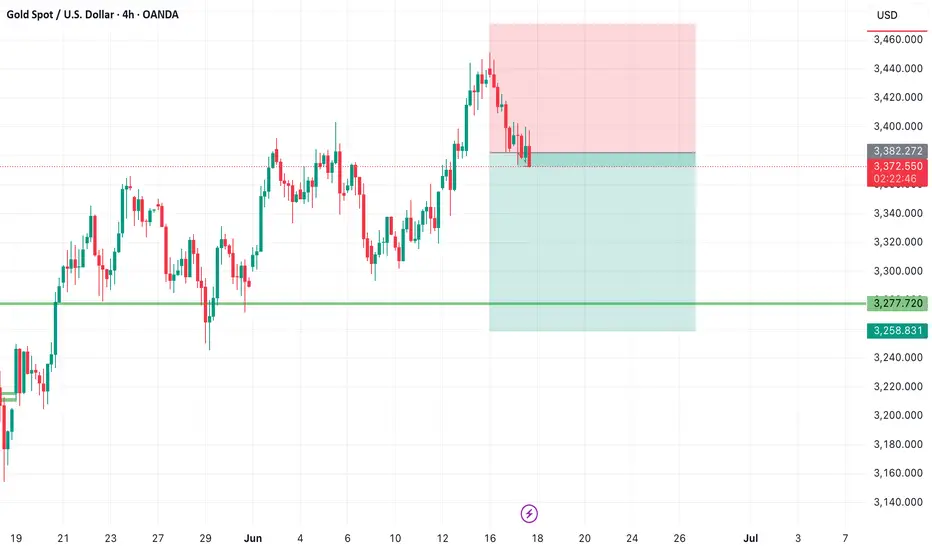
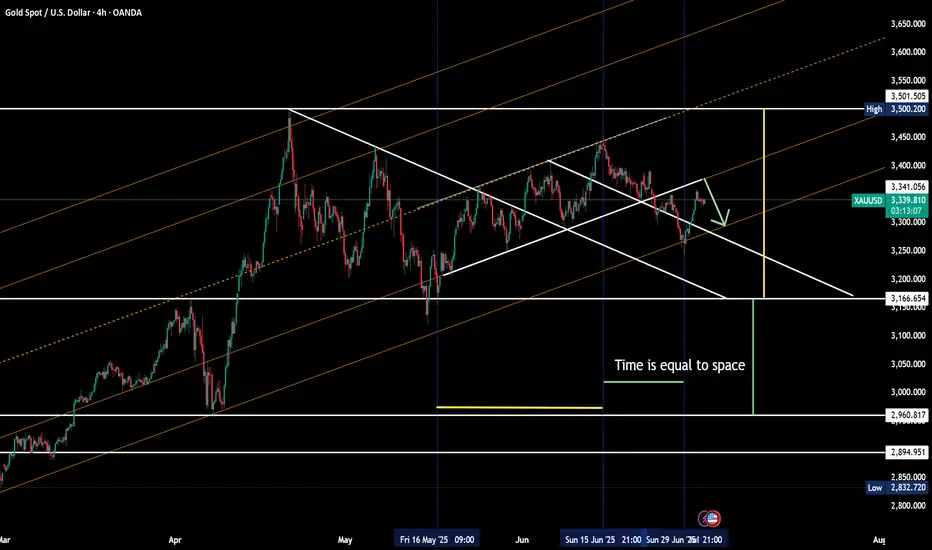
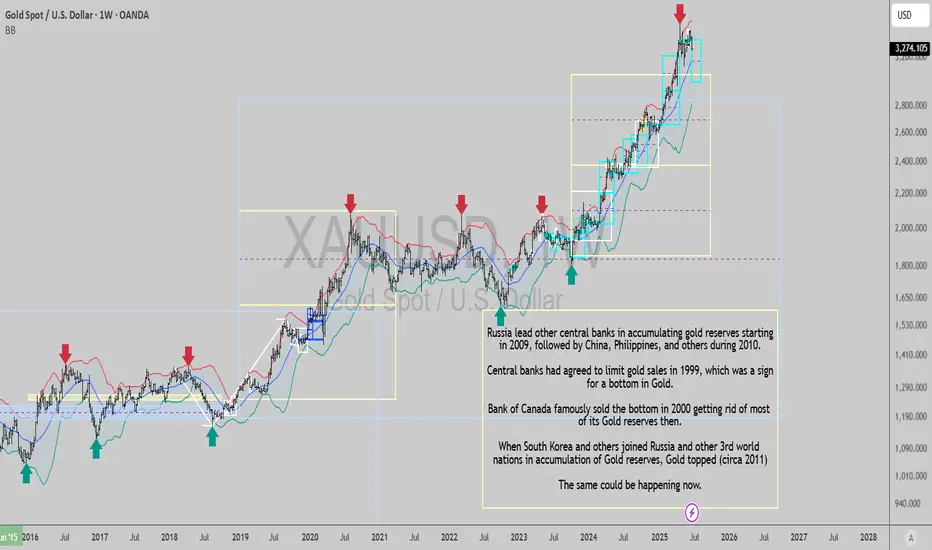
Gold topped...GM gents, it seems OANDA:XAUUSD will reverse the advance here, a weekly timeframe down trend has fired just now. It's either the start of a correction or a reversal of the huge trend it had since Oct 2023.
The arrows on chart show the spots where the weekly timeframe trend reversed, so you get an idea of what to expect.
Best of luck!
Cheers,
Ivan Labrie.
XAUUSD Holds to Decline as Weakness DollarXAUUSD GOLD Outlook – Gold Holds Firm Amid Dollar Weakness and Fed Uncertainty
Gold continues to trade steadily as the U.S. dollar weakens and uncertainty surrounding Federal Reserve policy intensifies. Market speculation is growing following hints that former U.S. President Donald Trump may announce a new Fed Chair as early as September or October.
This development could undermine current Fed Chair Jerome Powell’s influence, potentially shifting the monetary policy outlook. As a result, investor sentiment remains cautious, with many seeking refuge in gold amid the growing ambiguity in central bank direction.
A weaker dollar generally boosts demand for gold, and if speculation around Fed leadership continues, XAUUSD could remain supported or even rally further. Watch for upcoming Fed speeches and political announcements as key drivers.
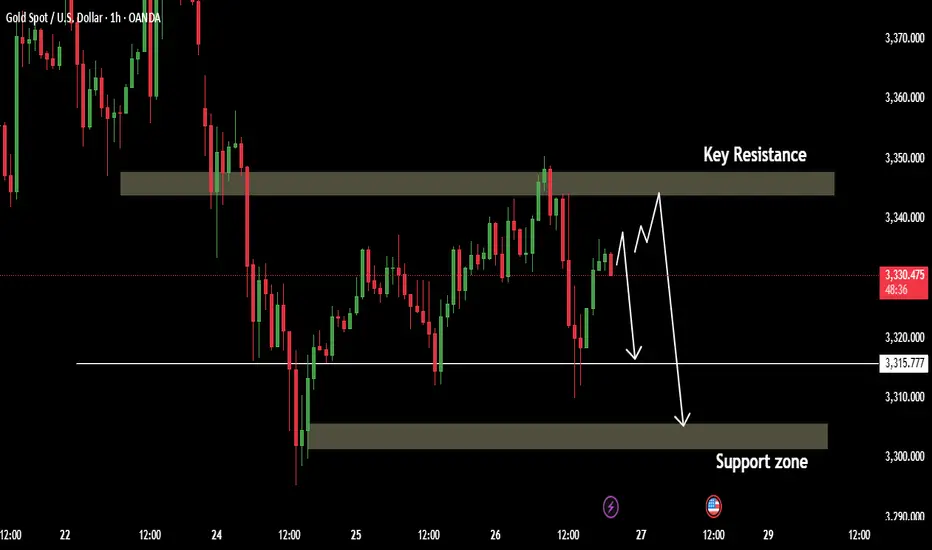
Key Levels to Watch:
Resistance zone 3340 / 3345
Support Level 3315 / 3300
Ps Support with like and comments for more analysis Thanks.
Gold?
Hi
Do you have a crystal ball? I do.. haha
You should rub/shine it frequently. Nahh.. just a joke.
I will call it : a prediction or bias.(That I hold , till proven wrong)
Look at weekly; formed 1 bar bullish , was taken/ broken low by 2 bearish bar.
So I'm bearish still.. although.. this week. it went into area of break price 3291.
The subtle point is.. where do i entry and how much price difference I will put in.
If 20$ gap.. price now $3330.00 +20$ = $3350
for 0.01 = 20$ risk
price 20$ seems reasonable if I'm at the right point/entry.
I'm too basic...
I'm too simple..
Not a guru
NB/ Yest NFP will be a strong bias too. What a sell off :)