Xausdt techinical analysis.Xausdt techinical analysis next move posibale at h1 time frame.not finchinal advice.
XAUUSD.F trade ideas
XAUUSD - trade - market structure XAUUSD - trade - market structure , this is a easy and clean setup, of course there is no analysis:)., use risk and trade managment
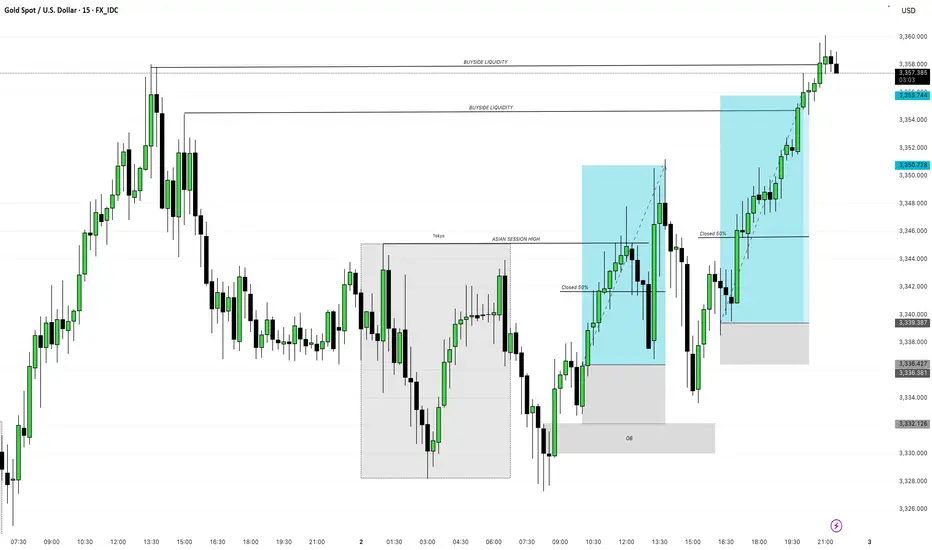
02/07/25 - XAUUSD Trade Analysis & Execution Overall Context
The chart showcases:
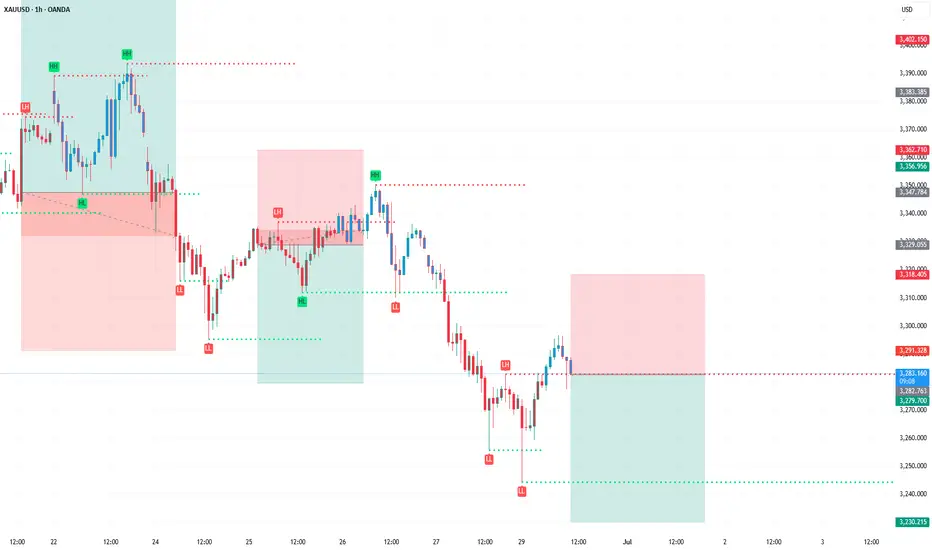
• Smart money concepts (SMC) such as liquidity grabs, order blocks, and session-based trading.
• A bullish bias following a successful manipulation and mitigation during the Asian to London/NY overlap.
Key Concepts Highlighted
Liquidity Zones
• Buyside Liquidity (BSL) is marked above the recent highs, indicating retail buy stop orders — a key magnet for institutional price action.
• Price ultimately targets and sweeps this liquidity.
Sessions
• Tokyo/Asian Session Range is shaded, showing consolidation.
• Price creates a high marked “ASIAN SESSION HIGH”, which becomes a short-term liquidity target.
Order Block (OB)
• A bullish Order Block is marked below price, around the 3,332.126 area.
• Price taps into this OB during the London session, indicating institutional accumulation.
Trade Setup Breakdown
Entry Zone
• Price dipped into the Order Block (OB) after forming a higher low (HL) — this likely triggered long positions.
• Bullish order flow followed with clean, impulsive moves upward.
First Trade Position
• Trade enters post-OB mitigation and breaks above short-term structure.
• First TP (Take Profit) is possibly near the Asian Session High, where 50% was closed (partial profit-taking).
• Price retraces post-take-profit, but maintains bullish structure.
Second Trade Position
• After a retracement into a demand zone (gray shaded), another long opportunity arises.
• The second entry likely occurs after confirmation of support in the retracement.
• TP targets the next buyside liquidity pool.
Trade Management
• 50% Closures are clearly annotated — a risk management tactic to secure profit while letting the rest run.
• Each leg upwards is followed by a correction but respects bullish structure.
Final Target
• The final buyside liquidity pool at the top is swept, suggesting:
• Completion of the smart money play.
• Potential reversal zone or exhaustion.
Summary of Trade Execution
Bias
>Bullish
Entry Basis
> OB Mitigation + Liquidity Sweep + Bullish Break of Structure (BoS)
TP Zones
> Asian Session High, then Final BSL
Risk Management
> 50% closure at intermediate targets
Confirmation
> Structure shift + aggressive entry post-mitigation
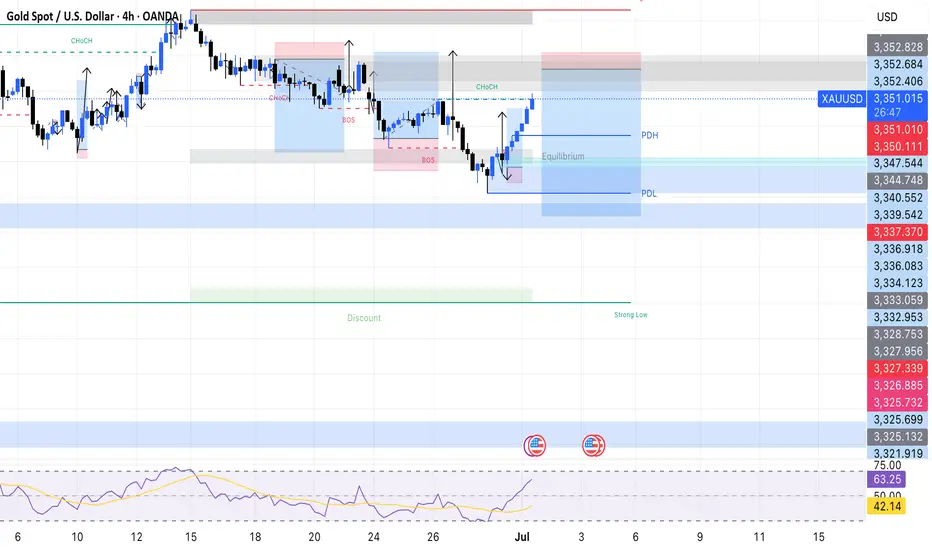
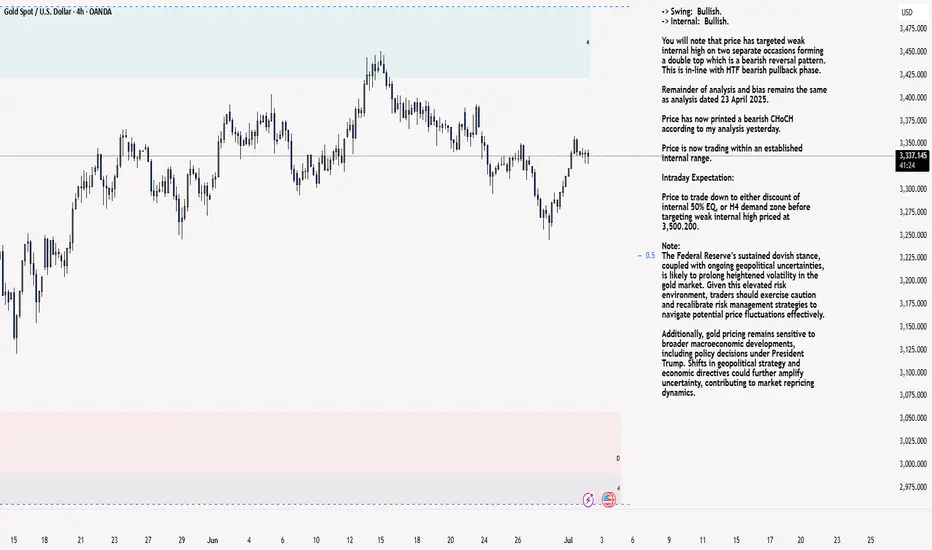
XAU/USD 02 July 2025 Intraday AnalysisH4 Analysis:
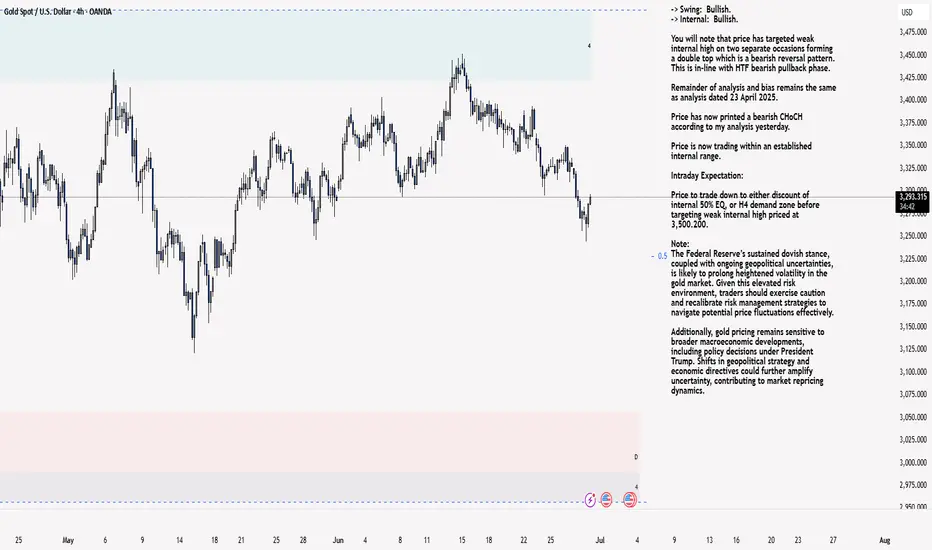
-> Swing: Bullish.
-> Internal: Bullish.
You will note that price has targeted weak internal high on two separate occasions forming a double top which is a bearish reversal pattern. This is in-line with HTF bearish pullback phase.
Remainder of analysis and bias remains the same as analysis dated 23 April 2025.
Price has now printed a bearish CHoCH according to my analysis yesterday.
Price is now trading within an established internal range.
Intraday Expectation:
Price to trade down to either discount of internal 50% EQ, or H4 demand zone before targeting weak internal high priced at 3,500.200.
Note:
The Federal Reserve’s sustained dovish stance, coupled with ongoing geopolitical uncertainties, is likely to prolong heightened volatility in the gold market. Given this elevated risk environment, traders should exercise caution and recalibrate risk management strategies to navigate potential price fluctuations effectively.
Additionally, gold pricing remains sensitive to broader macroeconomic developments, including policy decisions under President Trump. Shifts in geopolitical strategy and economic directives could further amplify uncertainty, contributing to market repricing dynamics.
H4 Chart:
M15 Analysis:
-> Swing: Bullish.
-> Internal: Bullish.
H4 Timeframe - Price has failed to target weak internal high, therefore, it would not be unrealistic if price printed a bearish iBOS.
The remainder of my analysis shall remain the same as analysis dated 13 June 2025, apart from target price.
As per my analysis dated 22 May 2025 whereby I mentioned price can be seen to be reacting at discount of 50% EQ on H4 timeframe, therefore, it is a viable alternative that price could potentially print a bullish iBOS on M15 timeframe despite internal structure being bearish.
Price has printed a bullish iBOS followed by a bearish CHoCH, which indicates, but does not confirm, bearish pullback phase initiation. I will however continue to monitor, with respect to depth of pullback.
Intraday Expectation:
Price to continue bearish, react at either M15 supply zone, or discount of 50% internal EQ before targeting weak internal high priced at 3,451.375.
Note:
Gold remains highly volatile amid the Federal Reserve's continued dovish stance, persistent and escalating geopolitical uncertainties. Traders should implement robust risk management strategies and remain vigilant, as price swings may become more pronounced in this elevated volatility environment.
Additionally, President Trump’s recent tariff announcements are expected to further amplify market turbulence, potentially triggering sharp price fluctuations and whipsaws.
M15 Chart:
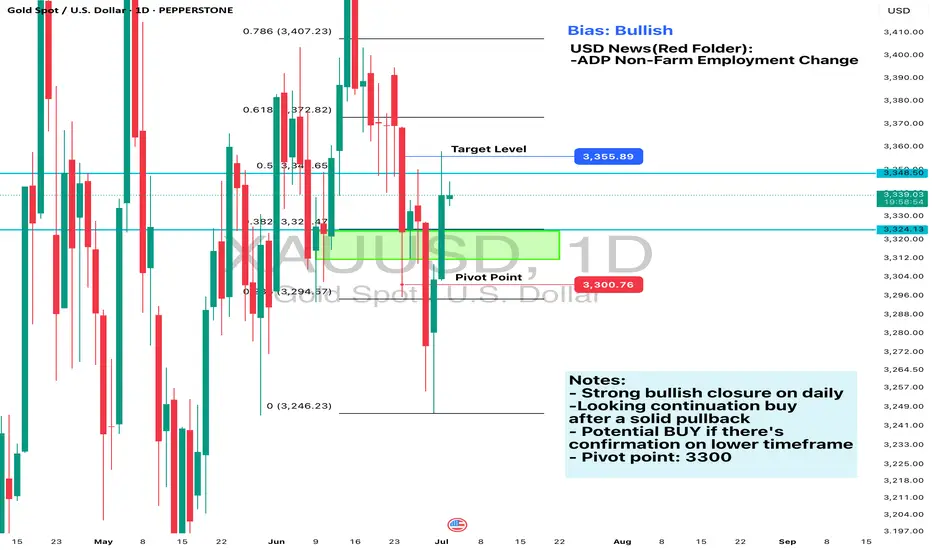
Daily Analysis- XAUUSD (Wednesday, 2nd July 2024)Bias: Bullish
USD News(Red Folder):
-ADP Non-Farm Employment Change
Notes:
- Strong bullish closure on daily
-Looking continuation buy
after a solid pullback
- Potential BUY if there's
confirmation on lower timeframe
- Pivot point: 3300
Disclaimer:
This analysis is from a personal point of view, always conduct on your own research before making any trading decisions as the analysis do not guarantee complete accuracy.
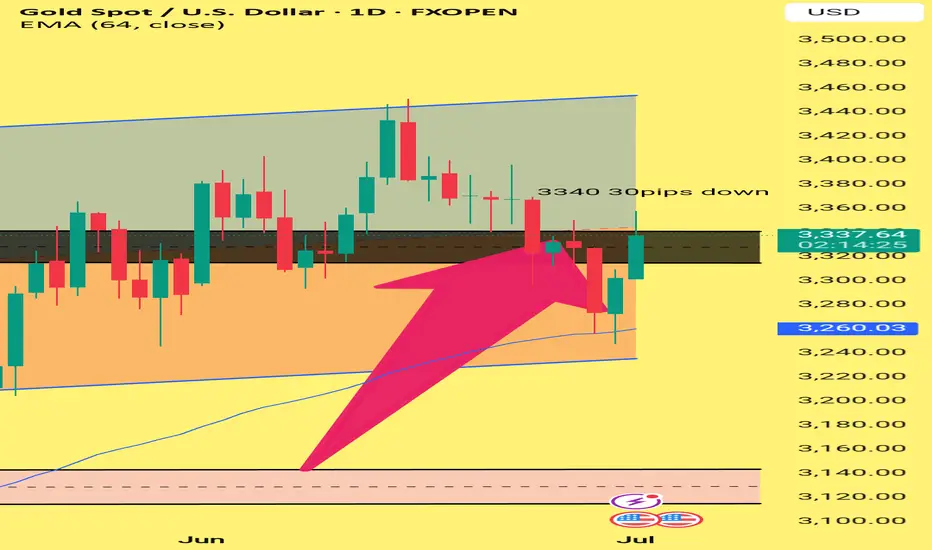
Title: Rejection at 3340 – Gold Struggles to Break ResistanceGold faced a clear rejection at the 3340 zone, dropping nearly 30 pips. This confirms that the 3335–3340 area remains a strong resistance. If price fails to break above this zone, we may see a move towards 3330 in the coming sessions. EMA 64 is now the key support to watch.
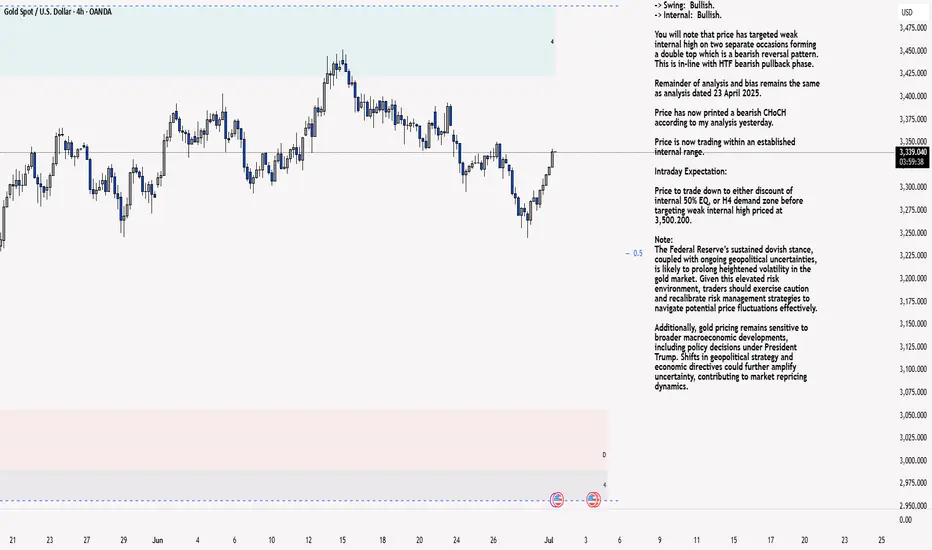
XAU/USD 01 July 2025 Intraday AnalysisH4 Analysis:
-> Swing: Bullish.
-> Internal: Bullish.
You will note that price has targeted weak internal high on two separate occasions forming a double top which is a bearish reversal pattern. This is in-line with HTF bearish pullback phase.
Remainder of analysis and bias remains the same as analysis dated 23 April 2025.
Price has now printed a bearish CHoCH according to my analysis yesterday.
Price is now trading within an established internal range.
Intraday Expectation:
Price to trade down to either discount of internal 50% EQ, or H4 demand zone before targeting weak internal high priced at 3,500.200.
Note:
The Federal Reserve’s sustained dovish stance, coupled with ongoing geopolitical uncertainties, is likely to prolong heightened volatility in the gold market. Given this elevated risk environment, traders should exercise caution and recalibrate risk management strategies to navigate potential price fluctuations effectively.
Additionally, gold pricing remains sensitive to broader macroeconomic developments, including policy decisions under President Trump. Shifts in geopolitical strategy and economic directives could further amplify uncertainty, contributing to market repricing dynamics.
H4 Chart:
M15 Analysis:
-> Swing: Bullish.
-> Internal: Bullish.
H4 Timeframe - Price has failed to target weak internal high, therefore, it would not be unrealistic if price printed a bearish iBOS.
The remainder of my analysis shall remain the same as analysis dated 13 June 2025, apart from target price.
As per my analysis dated 22 May 2025 whereby I mentioned price can be seen to be reacting at discount of 50% EQ on H4 timeframe, therefore, it is a viable alternative that price could potentially print a bullish iBOS on M15 timeframe despite internal structure being bearish.
Price has printed a bullish iBOS followed by a bearish CHoCH, which indicates, but does not confirm, bearish pullback phase initiation. I will however continue to monitor, with respect to depth of pullback.
Intraday Expectation:
Price to continue bearish, react at either M15 supply zone, or discount of 50% internal EQ before targeting weak internal high priced at 3,451.375.
Note:
Gold remains highly volatile amid the Federal Reserve's continued dovish stance, persistent and escalating geopolitical uncertainties. Traders should implement robust risk management strategies and remain vigilant, as price swings may become more pronounced in this elevated volatility environment.
Additionally, President Trump’s recent tariff announcements are expected to further amplify market turbulence, potentially triggering sharp price fluctuations and whipsaws.
M15 Chart:
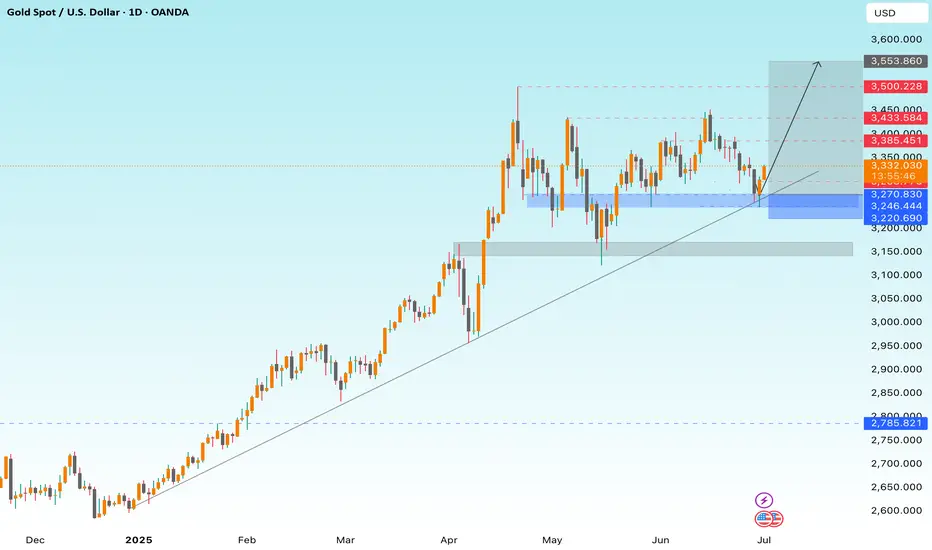
GOLD Bulls Winning ! 560 Pips and Still Aiming for +2500 Pips ! 📊 GOLD XAU/USD — Trendline Play in Action!
My plan from yesterday played out perfectly: price bounced from $3274 to $3334 — that’s +560 Pips banked so far! 💙
But this is only the start of the bigger move — I’m still targeting a 2500 Pips upside on this bullish leg.
✅ Technical Bias:
Price is respecting the main ascending trendline perfectly.
Demand zone at 3220 – 3270 held as expected.
Next resistances: 3385, 3433, 3500, then 3553 as extended target.
✅ Fundamental Bias:
The market is still pricing in more Fed rate cuts, which keeps the upside for gold alive.
📢 If you like clear setups that deliver:
Like 👍 | Comment 💬 | Share 📤 | Follow 🔔 me for real-time technical & fundamental updates!
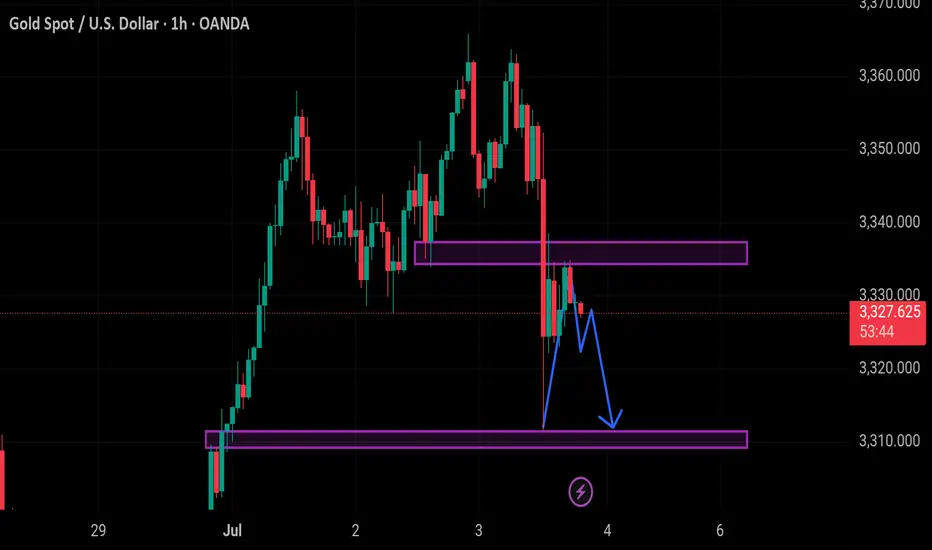
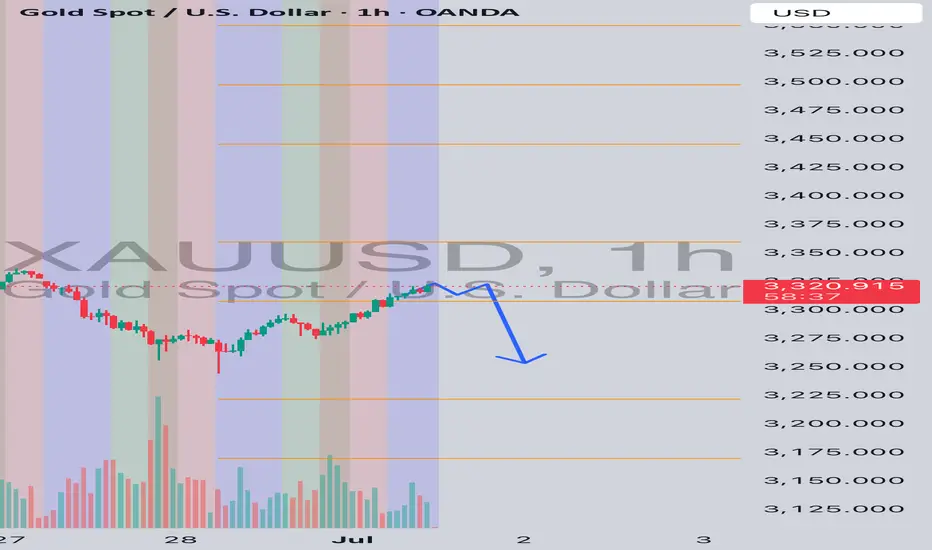
Shorting Gold I’m expecting gold to consolidate around 3313-3324 region before heading lower. Once again I trade base on my strategy. I might be wrong. So please do your own due diligence when trading.
Trade safe. Manage Risk.
A good strategy always comes first before psychology.
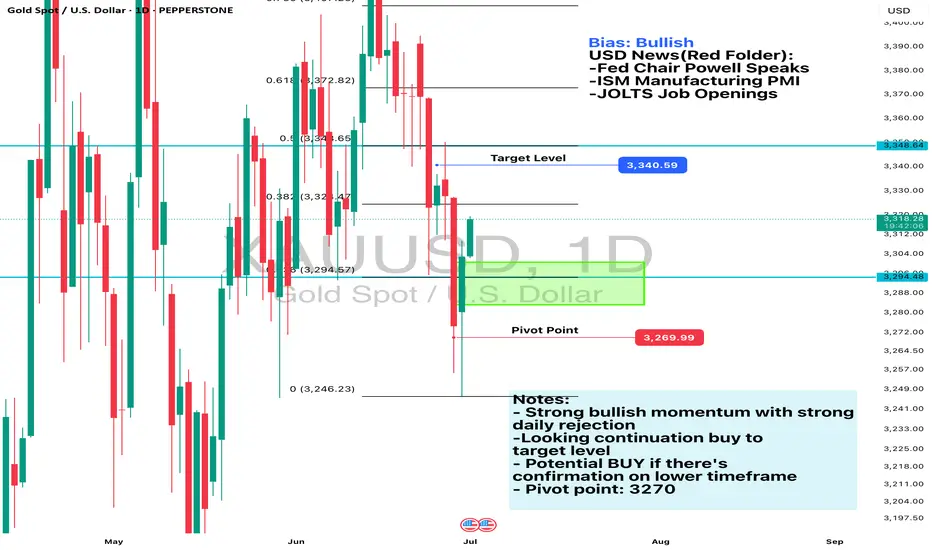
Daily Analysis- XAUUSD (Tuesday, 1st July 2024)Bias: Bullish
USD News(Red Folder):
-Fed Chair Powell Speaks
-ISM Manufacturing PMI
-JOLTS Job Openings
Notes:
- Strong bullish momentum with strong
daily rejection
-Looking continuation buy to
target level
- Potential BUY if there's
confirmation on lower timeframe
- Pivot point: 3270
Disclaimer:
This analysis is from a personal point of view, always conduct on your own research before making any trading decisions as the analysis do not guarantee complete accuracy.
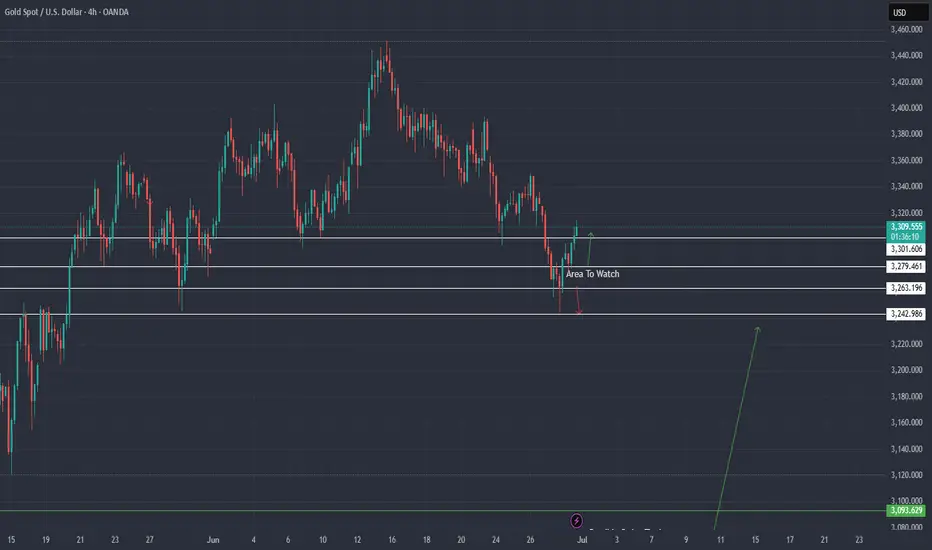
XAU / USD 4 Hour ChartHello traders. I just wanted to follow up on this chart. I have changed nothing since the last post. I just wanted to show the trade set up was on point. Big G gets a shout out. Be well and trade the trend. I find the first few days of the week gold carves out its potential paths both up and down. Wednesday, many times the weekly will be right in the middle of the moves from the previous few days. Not sure if that makes sense, but I just ripped a bongload of Gorilla Glue and I am not proof reading this or checking for typos.. my bad. Be well and trade the trend. Let's see how the overnight sessions play out. Thanks for checking out my chart.
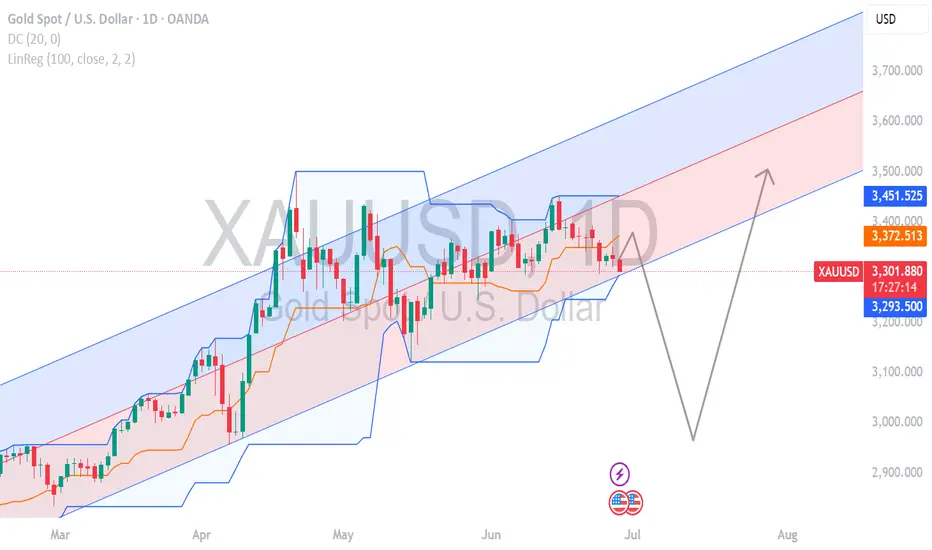
Gold Wave Analysis – 30 June 2025
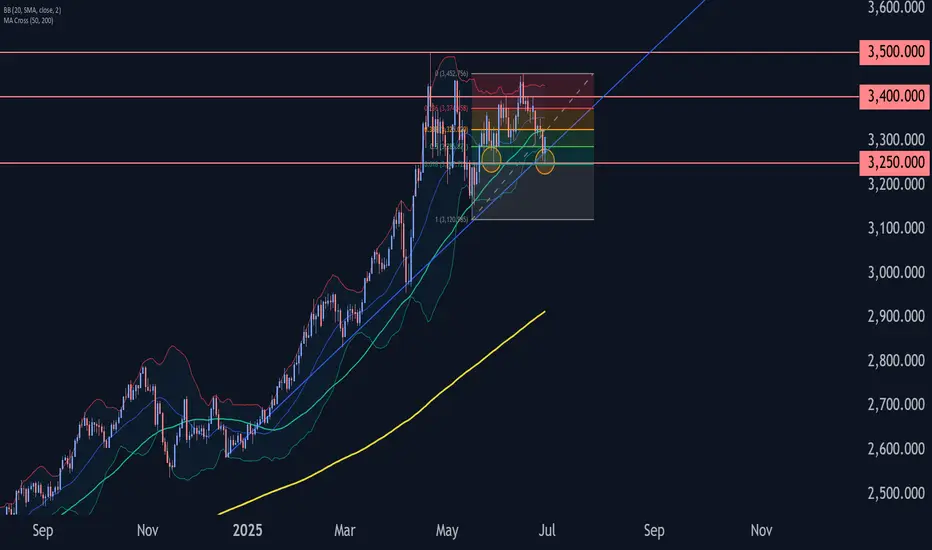
- Gold reversed from support level 3250.00
- Likely to rise to resistance level 3400.00
Gold recently reversed up from the support level 3250.00 (which stopped wave (b) at the end of May, as can be seen from the daily Gold chart below) intersecting with the lower daily Bollinger Band and the 50% Fibonacci correction of the upward impulse from May.
The support level 3250.00 was further strengthened by the upward-sloping support trendline from February.
Given the clear daily uptrend, Gold can be expected to rise to the next resistance level 3400.00, which stopped the previous short-term correction ii.
GOLD / XAUUSD TodayMy SSM Structure change to strong bearish
My view is on chart.
I expect move up a little bit but after this new low
XAU/USD 30 June 2025 Intraday AnalysisH4 Analysis:
-> Swing: Bullish.
-> Internal: Bullish.
You will note that price has targeted weak internal high on two separate occasions forming a double top which is a bearish reversal pattern. This is in-line with HTF bearish pullback phase.
Remainder of analysis and bias remains the same as analysis dated 23 April 2025.
Price has now printed a bearish CHoCH according to my analysis yesterday.
Price is now trading within an established internal range.
Intraday Expectation:
Price to trade down to either discount of internal 50% EQ, or H4 demand zone before targeting weak internal high priced at 3,500.200.
Note:
The Federal Reserve’s sustained dovish stance, coupled with ongoing geopolitical uncertainties, is likely to prolong heightened volatility in the gold market. Given this elevated risk environment, traders should exercise caution and recalibrate risk management strategies to navigate potential price fluctuations effectively.
Additionally, gold pricing remains sensitive to broader macroeconomic developments, including policy decisions under President Trump. Shifts in geopolitical strategy and economic directives could further amplify uncertainty, contributing to market repricing dynamics.
H4 Chart:
M15 Analysis:
-> Swing: Bullish.
-> Internal: Bullish.
On H4 TF price has been failing to target weak internal high, therefore, it would not be unrealistic if price printed a bearish iBOS.
The remainder of my analysis shall remain the same as analysis dated 13 June 2025, apart from target price.
As per my analysis dated 22 May 2025 whereby I mentioned price can be seen to be reacting at discount of 50% EQ on H4 timeframe, therefore, it is a viable alternative that price could potentially print a bullish iBOS on M15 timeframe despite internal structure being bearish.
Price has printed a bullish iBOS followed by a bearish CHoCH, which indicates, but does not confirm, bearish pullback phase initiation. I will however continue to monitor, with respect to depth of pullback.
Intraday Expectation:
Price to continue bearish, react at either M15 supply zone, or discount of 50% internal EQ before targeting weak internal high priced at 3,451.375.
Note:
Gold remains highly volatile amid the Federal Reserve's continued dovish stance, persistent and escalating geopolitical uncertainties. Traders should implement robust risk management strategies and remain vigilant, as price swings may become more pronounced in this elevated volatility environment.
Additionally, President Trump’s recent tariff announcements are expected to further amplify market turbulence, potentially triggering sharp price fluctuations and whipsaws.
M15 Chart:
Gold price bull-bear life and death line--3300Gold price bull-bear life and death line--3300
Gold rose in the Asian session today
Buy on dips and technical rebound:
Last Friday (June 28), gold fell 2%, hitting a low of $3247/ounce. Some investors believed that it was oversold in the short term and bought on dips during the Asian session.
Key support level of $3,270:
From a technical perspective, there is a concentrated area of institutional buying near $3,270, which will trigger a short-term rebound.
Near $3,300 is still a strong resistance range.
Although Powell maintains a hawkish stance, the market is still betting on a rate cut in September (with a probability of more than 90%), and the decline in the US dollar index supports gold.
As shown in Figure 4h:
The current fluctuation range of gold price: 3240-3300, with a fluctuation range of nearly 60 US dollars
Short selling strategy:
Sell: 3295-3300 range
Stop loss: 3305
Target: 3280-3270-3250
Buy 1: 3250 (conservative)
Buy 2: 3270 (stable)
Buy 3: 3280 (aggressive)
Stop loss: 3240
Target: 3300-3320+
It is recommended to pay attention to the long-short strength dividing line near 3300
Standing at 3300, the market will continue to rise this week
As long as the gold price is below 3300, take a high-altitude mentality
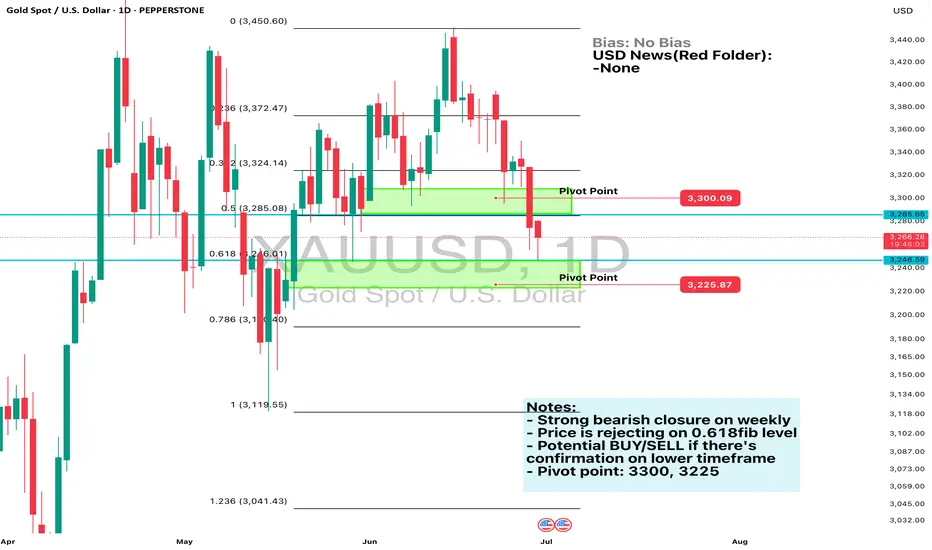
Daily Analysis- XAUUSD (Monday, 30th June 2024)Bias: No Bias
USD News(Red Folder):
-None
Notes:
- Strong bearish closure on weekly
- Price is rejecting on 0.618fib level
- Potential BUY/SELL if there's
confirmation on lower timeframe
- Pivot point: 3300, 3225
Disclaimer:
This analysis is from a personal point of view, always conduct on your own research before making any trading decisions as the analysis do not guarantee complete accuracy.
"Stealing Gold Profits: XAU/USD Long Setup (Risk-Reward Heist)"🔥 GOLD HEIST ALERT: XAU/USD Breakout Robbery Plan (Long Setup) 🔥
🌟 Hi! Hola! Ola! Bonjour! Hallo! Marhaba! 🌟
Attention, Money Makers & Market Robbers! 🤑💰💸✈️
Based on the 🔥Thief Trading Style🔥 (technical + fundamental analysis), we’re plotting a heist on XAU/USD (GOLD). Follow this master plan for a bullish escape near the high-risk ATR zone. Beware—overbought signals, consolidation traps, and bearish robbers lurk! Take profits fast and treat yourself—you’ve earned it! 🏆💸
📈 ENTRY: THE HEIST BEGINS!
Wait for Resistance Breakout (3400.00) → Then strike!
Buy Stop Orders: Place above Moving Average.
Buy Limit Orders: Use 15M/30M pullbacks (swing lows/highs).
Pro Tip: Set a chart ALERT to catch the breakout live!
🛑 STOP LOSS: DON’T GET CAUGHT!
For Buy Stop Orders: Never set SL before breakout!
Thief’s SL Spot: Recent swing low (4H timeframe).
Adjust SL based on your risk, lot size, and order count.
Rebel Traders: Place SL wherever—but you’ve been warned! 🔥
🏴☠️ TARGET: 3480.00
Scalpers: Long-only! Use trailing SL to lock profits.
Swing Traders: Join the robbery crew for bigger gains.
📊 MARKET CONTEXT:
XAU/USD is neutral but primed for bullish moves 🐂. Watch:
Fundamentals (COT Reports, GeoPolitics, News).
Intermarket Trends & Sentiment.
Positioning & Future Targets (Check our bio0 for analysis linkss!).
⚠️ TRADING ALERTS:
News Releases = High Volatility!
Avoid new trades during major news.
Use Trailing SL to protect open positions.
💥 SUPPORT THE HEIST!
Hit the Boost Button 💖→ Strengthen our robbery team!
Profit daily with the Thief Trading Style. 🏆💪🚀
Stay tuned for the next heist—more loot awaits! 🤑🐱👤🎉

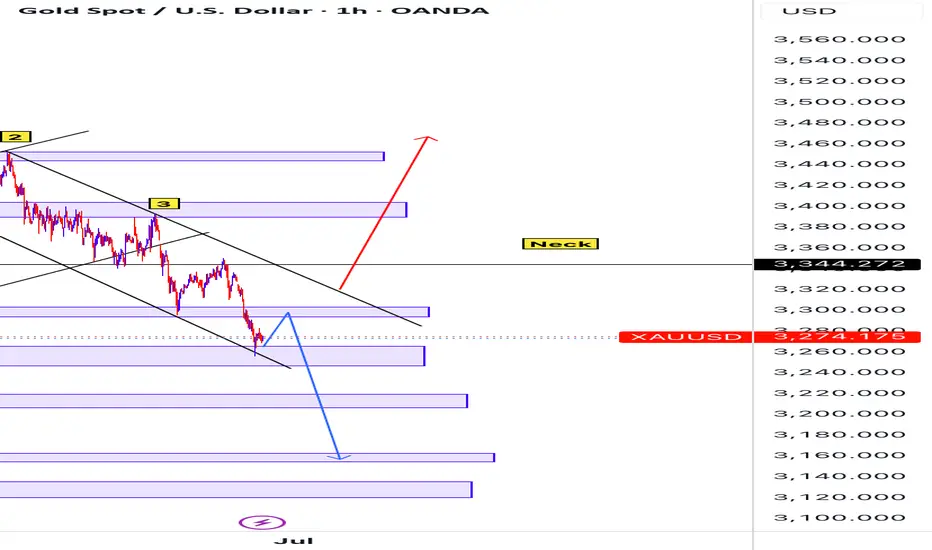
This is my trend line manipulation strategy+Support & ResistanceGOLD ANALYSIS: On this chart the numbering shows a head and shoulder partten which has broke the neckline showing a selling pressure. So automatically price is in down trend but a break of the new trend above will marked with the red arrow will leads to the upside prevail.
Gold Trade Plan 06/06/2025Dear Traders,
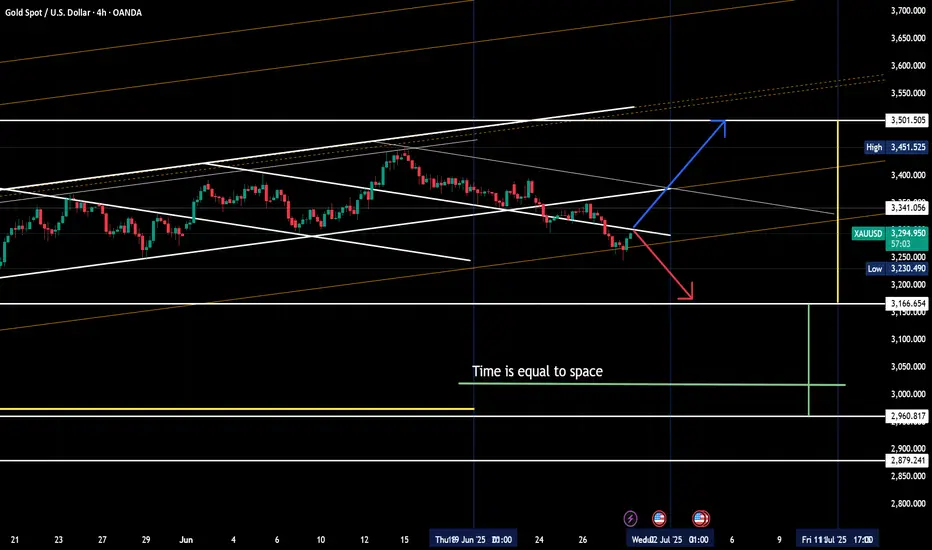
Today, the first ascending channel will likely be broken, and price may enter the lower channel. I've marked the potential buy zone on the chart. Once the upper channel breaks decisively, I expect the price to reach the midline of the lower channel, with possible reactions from both the midline and the bottom of the channel."
Regards,
Alireza!

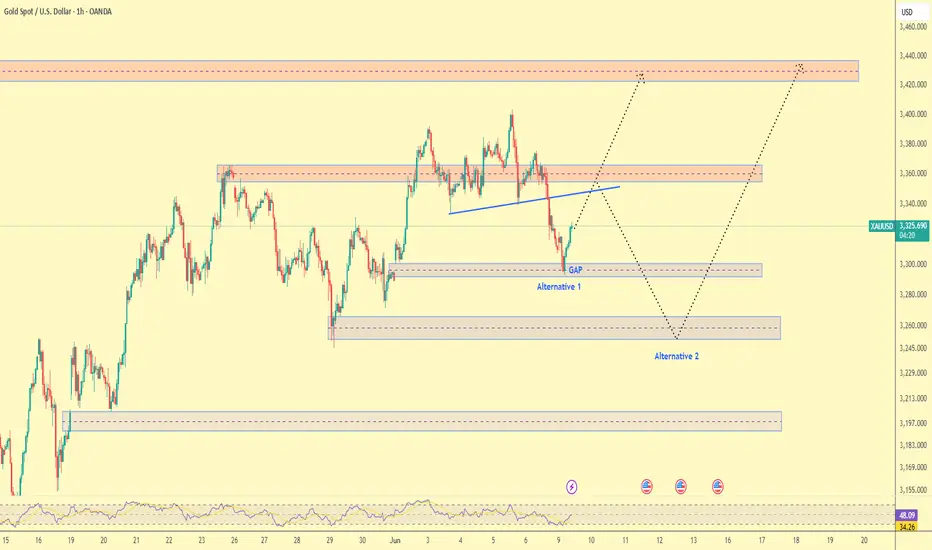
Gold Trade Plan 09/06/2025Dear Traders.
📊 XAUUSD Technical Analysis | 1H Timeframe | June 9, 2025
Price has recently broken below the ascending trendline and filled a nearby gap, now retracing back toward the broken structure zone. Two key scenarios are in play:
🔹 Alternative 1: A rejection from the broken resistance area could trigger a bearish continuation toward the demand zone around $3,260–$3,240.
🔹 Alternative 2: If sellers fail to defend this level, price may push higher to test the $3,420–$3,440 supply zone.
✅ Key Levels to Watch:
Resistance: $3,360 and $3,420–$3,440
Support: $3,260 and $3,190
📉 The RSI is hovering in the neutral-to-oversold range, signaling indecision in momentum.
📌 Summary:
Traders should monitor how price reacts to the current resistance zone. A clear rejection could validate the downside scenario, while a breakout may open the door for a bullish continuation.
XAUUSD GOLD buy holdXAUUSD GOLD BUY NOW – LONG TRADE SETUP ACTIVE 🟡📈
Gold has pulled back to a key support area and is now showing signs of strength at the current price of $3301.
This zone is acting as a strong base for buyers, signaling a potential bullish continuation in the coming sessions.
We are entering a LONG position with a favorable risk-to-reward ratio, supported by market structure and technical confirmation.
🔹 Current Price: $3301
🎯 Target Levels: First target at $3350, extended target at $3400+
🛑 Stop Loss: Recommended below $3275 to protect capital
As long as price holds above the support zone, bulls remain in control.
Patience, discipline, and proper risk management are key — let the trend do the work.
Gold is poised for upside — time to ride the wave!
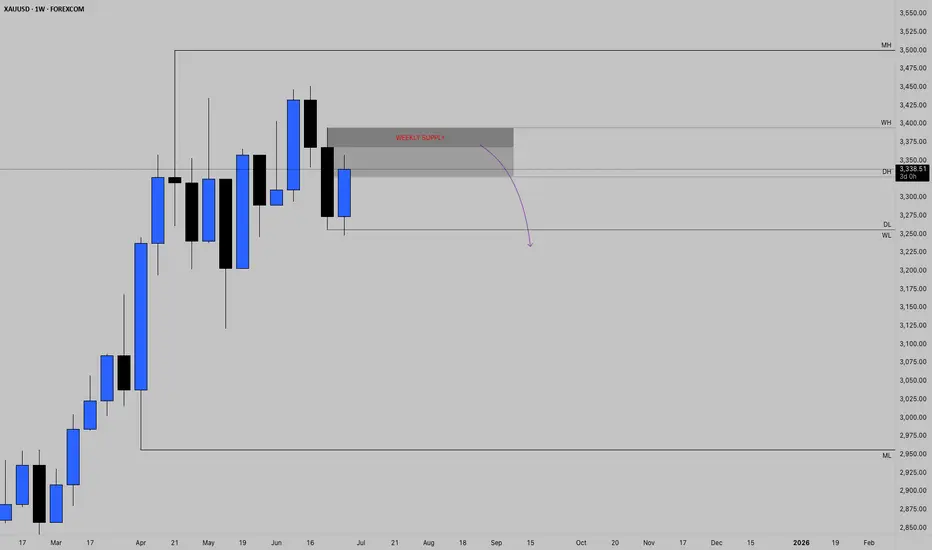
WEEKLY SUPPLY MAY HOLDAfter price closed strong bearing the previous week, we have witnessed a massive rally back up into weekly highs. Even after 2 days of rally, this strong bullish pressure doesn't seem to be over looking at today's strong daily closure. We might just see price extend a little further into weekly highs as shown and now based on strong confirmations, a plunge back down into April's lows.
GOLD BIASExpecting Gold to touch the second supply zone before moving down
follow for daily bias on gold