Trading balanceTrading balance The price of the asset has rebounded from the balance zone. With the prospect of growth into the resistance zone.
XAUUSD.F trade ideas
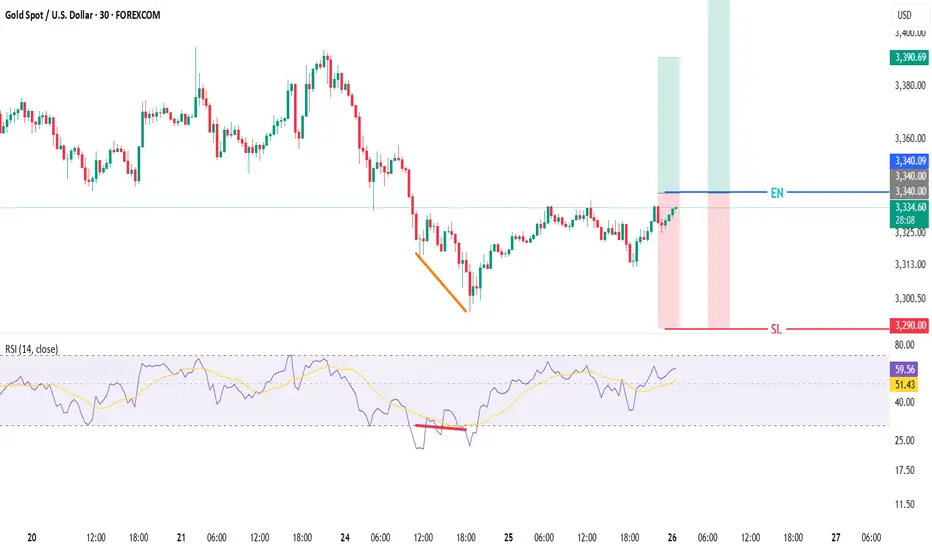
XAUUSD GOLD📈 GOLD (XAU/USD)
📊 Timeframes:
⏱️ 30-Min & 1-Hour
🟢 Long Trade Plan
🔍 Analysis Highlights:
✨ Bullish Divergence spotted
🚀 Breakout Trade
🎯 Trade Details:
🛑 SL: Marked on chart 🔴
✅ TP1: Mentioned on chart 🥇
🏁 TP2: Mentioned on chart 🥈
📌 Chart levels clearly labeled
📬 For any queries regarding chart: comment in message section
💡 Trade smart, manage risk! 📉📈
#Gold #XAUUSD #BreakoutTrade #LongSetup #BullishDivergence #TradingView #TradePlan
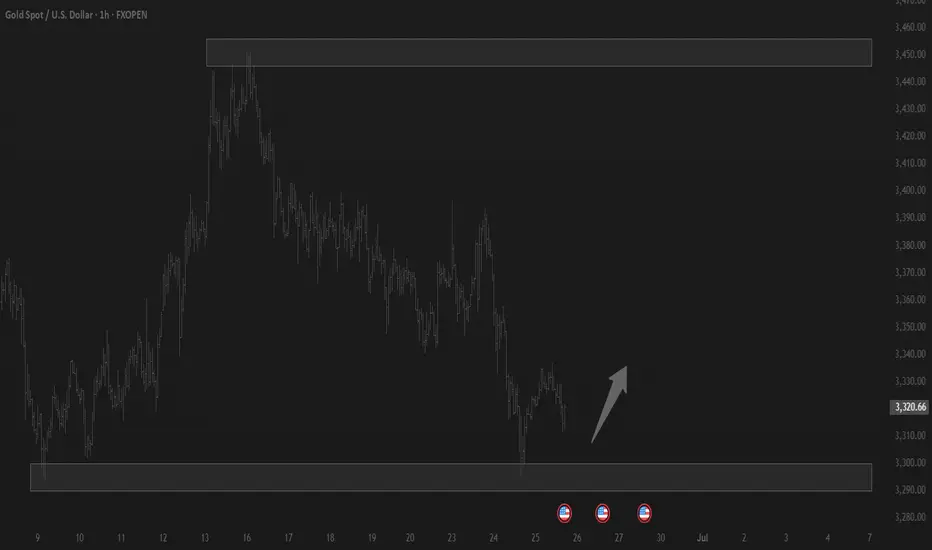
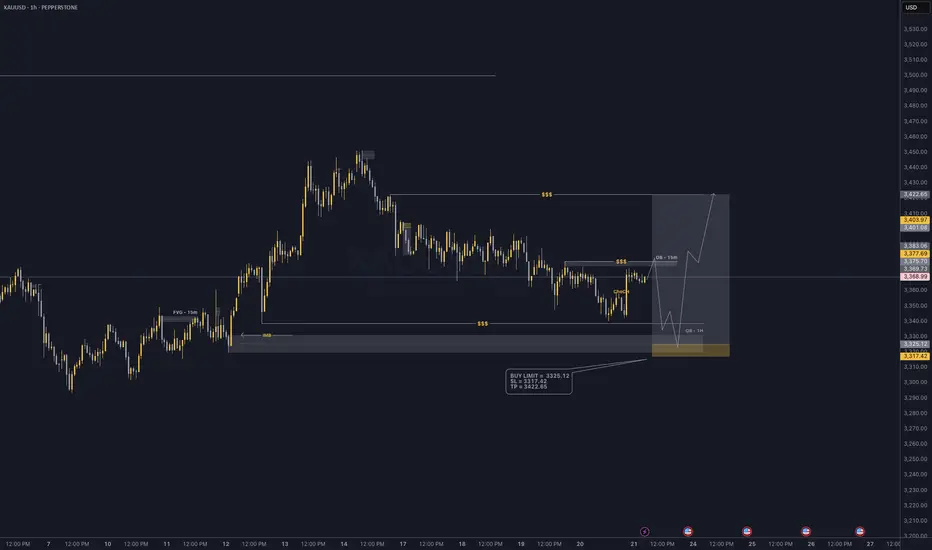
Gold - Bull has taken back controlLast Friday , bullish momentum started to kick in after a long bearish week.
Leaving liquidity on the sell side with FVG and OB on the Sell Side
I am anticipating the price will sweep the BSL first and then to the SSL and collect order from the 1H OB.
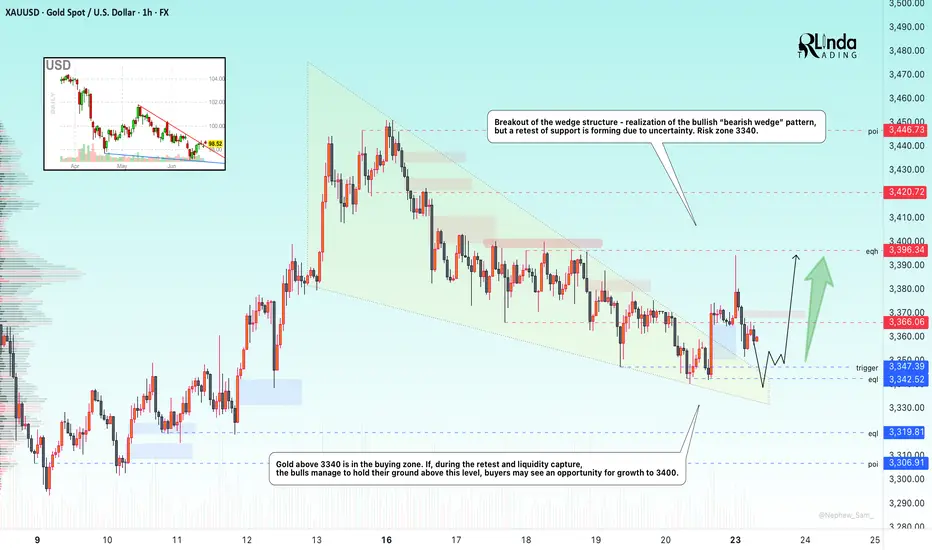
GOLD → Risk zone 3340. Sell-off after rallyFX:XAUUSD , after breaking out of its accumulation phase, rallied towards the 3400 zone of interest, but failed to reach liquidity and reversed, selling off its gains due to economic uncertainty.
In my opinion, the market is unexpectedly subdued and has reacted very weakly to geopolitical problems in the Middle East. The market has digested the news of US airstrikes on Iranian nuclear facilities and is awaiting PMI data from the US and the eurozone, Fed statements, US GDP and other macroeconomic data. The uncertainty factor has done its job... Participants fear further escalation of the conflict, but so far Iran has refrained from taking drastic steps, which has reduced demand for gold as a safe haven asset. Geopolitics and macro statistics remain in focus.
Technically, gold is trading above 3340 (in the buy zone). A retest of the liquidity zone is possible, and if buyers keep the market above 3340-3350, the price may continue to rise.
Support levels: 3347, 3342, 3320
Resistance levels: 3366, 3396
On D1, the key level is the 3340-3347 area. At the moment, we are seeing a sell-off and a move to retest support. Accordingly, a false breakdown and price holding above 3340, followed by a change in character and a breakdown of the bullish structure, will hint at growth. But if the reaction at 3340 is weak and the market continues to storm this support, then in this case, the metal could drop to 3300
Best regards, R. Linda!
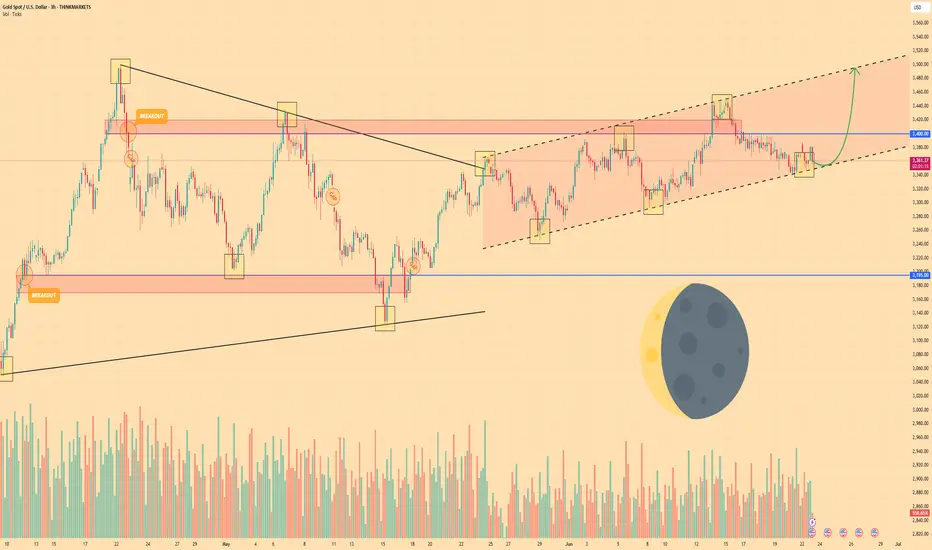
GOLD - Price can rise in channel to $3495 resistance lineHi guys, this is my overview for XAUUSD, feel free to check it and write your feedback in comments👊
After price started to trades inside triangle, it made an impulse up, breaking two levels, after which turned around.
Price dropped to $3195 level, breaking resistance level, and made a first gap, after which rose to resistance line.
Then Gold in a short time declined to support line, making a two gaps again and then bounced up from support line.
Gold exited from triangle and continued to move up inside rising channel, where it first made a correction.
In channel, price grew higher than $3400 level, but recently turned around and fell to support line.
Now, I expect that Gold can bounce from this line and rise to $3495 resistance line, breaking resistance level.
If this post is useful to you, you can support me with like/boost and advice in comments❤️
Disclaimer: As part of ThinkMarkets’ Influencer Program, I am sponsored to share and publish their charts in my analysis.
XAU / USD 4 Hour ChartHello traders. Although I did not take the trade, my last analysis lined up perfectly for the scalp Sell trade. Not being boastful, just showing my skill set. Big G gets a shout out. Happy Tuesday. Be well and trade the trend.
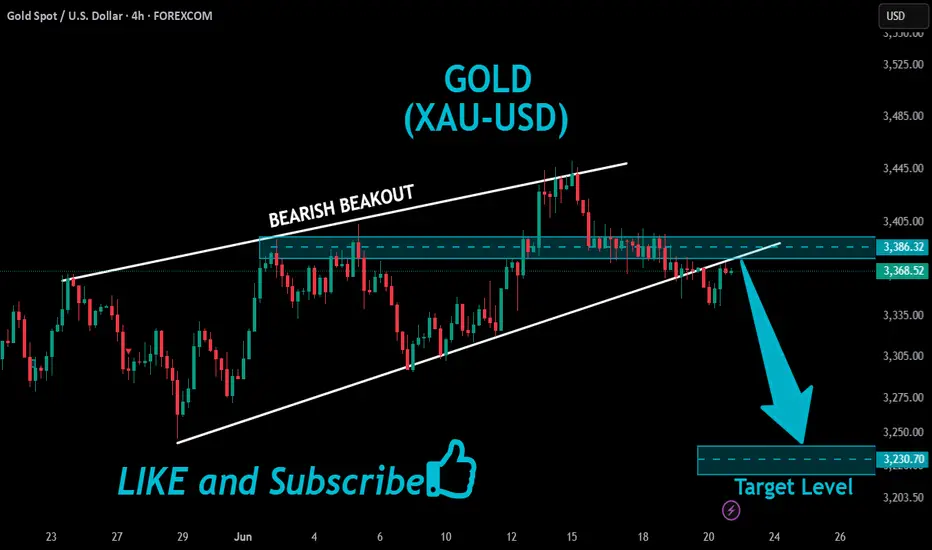
GOLD Bearish Breakout!
HI,Traders !
#GOLD is trading in a
UPtrend and Broke our of the bearish
Wedge pattern then made
A retest and is going down
Now so we are bearish
Biased and we will be
Expecting a further move down !
Comment and subscribe to help us grow !
Gold 1H IdeaGold still not starting bullish trend. More down continues . Hope it will reach next week. Good luck.

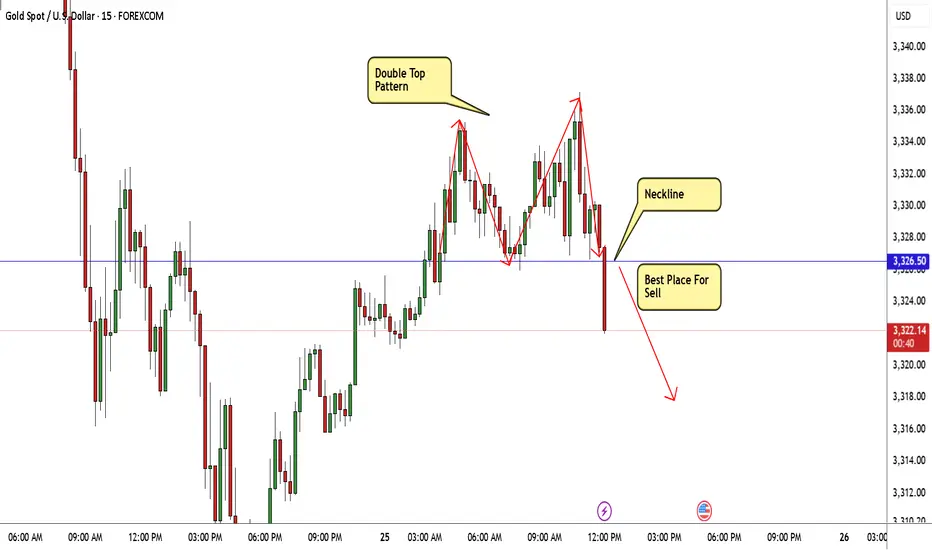
GOLD Made Double Top Reversal Pattern , Ready For Sell ?Here is My 15 Mins Chart On Gold and we have a very good reversal Pattern , double Top , if we have a 15 mins closure below neckline 3326.00 we can enter a sell trade and targeting at least 100 pips as scalping , we can enter direct if you are aggressive trader or if you not you can wait the price to retest neckline and then enter .
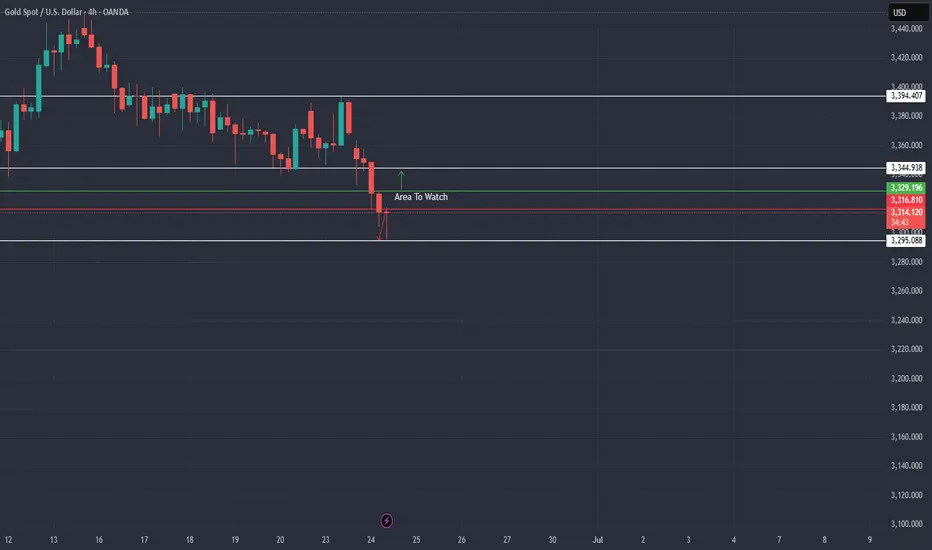
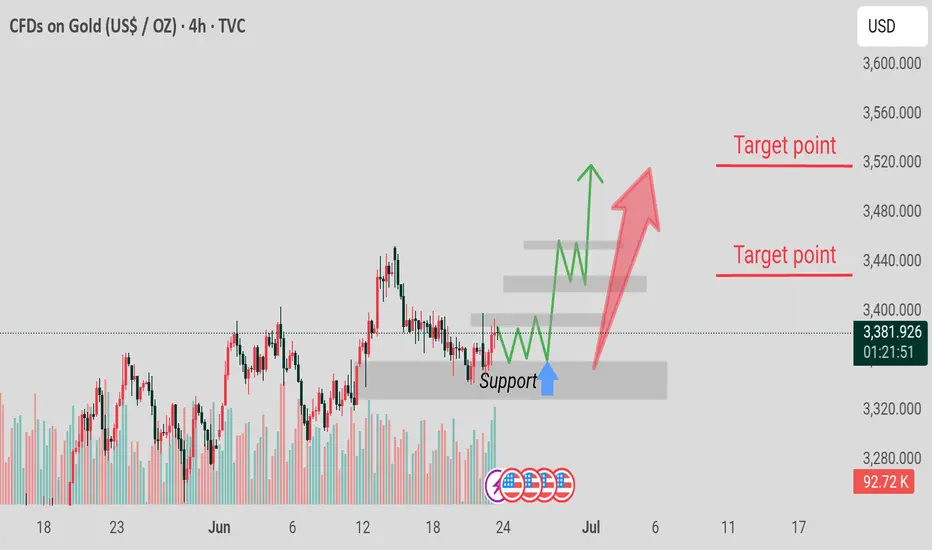
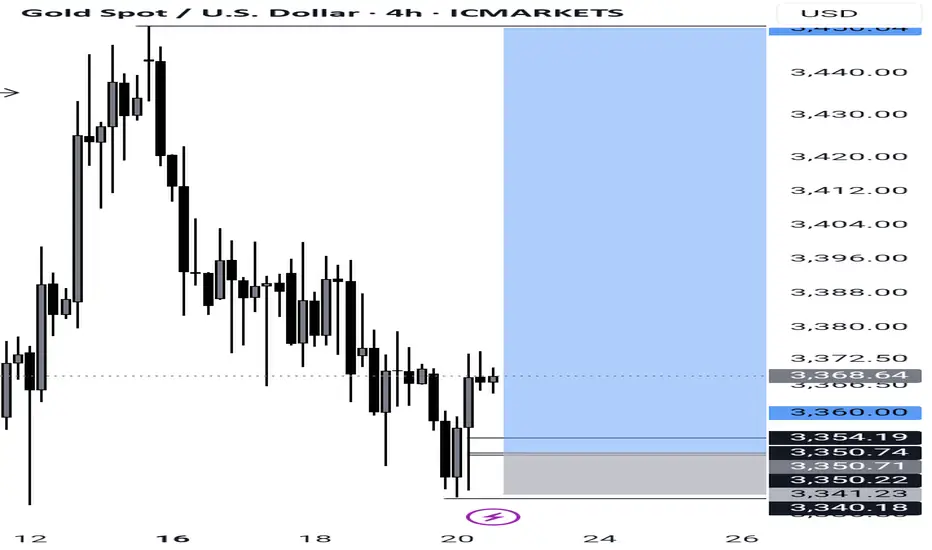
XAUUSD h4 next move opportunity Support zone around 3,350–3,370 USD.
Price expected to bounce upward from support.
Two bullish target points: ~3,450 and ~3,550.
Clean higher high/lows structure forecasted
GOLD ANALYSIS: A Bullish Breakout coming XAU-USD🔍 Key Technical Levels Decoded
🛡️ FORTRESS SUPPORT ZONE: $3,245 - $3,295
🛡️ Psychological level at: $3,250
1. 🎯 TARGET ZONES:
Immediate Target: $3,360 (4H FVG - Fair Value Gap)
Primary Target: $3,320 - 3,340
2. 🎭 The Liquidity Grab
The recent dip was a masterclass in market mechanics:
Weak longs were flushed out at $3,293
mean Smart money accumulated at discount prices
_______________________________
⚠️ RISK MANAGEMENT 🚨 DISCLAIMER ⚠️ DYOR

GOLD - Its breakout? What's next??#GOLD... market broke our resistance area that is 3338 around
So keep close now and sustain above means a bounce expected.
Good luck
Trade wisely
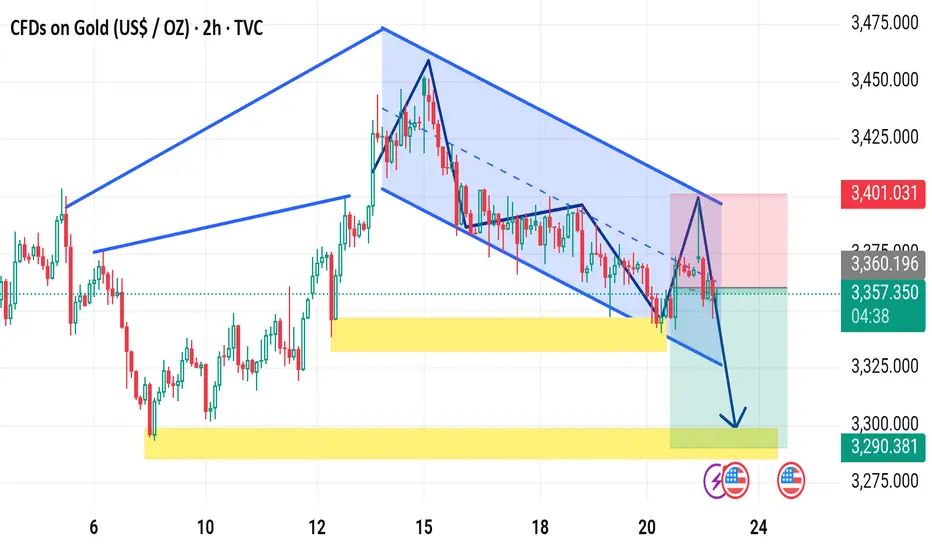
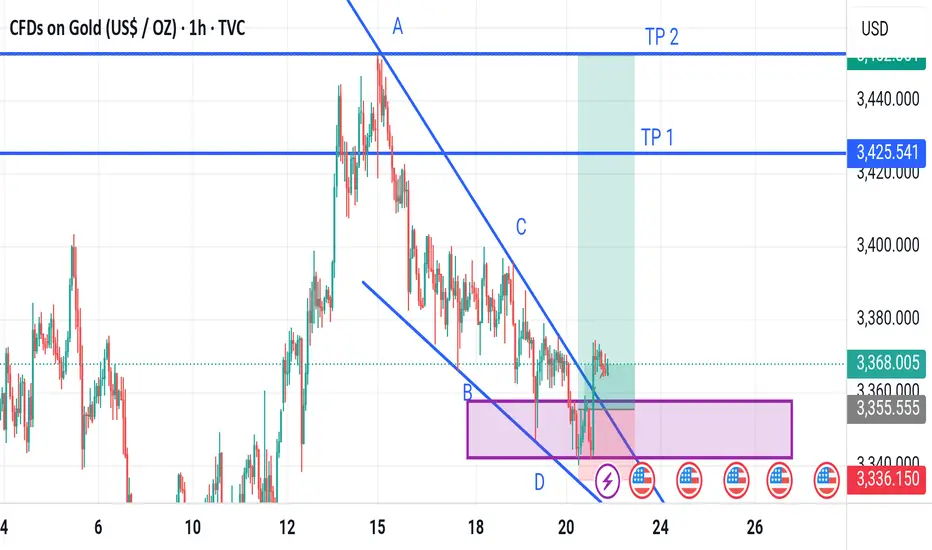
Xauusd market update The chart you've shared is a 2-hour price chart for CFDs on Gold (US$/OZ) and presents a bearish setup. Here's a detailed breakdown of the analysis:
---
📉 Pattern Overview:
The price is currently moving within a descending channel (highlighted in blue).
A bearish flag or descending parallel channel is clearly visible, indicating continuation to the downside.
There is a clear lower high and lower low structure, reinforcing the bearish sentiment.
---
⚠️ Key Zones:
Yellow zones mark key support levels.
First support zone around 3,320 (minor support).
Second, stronger support zone around 3,290.
The upper red box (near 3,401) indicates a stop-loss region.
The green box shows a take-profit target area, aligned with the support.
---
📊 Trade Setup Indicated:
Entry: Around current price (~3,357).
Stop-loss: ~3,401 (above the recent high).
Take-profit: ~3,290 zone (support zone below).
Risk-to-reward ratio (R:R): Favorable, likely around 1:2 or more.
---
🔔 Fundamental Overlay:
Icons at the bottom (flags and lightning bolt) show upcoming U.S. economic events, which could add volatility and may impact gold price action — something to watch closely before entering.
---
✅ Summary:
This is a bearish trade setup expecting a breakdown from the channel and a move toward the 3,290 support. It’s a technically sound setup assuming no major reversal catalyst from the U.S. economic events shown.
Would you like an updated version with live prices or to run a backtest on this pattern?
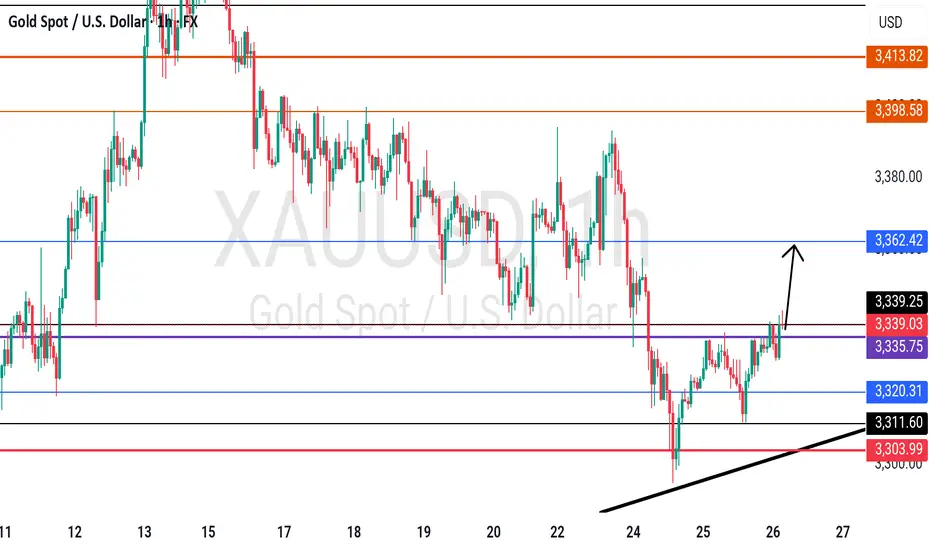
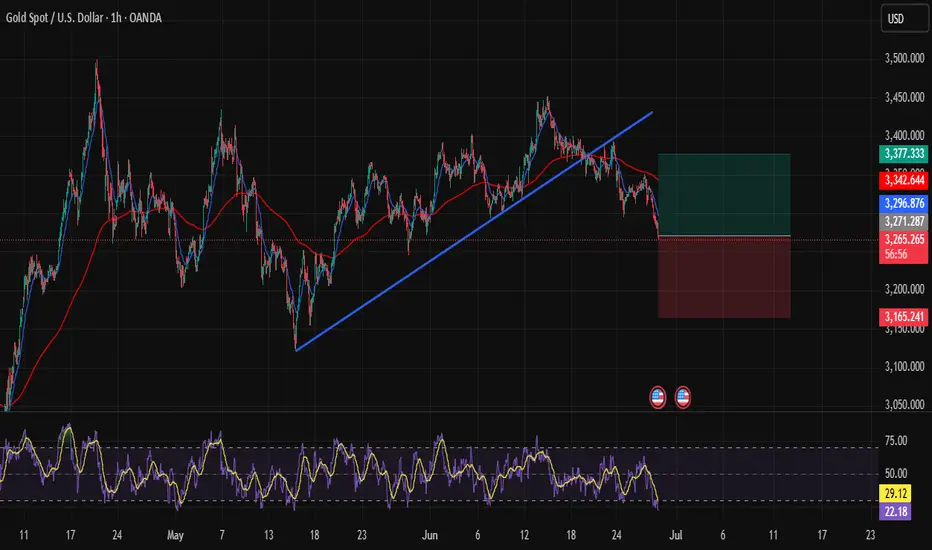
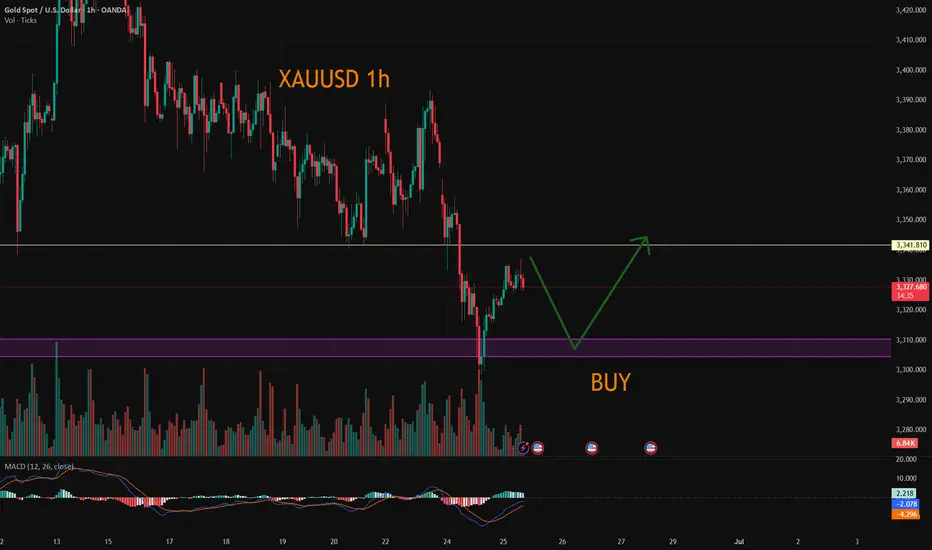
Catching the Perfect Rebound on XAUUSD!Hi traders! , Currently analyzing GOLD (XAUUSD) on the 1H timeframe.
Price has dropped aggressively but is now reacting strongly from a key support zone around 3,271.00, where buyers are stepping in. This area has previously shown significant bullish reactions.
I'm now buying from 3,271.00, expecting a bullish correction towards my target.
Take Profit: 3,377.00
Stop Loss: 3,165.00
RSI is in oversold, indicating potential exhaustion of sellers.
Price may have created a fake breakout below the trendline, trapping liquidity before bouncing back.
Currently managing the trade, watching how price develops around this key area.
Disclaimer : This is not financial advice. This is my personal analysis shared for educational purposes only.
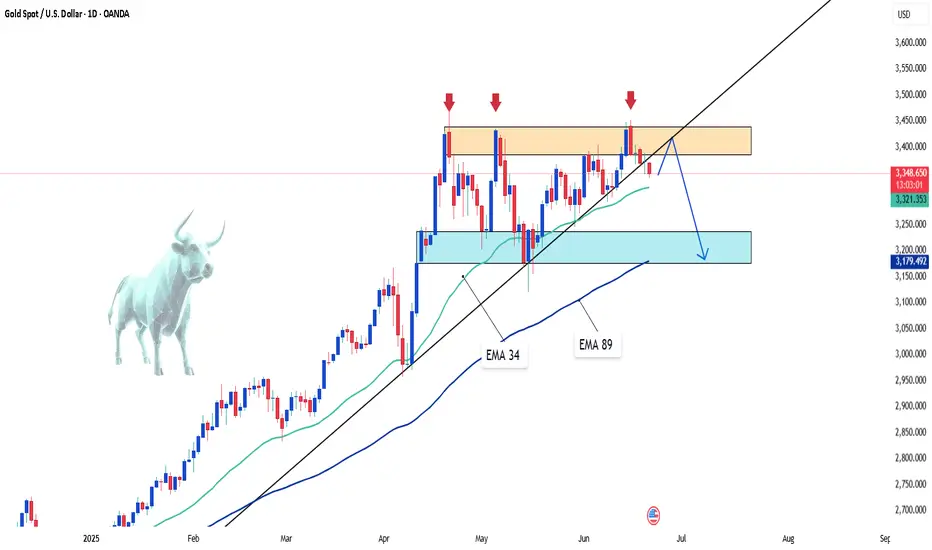
XAUUSD Update 4th week of June 2025, WORSE CASE PlanIn this BIG ZONE range, if there's a continuation for a correction movement, the target could be 3000's area, 3020 most likely the last support.
This is a worse case plan as this year we are not found a big correction yet.
A major trend still bullish, but a big correction also needed and now it's the middle of the year.
Have a good luck !
Gold Slumps Sharply – Has the Rate-Cut Hope Faded?Gold prices are under intense selling pressure after the Bank of England, the Swiss National Bank, and the Federal Reserve all decided to keep interest rates elevated. This unified stance underscores persistent inflation concerns, driving up the opportunity cost of holding non-yielding assets like gold. As a result, investors rushed to take profits, sending XAUUSD down over 200 pips in just one session.
Adding fuel to the fire, the Fed’s latest monetary policy report to Congress warned that inflation could rise to 3% by year-end, higher than previous projections. Moreover, the Fed trimmed expectations for rate cuts in 2025 and beyond, signaling a longer road to policy easing.
🔎 What does this mean for gold's short-term outlook?
With high rates here to stay and the Fed's cautious stance, gold remains vulnerable to further downside in the near term. However, if upcoming U.S. economic data shows signs of significant weakness, gold may regain favor as a safe-haven asset.
At the time of writing, XAUUSD is trading around $3,347, a critical zone that may determine whether the current drop continues or finds a bottom.
Do you believe this dip will deepen—or is it a golden opportunity to buy the pullback? Share your thoughts below!
XAUUSDExpecting price to open and decline a bit to then buy possibly for the rest of the week. Looking for Bulls to take over for as long as price respects the lows below after Monday headings candle formation the direction might be validated. If not right after Mondays open and low. If not then we might expect the opposite direction.
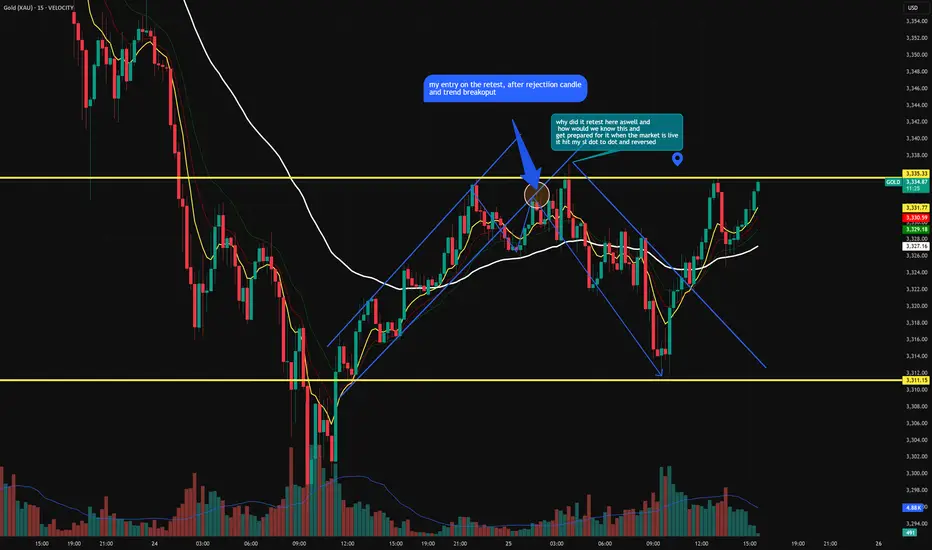
gold breakout and retest 1st retest failed after breakout and tried second retest. and it passed but hunted my stoploss.and then continued downward as planned
GOLD BUYWith the escalation of war in the middle east and the current U.S.A involvement, Gold is expected to sky rocket
Still bearish!If the short-term bull lifeline 3330 is lost, the trend will be bearish again. The first pressure point above is 3350-the secondary top 3345, and then the 3332-35 area. If the price bulls regain 3335 again, then the operation should be carried out in the range of 3350-3310. It is not recommended to enter the market at the halfway point because it is easy to be washed out. If the daily K line closes below 3340, then 3332-35 is the best position at present. At present, the price is bearish below 40, and it can rely on 3332-31 to continue to be bearish. The target is 3310 and 3924.
XAUUSD:Today's trading strategy
On Tuesday, the news that Trump announced a ceasefire between Iran and Israel dampened the risk aversion sentiment. Subsequently, the news that expectations of interest rate cuts had slowed down led to a further decline in gold prices. During the trading session, it once fell below the 3,300 mark. After the impact of the news weakened, it eventually rebounded to around 3,323, approaching the position where we first entered the market yesterday. Currently, there is no logic in the market. From a technical perspective, The resistance level above is at 3340-45, and the support level below is at 3305-10. We can conduct transactions around this range
Trading strategy:
SELL@3340-45
TP:3310-04
BUY@3305-10
TP:3335-40
More detailed strategies and trading will be notified here ↗↗↗
Keep updated, come to "get" ↗↗↗
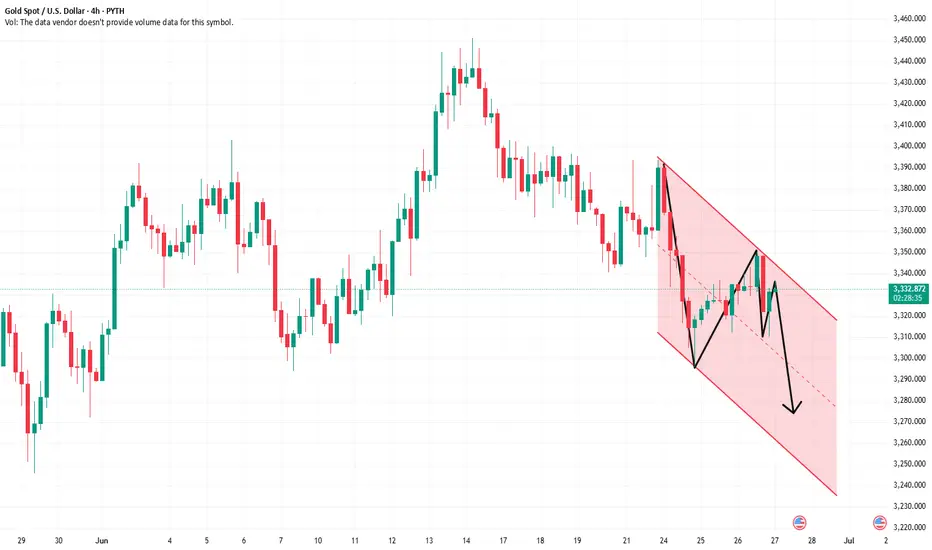
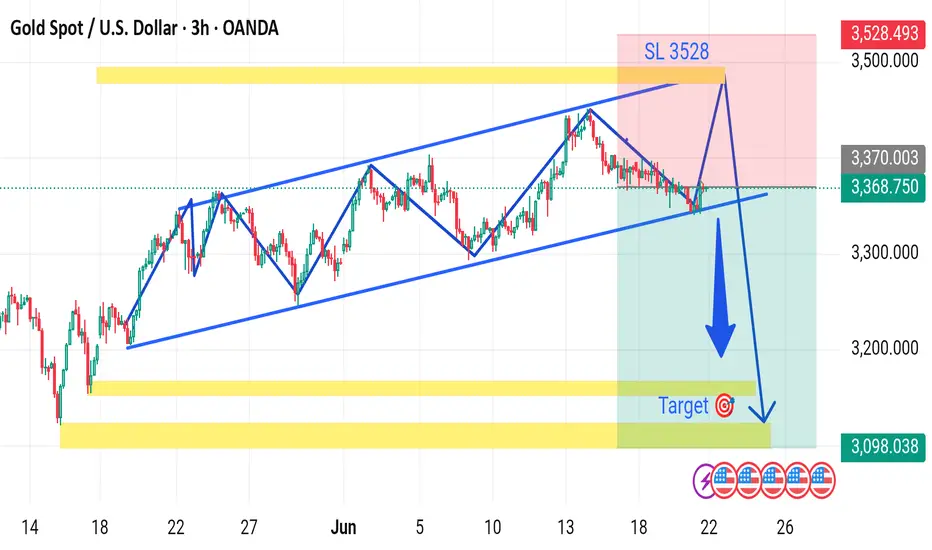
XAUUSD NEXT WEEK UPDATE The chart you provided is a technical analysis of Gold Spot (XAU/USD) on a 3-hour timeframe, showing a bearish setup with the following key features:
---
🔍 Chart Analysis Summary:
Price Channel:
The price has been moving within an ascending channel (marked by two blue lines) but is now testing the lower boundary of this channel.
Breakout Direction:
A bearish breakout is projected, indicated by the large blue downward arrow. This suggests a possible trend reversal from bullish to bearish.
Entry & Target:
Current Price: ~3368.75
Target Price: ~3098.03
This matches the previous demand/support zone (yellow horizontal band near the bottom).
Stop Loss (SL):
Placed at 3528, just above recent highs to manage risk.
Risk Zone:
The red area shows the risk if price moves against the trade (stop loss zone).
The green area shows the reward zone (target profit area), highlighting a favorable risk/reward ratio.
Event Indicators:
Several economic event icons are placed near the projected move date (~June 24–26), suggesting that fundamental catalysts may support this move (e.g., FOMC, CPI, etc.).
---
✅ Bearish Setup Summary:
Setup Type: Bearish channel breakout
Sell Entry: On break and close below channel support (~3368)
Stop Loss: 3528
Take Profit: 3098
R/R Ratio: Favorable
Would you like a written trade plan or a summary in table format?
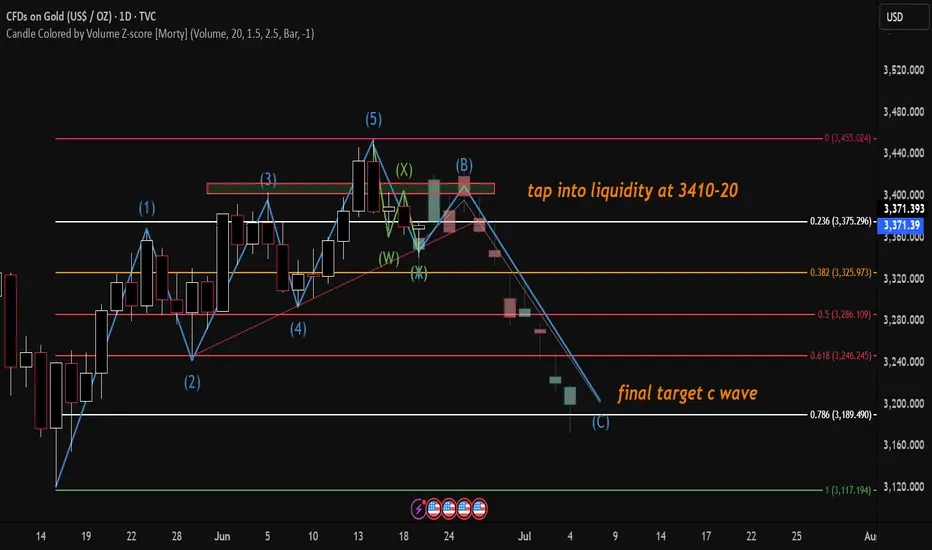
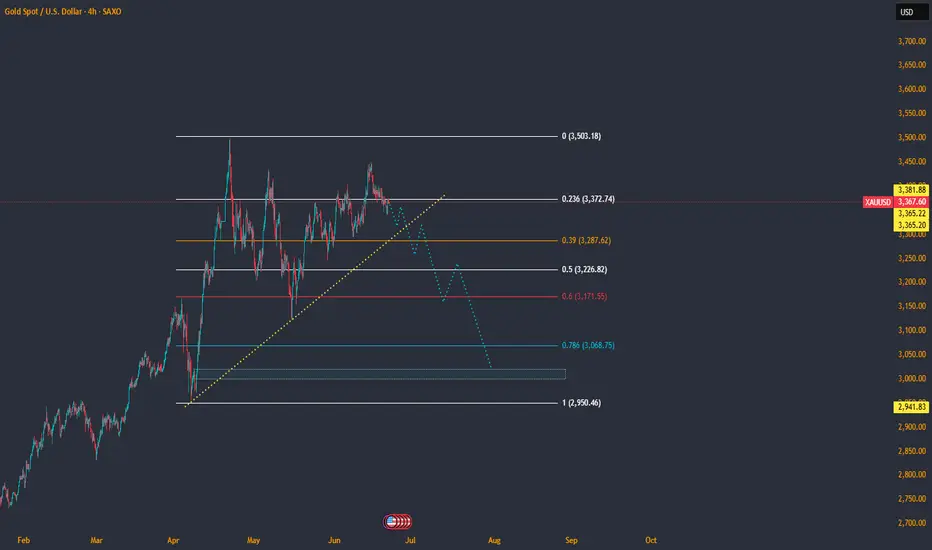
Bearish Elliot Idea on daily timeframeHere is a elliot wave count bearish Idea on the 1 day timeframe, retract to tap liquidity between 410-420 as a B then break daily trend line and continue down to 0.618/0.786 fib levels