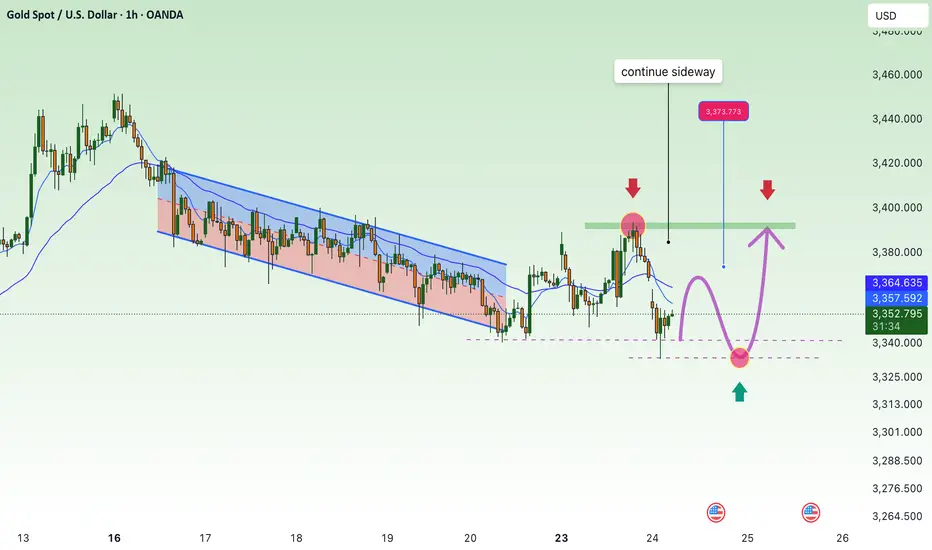
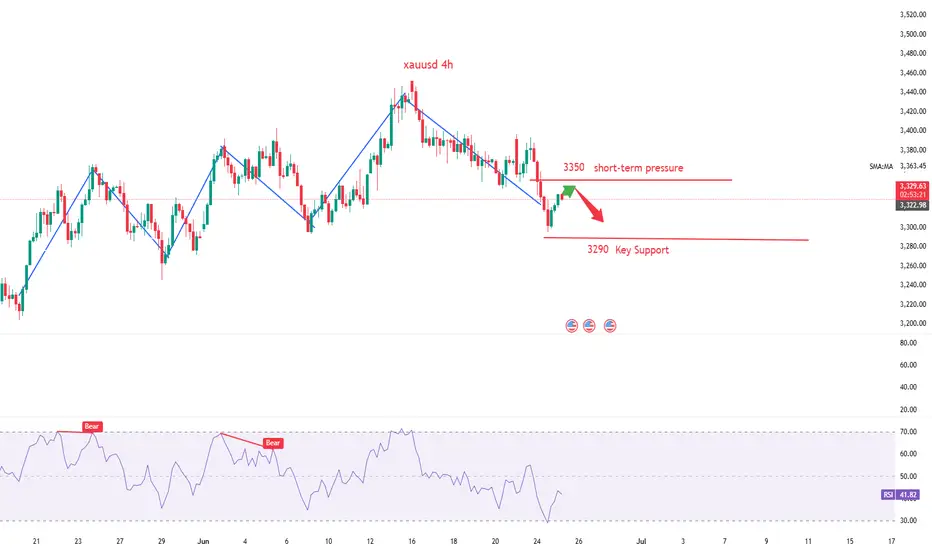
GOLD continue sideway , SELL 3393⭐️GOLDEN INFORMATION:
Gold prices remain well-supported during the North American session following breaking news that Iran has launched retaliatory strikes on US military bases in Qatar. The escalation comes in response to Washington’s weekend assault on Iranian nuclear facilities. As geopolitical tensions in the Middle East dominate headlines, investors have largely sidelined US economic data. At the time of writing, XAU/USD is trading at $3,385, up 0.39%.
Macroeconomic indicators have taken a backseat as heightened conflict drives market sentiment. Citing Israeli media, Al Arabiya reported that Iran targeted US bases in Qatar, Kuwait, and Iraq with missile strikes. In a further escalation, Tehran approved the closure of the strategic Strait of Hormuz and launched additional missiles at Israeli targets—amplifying safe-haven demand for gold.
⭐️Personal comments NOVA:
Gold prices reacted to a decrease in positive news about peace in the Middle East, continuing to accumulate.
⭐️SET UP GOLD PRICE:
🔥SELL GOLD zone: 3392- 3394 SL 3399
TP1: $3382
TP2: $3370
TP3: $3360
🔥BUY GOLD zone: $3319-$3317 SL $3312
TP1: $3327
TP2: $3338
TP3: $3349
⭐️Technical analysis:
Based on technical indicators EMA 34, EMA89 and support resistance areas to set up a reasonable BUY order.
⭐️NOTE:
Note: Nova wishes traders to manage their capital well
- take the number of lots that match your capital
- Takeprofit equal to 4-6% of capital account
- Stoplose equal to 2-3% of capital account
XAUUSD.F trade ideas
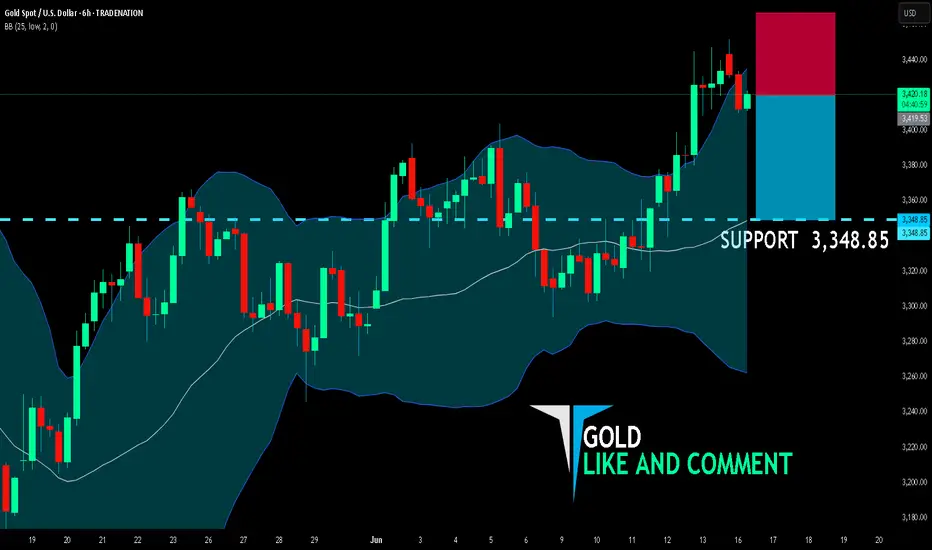
GOLD BEARS WILL DOMINATE THE MARKET|SHORT
GOLD SIGNAL
Trade Direction: short
Entry Level: 3,419.53
Target Level: 3,348.85
Stop Loss: 3,466.65
RISK PROFILE
Risk level: medium
Suggested risk: 1%
Timeframe: 6h
Disclosure: I am part of Trade Nation's Influencer program and receive a monthly fee for using their TradingView charts in my analysis.
✅LIKE AND COMMENT MY IDEAS✅
Gold 1H Intra-Day Chart 26.06.2025Option 1: Gold rejects from $3,346 & drops towards $3,280.
Option 2: Gold keeps moving higher into another strong demand zone of $3,416.
Which scenario do you find more likely?
XAUUSD/GOLD/SellThe pressure from the bears is too great. In the end, the pressure from above was not broken. Instead, it broke out and fell after being under pressure. The stop loss was hit.
The current price is 3285. After gradually boosting the US dollar index. The trend of gold prices has continued to fall. More importantly, the tariff issue has been eased. At the same time, geopolitical factors are also orderly and stable. This is the news that caused the bears to attack.
History has not become the savior because of repeating itself. Of course, this is also an emergency. In some transactions, the extremely low probability of causing losses is a common problem in transactions. However, our analysis team has stabilized a high trading win rate.
Then the next trading plan is still to focus on the pressure from above. If the London market rebounds above 3300. It is still mainly selling. 3314 is an important level for short-term rebound, and we need to pay attention. Although there is no obvious sign of rebound yet, the release of short-selling pressure has been alleviated because the decline is slow. Today's main trading idea is still to sell at high levels.
The target is to focus on the position of 3264-3248. Remember the risk of buying at low levels. Do not trade independently.
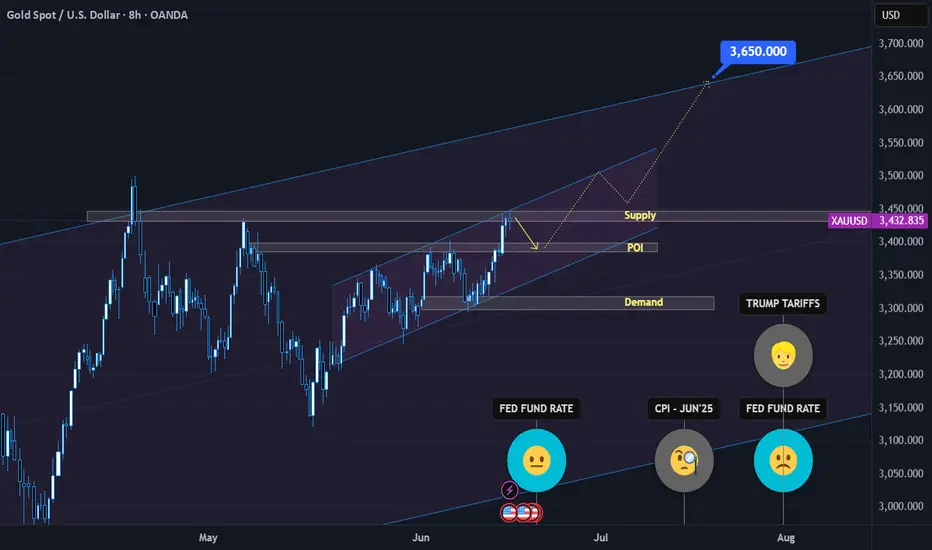
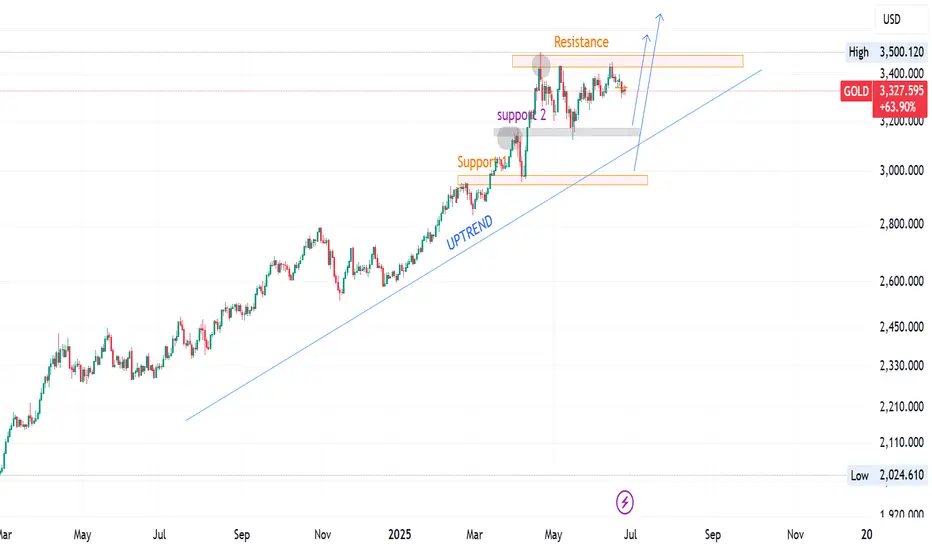
Gold is challenging ATHGold meets resistance at 3,440 on Friday, despite a surge in geopolitical risks amid the Iran-Israel war. We expect the market to have a correction before rising to all-time highs.
The ideal ATH level is 3,650
What we want to see to achieve ideal level ?
The market rebounded from the POI level driven by a strong bull signal.
The market break and retest the last high at 3,500.
If the market reverses sharply after breaking 3,500, all the above scenarios will be invalid and a false breakout pattern will occur.
Fundamental level that you should pay attention:-
The Federal Reserve’s interest rate decision will be announced next week, and investors expect Powell to keep interest rates unchanged.
The Iran-Israel war could intensify geopolitical risks in the Middle East. If tensions escalate further, we expect gold price to surge.
The Federal Circuit will appeal Trump's tariffs as an abuse of presidential power on July 31, 2025
Trading FOMC (short idea)FOMC is coming and we have been stuck in this range for a few days. expect a volatity during the news a spike. both sellers and buyers of the range be aware that news could spike on both sides.
For me, I target for short, because Jerome is my grandpa. Joking.
Short Entry : 3403
SL : 3413
TP 1 : 3311
TP 2 : 3223
TP 3 : 3060

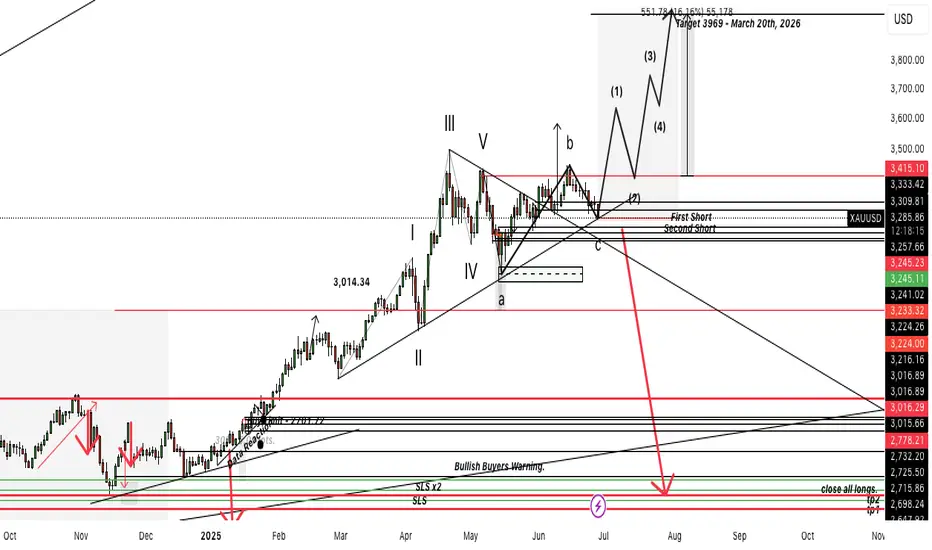
Gold Impulse / En Route 12345Long Gold. 3289-3280 Target 3673
SLS Just Below 78-70 Dpending on Leverage.
Gold failed our Beaish Zone Target Eliminating out bearish senitiment .
June 27th 2025 We Long Gold going into June 29th Weekend of Basel 3's Waiting Policy Until january 27th 2027. Gold will be extremely Bullish Afterthis corrective wave from 3415.
Today we enter Long Positions into the weekend Expecting a. Gap Up to Around 3338 Trapping All short sellers in the Month of June.
GOLD Price Forecast: Is the Pullback Over? | Weekly OutlookWill XAUUSD resume its bullish trend, or is more downside ahead?
In this video, I break down last week’s gold price movement and the current market reaction to rising geopolitical tensions between Iran and Israel, now with the U.S. joining the conflict. We also assess the impact of the Fed’s recent rate hold, weak retail sales, and upcoming high-impact U.S. economic events like PMI, GDP, and Core PCE.
💡 Here’s what you’ll learn:
✅What caused gold’s pullback last week
✅Why institutional traders shake out retail buyers
✅Key fundamentals driving gold right now
✅How to position yourself smartly for the upcoming trading week
🔔 Don’t forget to like the video in support of this work.
Disclaimer:
Based on experience and what I see on the charts, this is my take. It’s not financial advice—always do your research and consult a licensed advisor before trading.
#goldanalysis, #xauusd, #goldforecast, #goldpriceprediction, #forexanalysis, #fundamentalanalysis, #forextrading, #tradinggold, #goldnews, #federalreserve, #marketpsychology, #tradingstrategy, #geopoliticalrisk, #usdata, #iranisraeltensions, #goldbullish, #goldbearish, #forexmentor, #xauusdforecast, #tradingview

XAU/USD: Gold's Critical Decision Point! FOR JUNE 06, 2025 📊 CURRENT SNAPSHOT
---
🎯 THE SETUP: "Golden Triangle Breakout"
Gold is sitting at a CRITICAL JUNCTURE - trapped between major support and resistance levels, forming what I call the "Golden Pressure Cooker" pattern.
🔍 KEY LEVELS TO WATCH
🔴 RESISTANCE ZONE (The Ceiling)
* LWH (Last Week High): \$3,403.55 - Ultimate target
* LWL (Last Week Low): \$3,297.94 - Immediate resistance
* 4H FVG: \$3,350 area - Major supply zone
🟡 CURRENT BATTLEFIELD
* Price Action: Consolidating in tight range
* PWL (Previous Week Low): \$3,245.28 - Key pivot
🔴 DANGER ZONE (The Floor)
* DIE ZONE: \$3,121.70 - Critical support
* Break below = Major bearish signal
---
📈 MARKET STRUCTURE ANALYSIS
What the Chart is Telling Us:
1. 📊 Consolidation Phase: Gold has been ranging for several sessions
2. ⚡ 4H FVG Above: Acting as a magnet for price
3. 🎯 Triple Test: Price respecting the PWL level multiple times
4. 📉 Volume Decline: Typical before major moves
---
🚀 TRADING SCENARIOS
SCENARIO 1: "Golden Rocket" 🚀 (BULLISH)
IF price breaks above \$3,297.94 (LWL):
* Target 1: \$3,330- +1.2% gain
* Target 2: \$3,350(FVG) - +3.9% gain
* Stop Loss: \$3,280 - Risk: -0.5%
Risk/Reward: 1:1.8 ⭐⭐⭐
SCENARIO 2: "Golden Avalanche" 📉 (BEARISH)
IF price breaks below \$3,245.28 (PWL):
* Target 1: \$3,200 (Psychological level)
* Target 2: \$3,121.70 (Die Zone)
* Stop Loss: \$3,297.94 (LWL)
---
💡 SIMPLE TRADING PLAN
🎯 FOR BULLS (Buy Setup):
```
ENTRY: Break above $3,298 with volume
STOP: $3,285
TARGET 1: $3,330
TARGET 2: $3,360
🎯 FOR BEARS (Sell Setup):
```
ENTRY: Break below $3,245 with volume
STOP: $3,298 (LWL)
TARGET 1: $3,200
TARGET 2: $3,122 (Die Zone)
---
⚠️ RISK MANAGEMENT RULES
1. Position Size: Risk only 1-2% of account
2. Wait for Confirmation: Don't jump early
3. Volume is Key: Breakouts need volume
4. Time Limit: Close if no movement in 2 days
---
🔥 WHY THIS SETUP MATTERS
Gold is at a crossroads! The tight consolidation suggests big players are accumulating positions. When this range breaks, expect explosive movement in either direction.
Smart Money Clues:
* Multiple tests of PWL = Strong support
* 4H FVG above = Price magnet effect
* Low volume = Calm before the storm
---
📊 MARKET CONTEXT
* Dollar Weakness: Could fuel gold rally
* Economic Uncertainty: Safe haven demand
* Technical Setup: Clean breakout pattern
* Timeframe: Perfect for swing trades
---
🎯 MY VERDICT
Gold is COILED and ready to EXPLODE!
The setup favors the bullish scenario due to:
✅ Strong support holding at PWL
✅ 4H FVG acting as price magnet
✅ Multiple failed attempts to break lower
✅ Overall uptrend structure intact
But remember: Respect the levels and trade the breakout, not your bias!
---
🚨 ACTION ITEMS
1. Set Alerts: \$3,298 (bull trigger) & \$3,245 (bear trigger)
2. Watch Volume: Breakouts need confirmation
3. Be Patient: Wait for clean breaks
4. Have Both Plans: Ready for either direction
---
Trade Smart, Stay Safe! 🥇💰
The market rewards patience and punishes impatience.

Daily live trade with XAUUSD in 15m/30m/1h 20250625Daily live trade with XAUUSD in 15m/30m/1h 20250625
A promising uptrend ,so we wait untill the market test the area Actually if the market breaks the area of support at 3134.713, we might look for another buying opportunity at 2972.951. we will wait for the confirmation OANDA:XAUUSD on our daily chart
Dramatic change coming?In response to prospects of a de-escalation in the Middle East tensions, XAU/USD fell and has continued to decline throughout the day.
Despite the apparent breakthrough, Israeli Defense Minister Israel Katz ordered retaliatory strikes after claiming Iran violated the agreement hours after both nations agreed to the ceasefire, allegations that Tehran denies.
US President Donald Trump announced the initial ceasefire between Israel and Iran on Monday evening during an address at Capitol Hill, stating that “Stability in the Middle East is essential for global peace.”
The announcement followed Iranian missile strikes on US bases in Qatar, which were intercepted without casualties.
The ceasefire has pressured Gold and Crude Oil prices as traders unwind risk hedges tied to potential disruptions in the Strait of Hormuz, a critical chokepoint for roughly 20% of global Oil supply.
The reduced threat of supply disruption would help lower inflation expectations, a key theme for the Fed, which is facing pressure from Trump to cut interest rates.
However, investors expect the Gold price to get supported by a dramatic change in the Federal Reserve’s (Fed) stance on the monetary policy outlook. Fed Vice Chair Michelle Bowman stated in a gathering in Prague on Monday that monetary policy adjustments are becoming appropriate amid growing job market risks and expectations that the tariff policy announced by Donald Trump will have limited impact on inflation.
Tomorrow,Federal Reserve Chairman Jerome Powell testifies about the semiannual Monetary Policy Report before the US Senate Committee on Banking, Housing, and Urban Affairs.
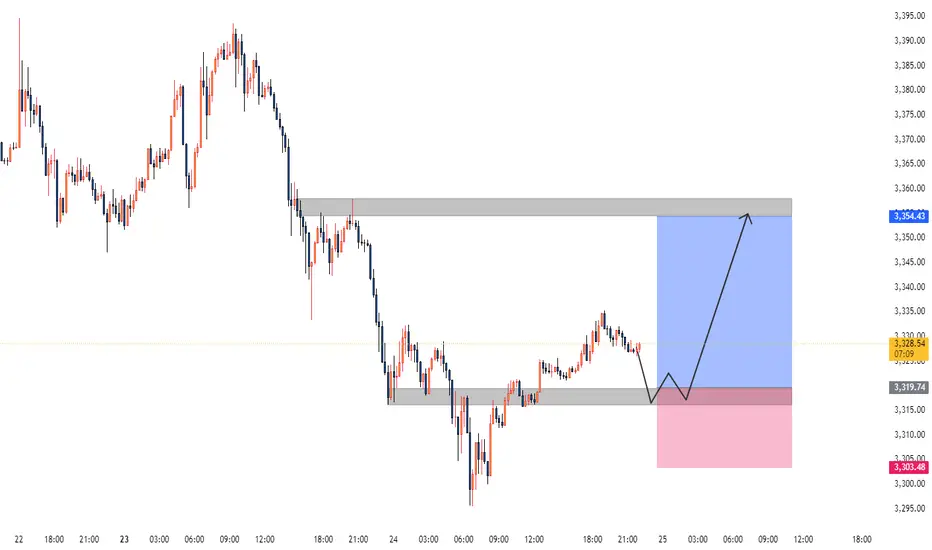
Gold XAUUSD Analysis 25.06.2025The Gold shows with a recent upward trend following a period of consolidation and a dip. Key observations:
The price previously fluctuated between a support level around 3,310-3,319 and a resistance near 3,354.
The current price is consolidating near the recent high, suggesting potential for further upward movement or a pullback.
Signal:
Buy signal is present in the range of 3,316-3,319, aligning with the support level, offering a good entry point for a potential upward move.
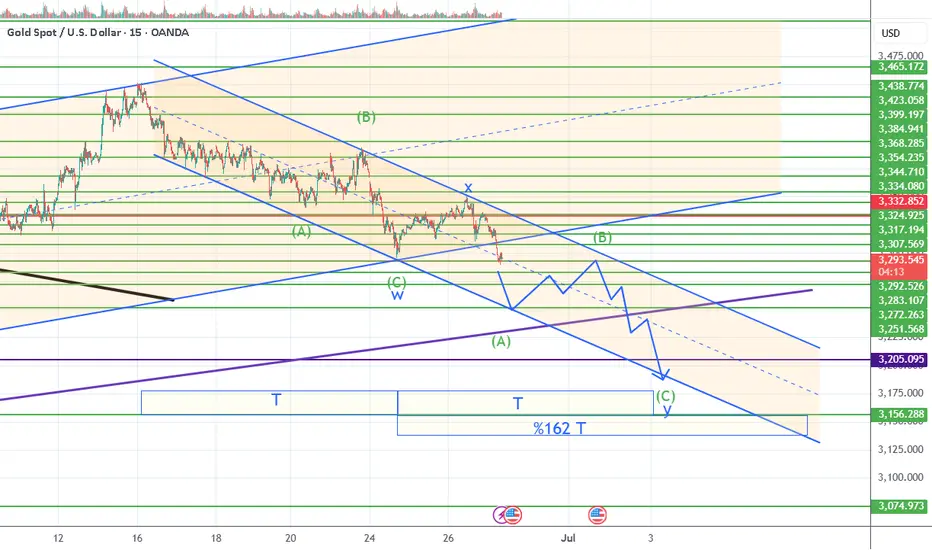
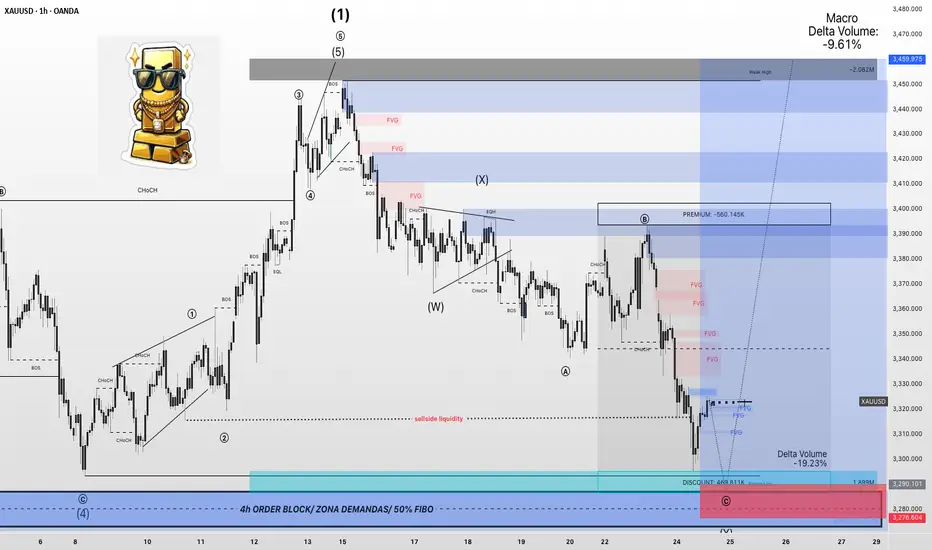
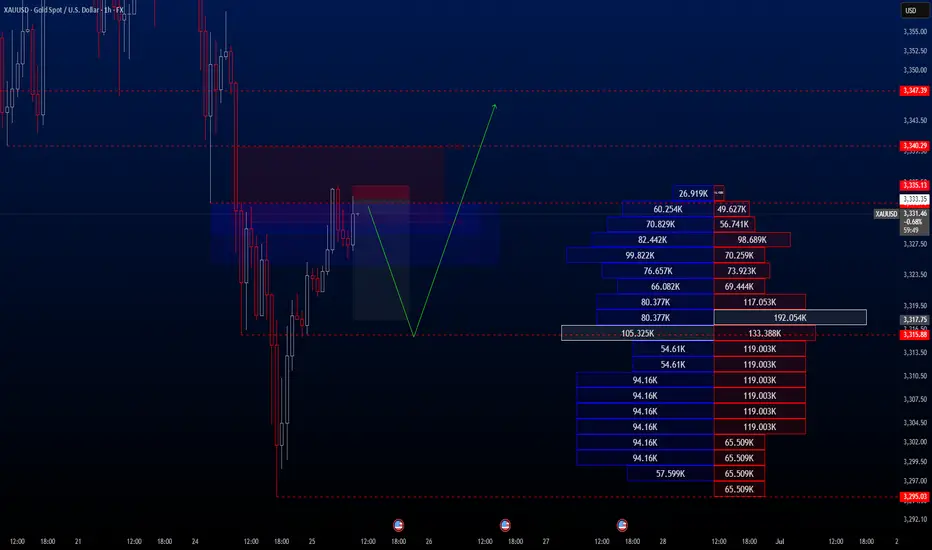
Gold Short: Wave 5 of C In this video, I explained my change in the Gold Elliott Wave counts on the cycle level (red font numbering) and how I think the Gold price movement will go down in a double combination (because the previous 2 waves are double combinations).
I also go through how I set the short target using Fibonacci extensions.

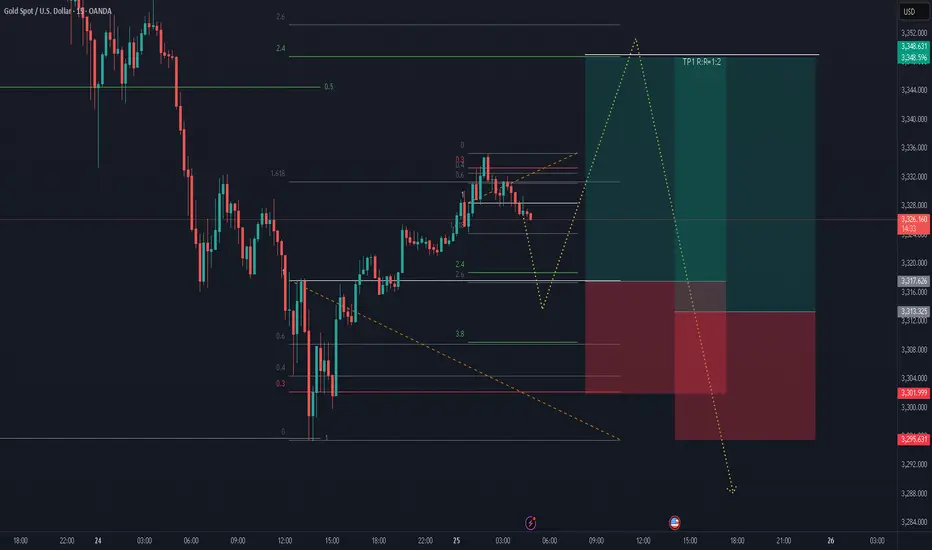
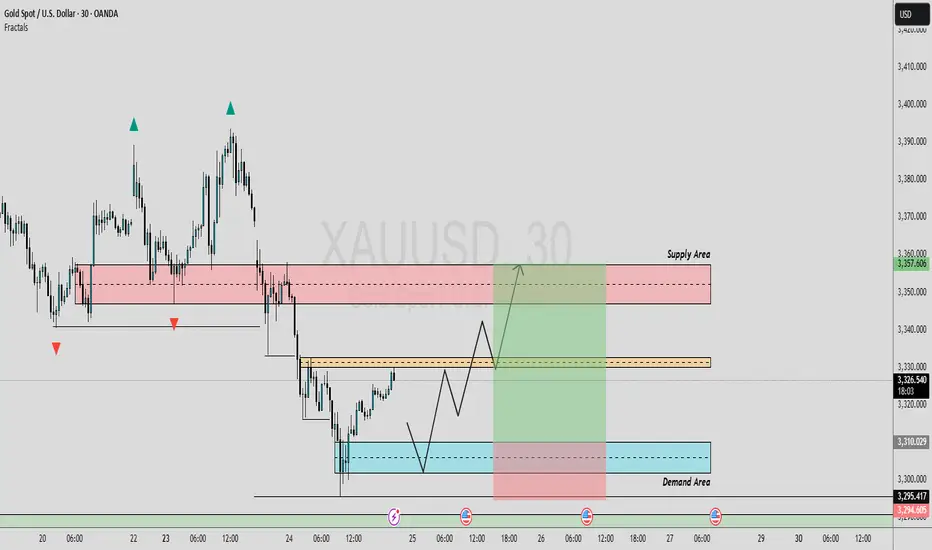
#XAUUSD #GOLD 30Min 📉📈 #XAUUSD 30m Analysis – Dual Setup Scenario
We’re monitoring two potential trade setups depending on how price reacts at key levels:
🔴 Sell Setup:
Price is entering a Sell-Side Order Block Zone between 3350–3360, aligned with a Fair Value Gap (FVG). This premium zone is likely to act as strong resistance, with potential rejection targeting downside liquidity near 3310 — an ideal area for short positions.
🟢 Buy Setup:
If price sweeps below and taps into the Liquidity Zone / Demand Area around 3305–3311, we’ll watch for a bullish reversal from this discount zone. This area offers a favorable setup for long entries, aligning with institutional buying levels.
📌 Be sure to mark these key zones on your chart for enhanced clarity and execution.
💬 What’s your outlook on Gold? Share your thoughts below 👇

GOLD 30M ANALYSIS (LONG)In this analysis we're focusing on 30Min time frame. If we look in this 30Min chart, we have supply area and demand area. And we have also a minor resistance level. Now what I'm looking for that price move impulsively upside after sweeping all SSL. I'm expecting that price will come back and retest (3310 - 3305) area at least. So keep an eye on these level, confirmation is key.
Second Condition:
If price break above 3332 and close above 3332 with strong momentum than we will plan a buy trade on retracement.
Always use stoploss for your trade.
Always use proper money management and proper risk to reward ratio.
#XAUUSD 30M Technical Analysis Expected Move.
Gold Turns Bullish After Clearing Daily Sell-Side LiquidityThe purge of this liquidity indicates that institutional players may have engineered a move to grab orders before initiating a new upward leg. Following this move, price action shows signs of strong bullish intent, such as bullish engulfing candles, increased volume on up moves, or a break above short-term resistance.
This liquidity sweep not only invalidates bearish pressure but also creates a clean bullish imbalance, offering a potential entry zone for buyers. Traders should now watch for:
A break and retest of the key structure above the liquidity sweep.
Bullish order blocks forming on lower timeframes (e.g., H1 or H4).
Confluences like Fibonacci retracement levels, trendline support, or moving average bounces.
As long as price holds above the level of the purge and continues forming higher lows, gold is likely to trend upward in the near term. Potential targets include recent highs or fair value gaps left behind during the bearish move.
This setup favors buying pullbacks rather than chasing price, with invalidation below the recent sweep level.
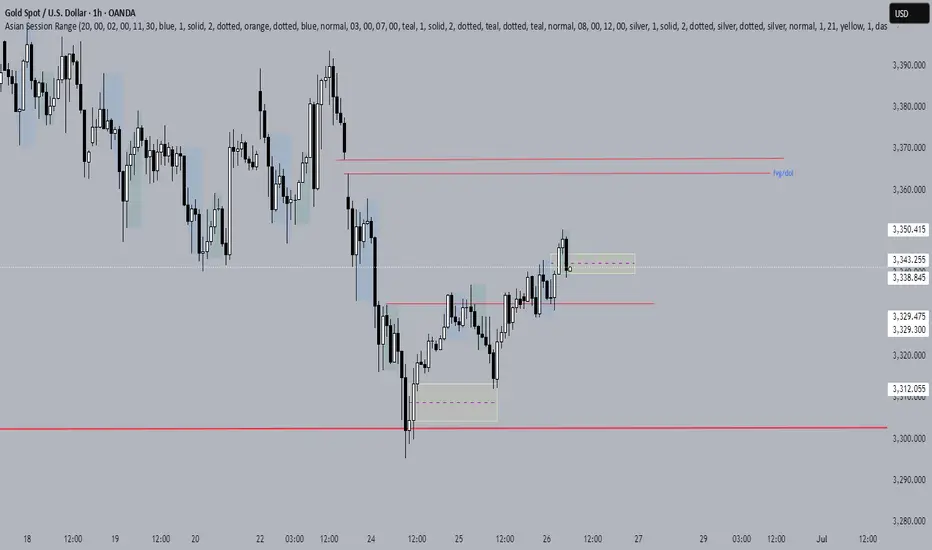
XAUUSDHello traders.
I’ve spotted an exceptional sell opportunity on the XAUUSD pair—one of those setups that come around once in a hundred years! The trade offers a Risk-to-Reward ratio of over 1:8, so I thought it would be valuable to share it with you.
Please adjust your risk parameters accordingly before entering the trade.
🔍 Trade Details
✔️ Timeframe: H1
✔️ Risk-to-Reward Ratio: 1:8.70
✔️ Trade Direction: Sell
✔️ Entry Price: 3333.35
✔️ Take Profit: 3317.75
✔️ Stop Loss: 3335.13
🕒 If momentum fades or the price consolidates in a tight range, I will keep this trade open only until 23:00 (UTC+4). After that, I’ll close it manually—whether in profit or loss—depending on how price action evolves.
🔔 Disclaimer: This is not financial advice. I’m simply sharing a trade I’ve taken based on my personal trading system, strictly for educational and illustrative purposes.
📌 Interested in a systematic, data-driven trading approach?
💡 Follow the page and turn on notifications to stay updated on future trade setups and advanced market insights.
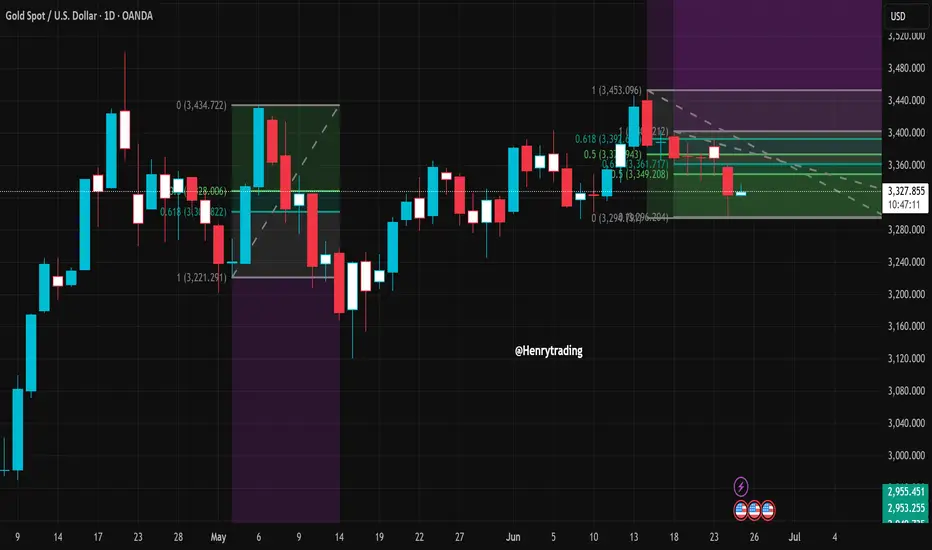
XAUUSD Technical Outlook – Rebound or Trap?1. Market Overview
After a sharp rejection near the 0.618 Fibonacci level, XAUUSD has pulled back and is now trading around 3,323 USD. Although price has stabilized somewhat, technical indicators suggest this is likely a corrective move within a prevailing downtrend.
2. Technical Analysis
Price Action
XAUUSD is currently hovering near 3,323 USD after a failed attempt to break above the resistance zone at 3,373–3,392 USD — an area marked by:
The 0.618 Fibonacci retracement from the recent downtrend
Repeated historical rejections.
The upper boundary of a sideways consolidation range from early June.
Recent candlesticks show indecision and rejection from higher levels, suggesting sellers are still in control.
Support Zone Behavior
The price recently bounced from the 3,294–3,317 USD range, where strong historical support and the 0.382 Fibonacci level align.
This zone continues to hold, but if broken, could open the door to deeper declines toward the 3,250 or even 3,224 USD levels.
RSI Indicator
RSI remains flat around the neutral zone, indicating a lack of bullish momentum.
No significant divergence or breakout signals are currently visible on the daily RSI chart.
3. Key Technical Levels
Resistance:
3,373 – 3,392 USD: Confluence resistance zone (0.618 Fib + historical supply).
3,435 – 3,453 USD: Previous swing high – key medium-term benchmark
Support:
3,294 – 3,317 USD: Immediate support, holding for now.
3,250 – 3,224 USD: Potential next target zone if bearish pressure resumes.
4. Trade Setup Scenarios.
Scenario 1 – Buy if support holds and bullish confirmation appears
Entry: 3,295 – 3,305 USD.
Stop-loss: Below 3,289 USD.
Take-profit: 3,340 – 3,355 – 3,370 USD.
Condition: Look for bullish reversal patterns (e.g., Bullish Engulfing, Pin Bar) on H1–H4.
Scenario 2 – Sell on rejection from resistance zone
Entry: 3,370 – 3,375 USD.
Stop-loss: Above 3,392 USD.
Take-profit: 3,330 – 3,310 – 3,290 USD.
Condition: Clear bearish rejection candlestick with diminishing volume
Note:
XAUUSD remains in a vulnerable state. The current move may be a technical rebound rather than a true reversal. Traders should watch closely how price behaves around the 3,373–3,392 USD zone in the coming sessions. A breakout could signal a new bullish leg, while another rejection would likely confirm a continuation of the bearish trend.
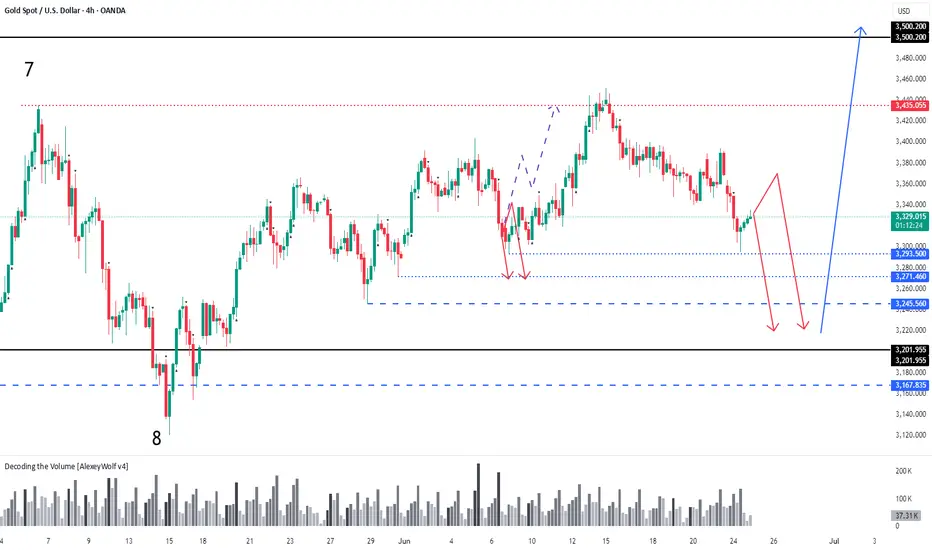
GOLD. Daily Timeframe overview with Initiative AnalysisHey traders and investors!
Daily Timeframe
Market phase : sideways. Seller's initiative.
Boundaries marked with black lines.
Gold followed an alternative scenario from the previous review toward 3435. The buyer played out the 8-9 vector of the range on the daily timeframe, and now the initiative has shifted to the seller. The seller's targets are 3245 and 3201 — areas to watch for potential buy patterns aiming for a new ATH. The price might get stuck in the 3293–3271 zone. If a strong buyer reaction occurs, a reversal may happen in this range.
The ideal area to look for buy patterns is around 3201.
Selling is risky.
This analysis is based on the Initiative Analysis concept (IA).
Wishing you profitable trades!
Will gold prices continue to decline?On Tuesday, spot gold once fell below the $3,310 level and finally closed down 1.67% at $3,322.82 per ounce, as the Israel-Iran ceasefire dented safe-haven sentiment and Fed Chair Powell stated that more time is needed before considering interest rate cuts. Spot silver closed down 0.46% at $35.90 per ounce. The benchmark 10-year U.S. Treasury yield closed at 4.2960%, and the 2-year yield at 3.8310%. Powell indicated that current policy is in a favorable position to wait and see before considering rate adjustments, adding that "colleagues privately say I'm doing the right thing". The vast majority of officials believe rate cuts later this year would be appropriate, while noting it's "too early to declare the U.S. dollar is falling".
Technically, gold's daily chart formed a large bearish candle with a lower shadow, breaking below previous support levels amid consolidation. This suggests the bearish trend may persist.
you are currently struggling with losses,or are unsure which of the numerous trading strategies to follow,You have the option to join our VIP program. I will assist you and provide you with accurate trading signals, enabling you to navigate the financial markets with greater confidence and potentially achieve optimal trading results.
Trading Strategy:
sell@3330-3335
TP:3300-3295
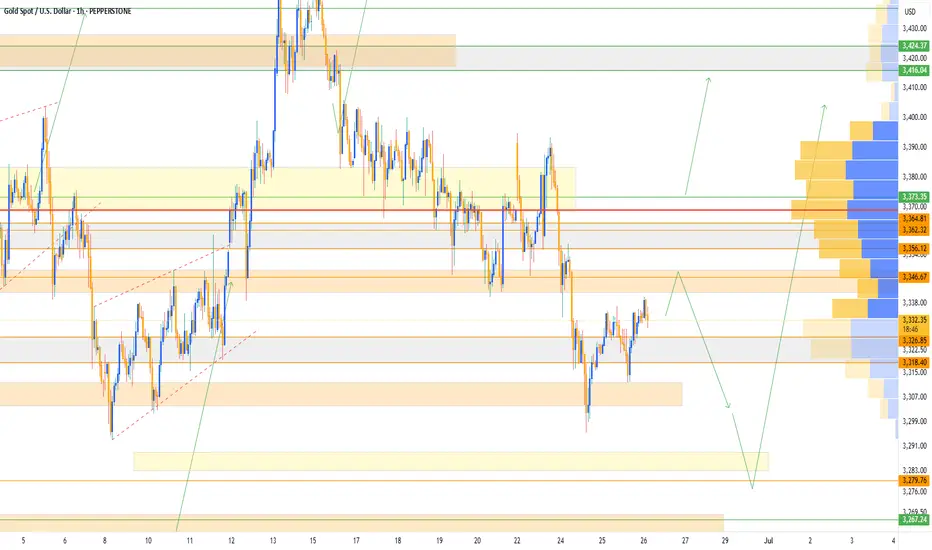
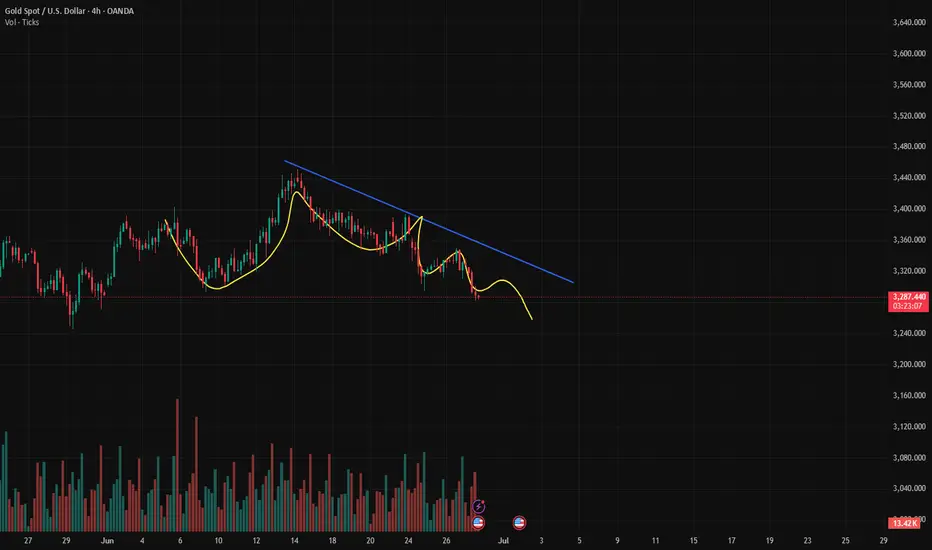
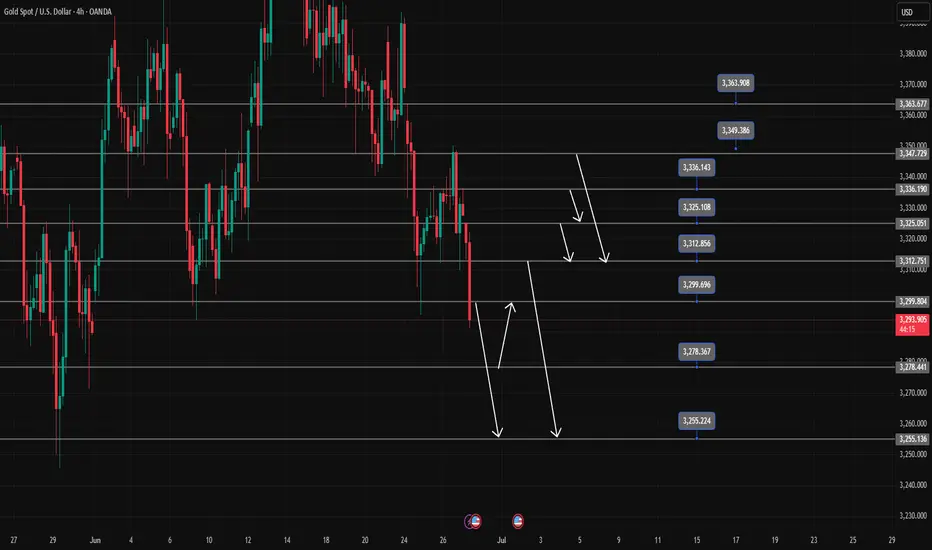
Gold Trading Strategy June 27✏️The price reaction at 3348 forms a sustainable bearish structure. 3296 is an important zone when broken, it will continue to fall deeply without any recovery on Friday.
Today the downtrend will encounter less resistance than the uptrend. Therefore, it is not difficult to touch the support zones of 3278 and 3255.
Any recovery in the price in the European session is considered a good opportunity for a Sell signal towards the target of 3278 and 3255.
As analyzed, the SELL zone today is noted at many resistance zones and consider the price reaction for the SELL signals.
📈 Key Levels
Break out: 3296
Support: 3278-3255
Resistance: 3300-3312-3325-3336-3348-3363
📊 Recommended Trade Setups
BUY 3278-3276 SL 3272
SELL 3325-3327 SL 3330
XAUUSD Gold Correction Movesit s a correction, it s messy, it is complicated but also it is necesery, so this is a sell until the brake of channel, until probably next week friday or so.. i expect 3251-3205 or maybe little bit lower targets