DeGRAM | GOLD retest of the resistance line📊 Technical Analysis
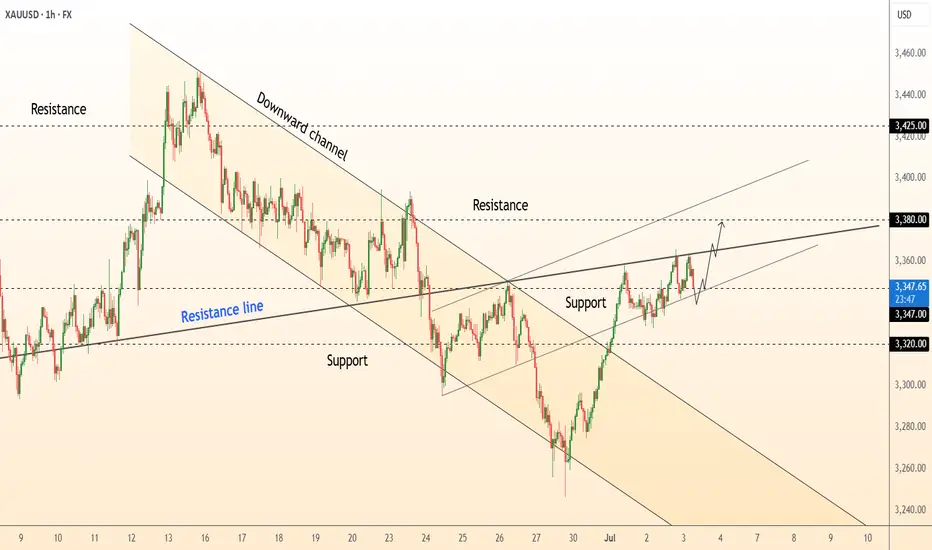
● Price holds above the broken blue resistance line, now acting as support near 3 347, while an inner up-sloper is guiding a stair of higher lows inside the new grey channel.
● The confluence of channel mid-line and 3 355 swing high is the gate; its clearance activates an equal-width objective at 3 380, with the outer rail / former consolidation lid at 3 425 next.
💡 Fundamental Analysis
● Easing US ISM-services prices trimmed real 2-yr yields and the dollar, while latest WGC data show June net central-bank purchases rising for a third month, reviving dip-buying in gold.
✨ Summary
Long 3 345–3 355; hold above 3 355 targets 3 380 → 3 425. Invalidate on an H1 close below 3 320.
-------------------
Share your opinion in the comments and support the idea with a like. Thanks for your support!
XAUUSD.F trade ideas
GOLD H4 Accumulation Fractal Target is 4 000 USD 🏆 Gold Market Mid-Term Update
📉 Gold Pullback: XAU/USD drifted below $3,350, falling to around $3,325–$3,330 amid easing Middle East tensions and a firmer U.S. dollar.
🤝 Ceasefire Effect: De-escalation in Israel-Iran hostilities reduced safe-haven demand, capping gold’s upside.
💵 Fed & USD Dynamics: Fed Chair Powell reaffirmed that policymakers aren’t in a rush to cut rates. A softer dollar provided some support, but intraday USD strength weighed on gold.
📊 Technical Watch: Gold remains in a bearish short-term structure below the 200-period SMA. Resistance lies near $3,368–$3,370; support cluster begins around $3,300, with potential slide to $3,245–$3,200 if broken.
🔮 Forecast Updates:
• Citi Research flagged that gold may have peaked and could undergo further softening in Q3-2025.
• WSJ notes gold posting weekly gains, with futures steadying at $3,339/oz.
• Another WSJ report suggests potential for new highs later this year—forecasting an average of $3,210/oz in 2025, a 35% increase.
⚠️ Market Split: Opinions are fragmented—Wall Street sees mixed short-term direction, while Main Street maintains a bullish stance ahead of key U.S. data (GDP, PCE, jobless claims).
🏠 Central Bank Demand: Sustained demand from central banks reinforces gold’s structural support.
🔮 Live Price Snapshot: Futures are up ~0.2%, trading at $3,339.20/oz today.
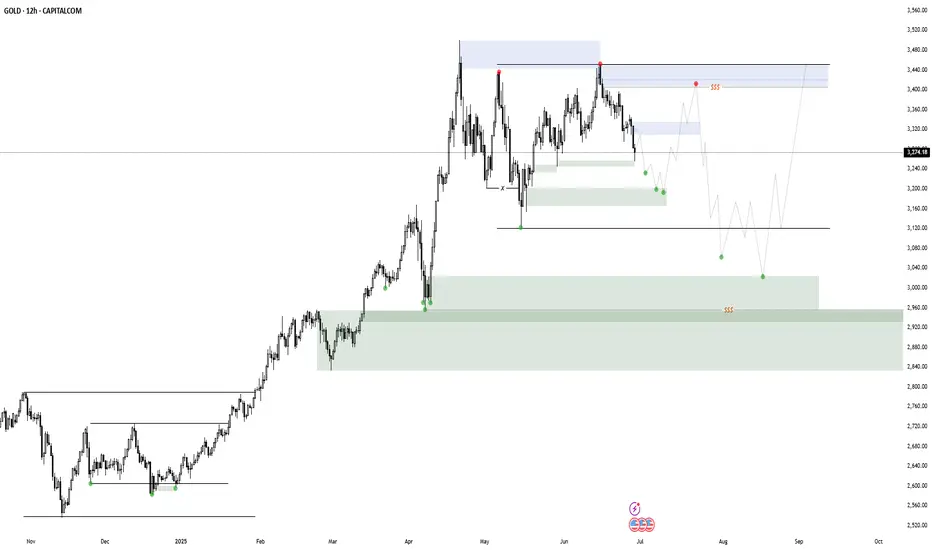
📊 Technical Outlook Update
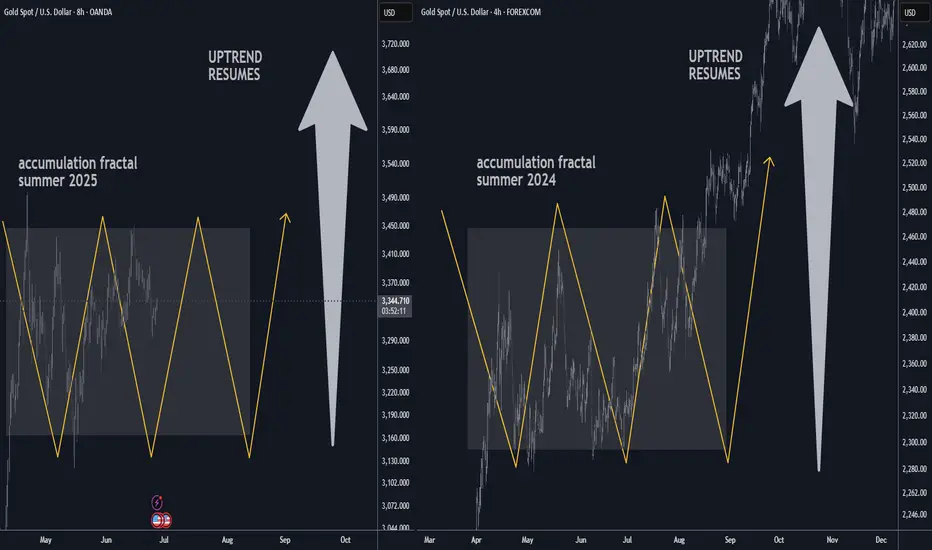
🏆 Bull Market Overview
▪️ A pullback is currently unfolding
▪️ Heavy resistance seen at $3,500
▪️ Possible re-accumulation underway
▪️ Scenario mirrors summer 2024
▪️ Accumulation before breakout
▪️ Downside protected around $3,150
▪️ Short-term range trading in progress
▪️ Bulls maintain strategic upper hand
⭐️ Recommended Strategy
▪️ Buy dips within the range
▪️ Look for entries near $3,150 S/R zone
▪️ Long-term bullish target of $4K remains intact
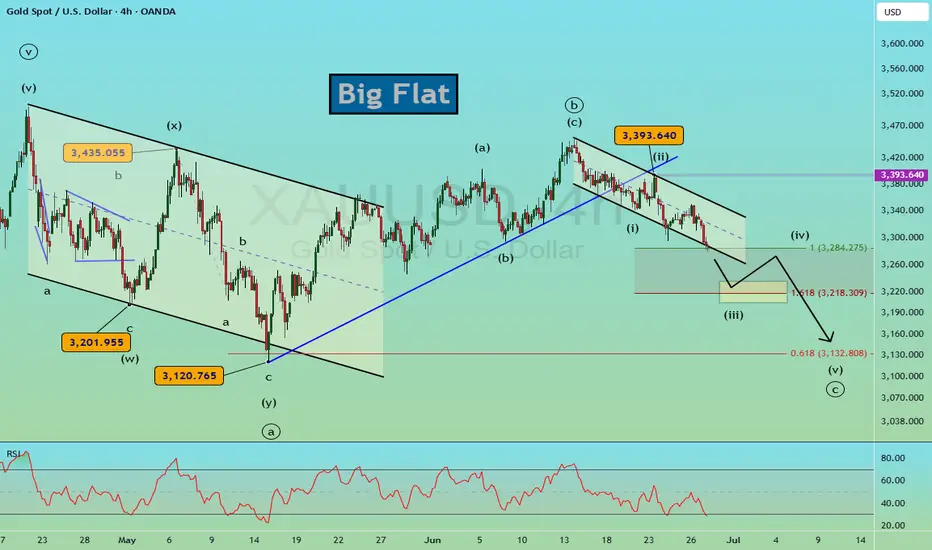
Gold's Decline Not Over (Yet)#Gold is in a declining pattern that appears incomplete. Here are 2 models we are following closely.
1. A decline in wave (iii) of ((c)) - targeting $3,120
2. A decline in wave iii of (ii) - targeting $3,220-3,240
Both models imply the current decline is not over.
FLAT PATTERN
The flat pattern subdivides as a 3-3-5 ((a))-((b))-((c)) pattern. The decline appears to be in the latter stages of this pattern, wave ((c)).
This wave needs to unfold as a motive 5-wave pattern...it appears we are in the 3rd wave decline so a couple of more trends lower. The flat targets $3,120.
LEADING DIAGONAL
The leading diagonal is a motive pattern labeled i-ii-iii-iv-v. The leading diagonal pattern is already complete and now a partial retracement lower of the diagonal is underway. This partial retracement likely carries to $3,220-$3,240.
Under both scenarios, once they are complete, a strong rally is likely to follow. However, the downtrends need more price and time to develop so the rallies are on hold for the moment.
Why Gold Trading is Not Easy for Beginners - Trading PsychologyGold Doesn’t Just Teach Trading. It Teaches You Discipline.
1. Why Gold? Why Not Everything Else?
Gold is the most honest manipulator in the market.
It respects structure down to key intraday levels—but builds traps around it like a pro.
It fakes direction, sweeps liquidity, teases early entries, then moves beautifully for anyone patient enough to wait.
And it’s daily: one premium buy and one killer sell almost every day—hundreds of pips on the table for eyes that can see.
Other assets feel slow once you lock into Gold’s rhythm.
So what to expect:
2. The Phases Before Profit
• Lucky Dumb Money
Early wins boost your confidence. You increase your risk. It all feels easy—until the market proves otherwise.
• The Slap
Suddenly, things don’t work anymore. Indicators stop making sense. Emotions interfere. Results shift, and frustration creeps in. This is the breaking point for most traders. 6 months to 1 year on XAUUSD and they are out.
• The Awakening
This is when clarity begins. Indicators are dropped. Structure, liquidity, and timing take center stage.
What once looked random now starts to make sense.
Progress begins the moment YOUR EGO gets quiet.
Consistency only follows those who choose patience over panic.
3. Gold Is a Mirror
Gold doesn’t just reflect your trades — it reflects YOU.
Every personal flaw shows up on the chart: impatience, doubt, greed, fear, ego.
It mirrors your decisions, your reactions, your emotional patterns — all of it.
Blaming the market delays growth.
But the moment you turn inward, you begin to see the truth:
your results reflect your level of discipline, clarity, and self-awareness.
Gold forces you to evolve.
Not just as a trader, but as a thinker, a decision-maker, a human.
That’s why it’s not for everyone. Some people are not ready to recognize who they truly are yet.
4. What Leads to Profitability
What actually leads to profitability in Gold?
It’s fast. It’s full of adrenaline.
But you have to get a routine - consistent, structured, and effective — when applied with discipline.
→ One pair only. Mastery on XAUUSD
→ Structure first. Liquidity, imbalance, session timing
→ Fewer trades, cleaner entries
→ Smaller lots, more control = emotions are in check
→ Relentless observation. Learn from each execution and adjust with intention
This is what leads to results.
Not noise. Not hope. Just precision and presence — again and again.
5. You Won’t Win Until You Commit
You don’t need to destroy your schedule or stay up all night.
But you do need to make time for growth.
Signals won’t help if you’re not willing to understand the asset you’re trading.
Gold filters out shortcuts, distractions, and surface-level effort.
But those who take it seriously earn every pip — and they earn it with clarity, not luck.
So stop asking,
“How long until I’m profitable?”
Start asking,
“Am I ready to do what Gold actually demands?”
CONCLUSION:
Most traders don’t fail because Gold is too complicated—
they fail because they try to figure it out alone.
They chase signals, skip the process, and ignore the real path to consistency:
invest in education, proper mentorship, and trading psychology coaching.
The ones who grow fastest are those who seek guidance early—
from people who live and breathe this market, and understand structure, mindset, and pressure.
If you choose to go at it alone, that’s also a good choice.
Just know: it will take longer. It will test your patience and your clarity.
But when the structure clicks… when you stop chasing setups and start executing with confidence…
When you secure 3–4 solid trades a week and avoid unnecessary losses—
everything changes. Trading becomes calm. Focused. Even enjoyable.
Whichever path you take, the outcome depends on the same thing:
Gold won’t just test your trades.
It will develop your discipline.
If this lesson helped you today and brought you more clarity:
Drop a 🚀 and follow us✅ for more published ideas.
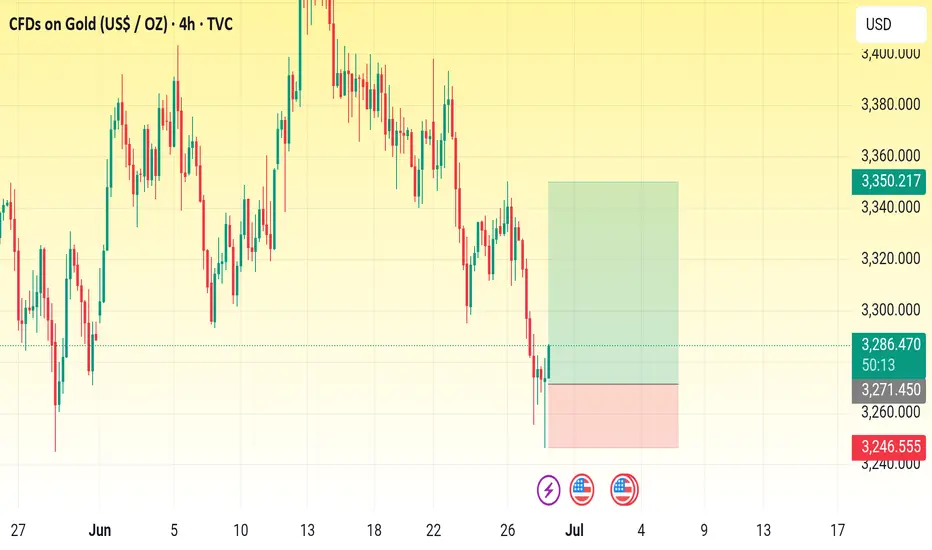
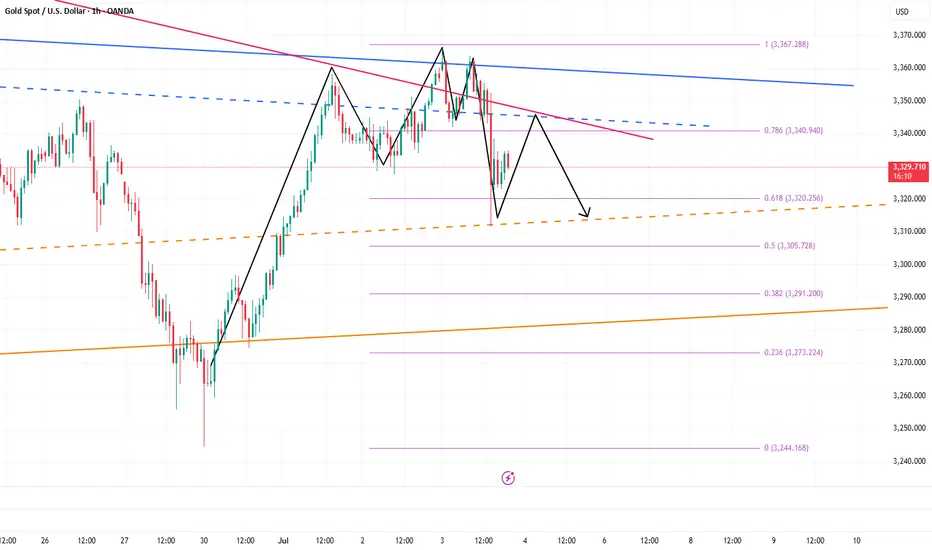
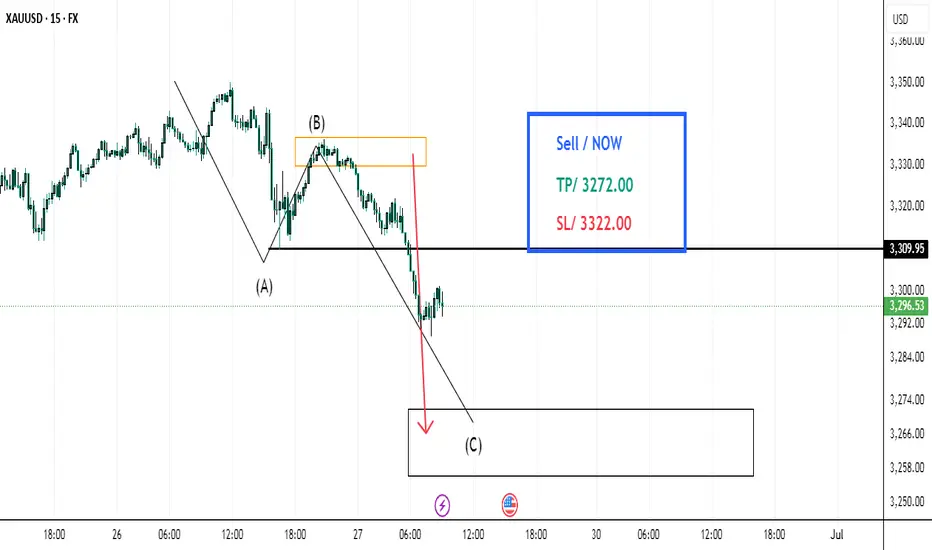
Gold Under Pressure After NFP Beat – More Downside Ahead?Moments ago, the US Non-Farm Payrolls surprised to the upside at 147K (vs 111K forecast), while the Unemployment Rate dropped to 4.1% (vs 4.3% expected) .
This stronger-than-expected labor market data reinforces the idea that the Fed has no immediate reason to cut rates. As a result, the USD( TVC:DXY ) strengthened, and gold came under renewed selling pressure.
If the dollar momentum continues, Gold ( OANDA:XAUUSD ) may face further downside in the short term.
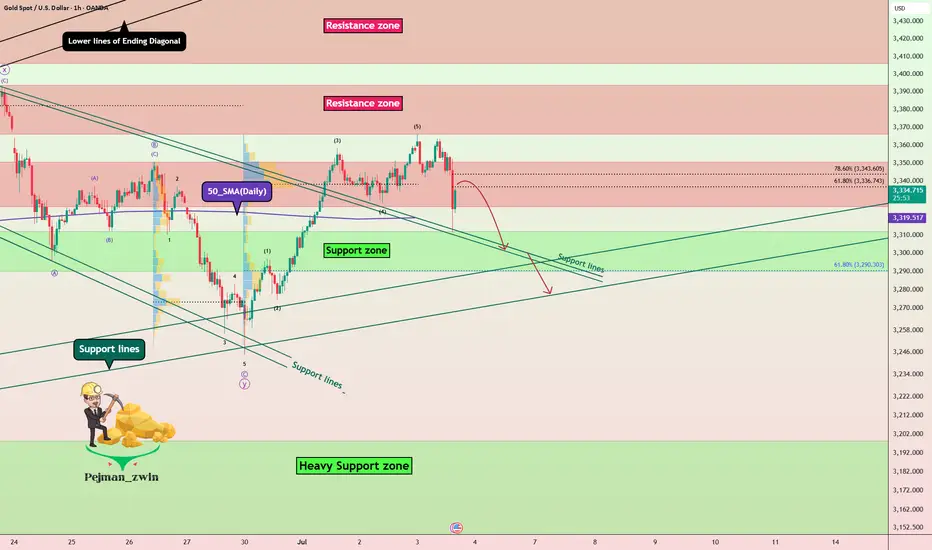
In terms of Technical Analysis , Gold fell below the Resistance zone($3,350-$3,326) again after the announcement of US indices and is currently moving near the Support lines and 50_SMA(Daily) .
In terms of Elliott wave theory , it seems that Gold has completed 5 impulsive waves in the one-hour time frame, and we should now wait for corrective waves .
I expect Gold to fall again after the upward correction , and the Support zone($3,312-$3,290) could be the target.
Note: Stop Loss (SL) = $3,365
Gold Analyze (XAUUSD), 1-hour time frame.
Be sure to follow the updated ideas.
Do not forget to put a Stop loss for your positions (For every position you want to open).
Please follow your strategy; this is just my idea, and I will gladly see your ideas in this post.
Please do not forget the ✅ ' like ' ✅ button 🙏😊 & Share it with your friends; thanks, and Trade safe.
Gold growth, recovery 3393⭐️GOLDEN INFORMATION:
Gold prices edge higher during the North American session as investors turn their attention to the upcoming US Nonfarm Payrolls (NFP) report — a key indicator that could influence the Federal Reserve’s next policy move. At the time of writing, XAU/USD is trading at $3,348, up 0.29%.
Recent labor data from ADP revealed that companies are pausing hiring rather than resorting to layoffs, reflecting caution amid uncertain economic conditions. Meanwhile, Microsoft’s decision to cut 9,000 jobs has added to concerns about a softening labor market.
Traders now await Thursday’s official employment report from the Bureau of Labor Statistics, which is projected to show 110,000 new jobs added in June — a slowdown from May’s 139,000. The Unemployment Rate is expected to tick up slightly to 4.3%, still within the Fed’s projected range of 4.4% according to its latest Summary of Economic Projections.
⭐️Personal comments NOVA:
good buy, hold before NF news. Dollar continues to be under selling pressure from investors, worried about the Trump administration's unstable tariff policies.
⭐️SET UP GOLD PRICE:
🔥SELL GOLD zone: 3393- 3395 SL 3400
TP1: $3380
TP2: $3363
TP3: $3350
🔥BUY GOLD zone: $3296-$3294 SL $3289
TP1: $3308
TP2: $3318
TP3: $3330
⭐️Technical analysis:
Based on technical indicators EMA 34, EMA89 and support resistance areas to set up a reasonable BUY order.
⭐️NOTE:
Note: Nova wishes traders to manage their capital well
- take the number of lots that match your capital
- Takeprofit equal to 4-6% of capital account
- Stoplose equal to 2-3% of capital account
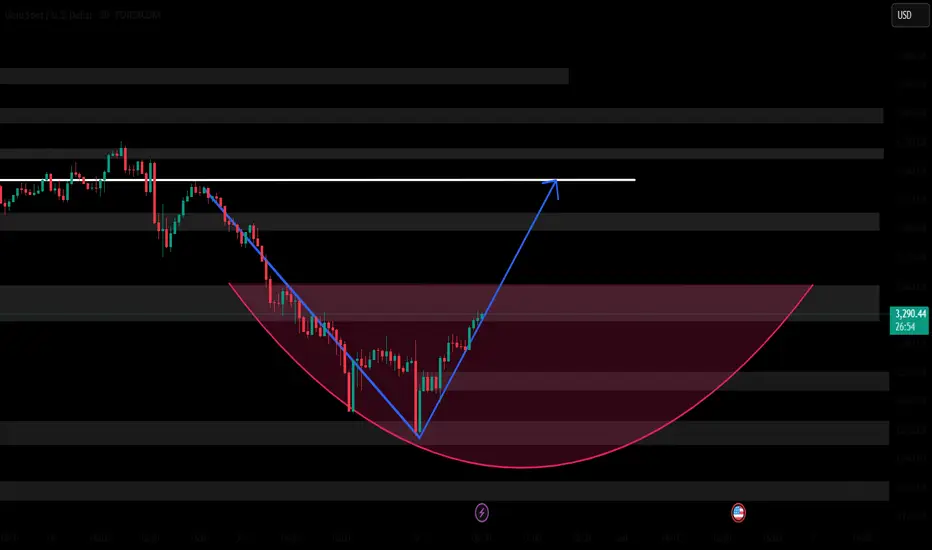
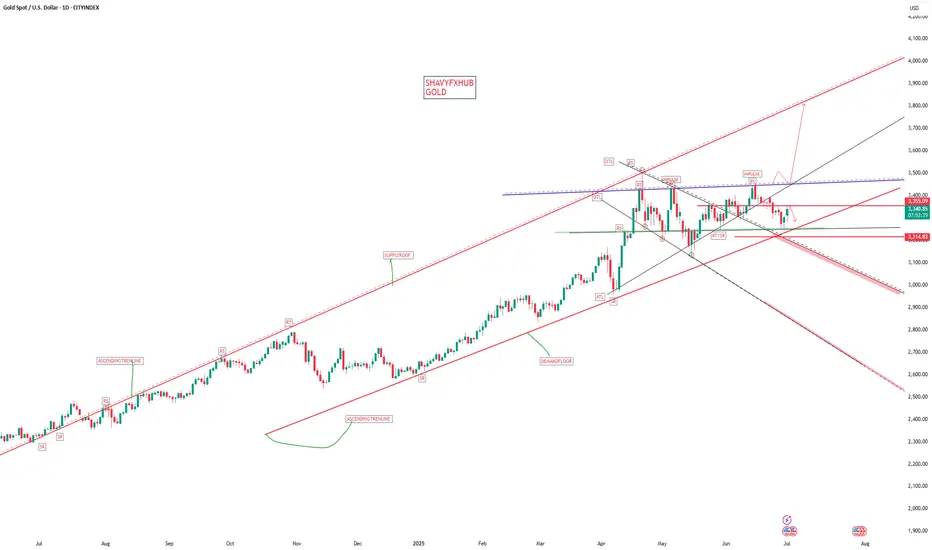
Gold - This is the official top!Gold - TVC:GOLD - might top out soon:
(click chart above to see the in depth analysis👆🏻)
Since Gold confirmed its rounding bottom in 2019 it rallied more than +200%. Especially the recent push higher has been quite aggressive, squeezing all bears. But now Gold is somehow unable to create new all time highs, which could constitute the a top formation.
Levels to watch: $3.500, $3.000
Keep your long term vision🙏🙏
Philip (BasicTrading)

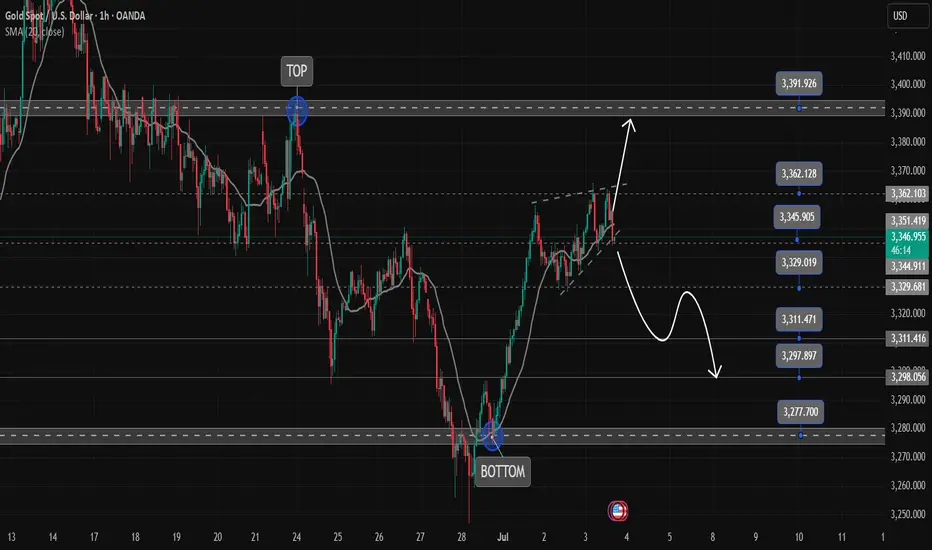
Gold Is Set to Bottom Out and Rebound This WeekAt today’s open, gold once again dipped into the 3258–3248 buy zone, then rebounded toward 3270. From a structural perspective, gold has clearly entered a downward trend, but this decline is unlikely to be one-directional—short-term rebounds and consolidations are expected along the way.
Based on my experience, below 3250 remains a favorable area for initiating long positions. Whether the price rebounds directly or continues lower before building a stronger base to challenge 3300 again, the broader outlook remains bullish as long as the 3200 support holds. A bottoming reversal this week is still the more probable scenario.
As such, the focus early this week should be on buying near the lows, with short opportunities on rebounds as a secondary strategy. Monitor key support levels for signs of strength.
This week is also packed with important data—including PMI, Non-Farm Payrolls (NFP), and the unemployment rate, in addition to regular economic releases. Given the current macroeconomic backdrop, significant market volatility is expected—bringing both risk and opportunity. Manage your exposure carefully and stay adaptable.
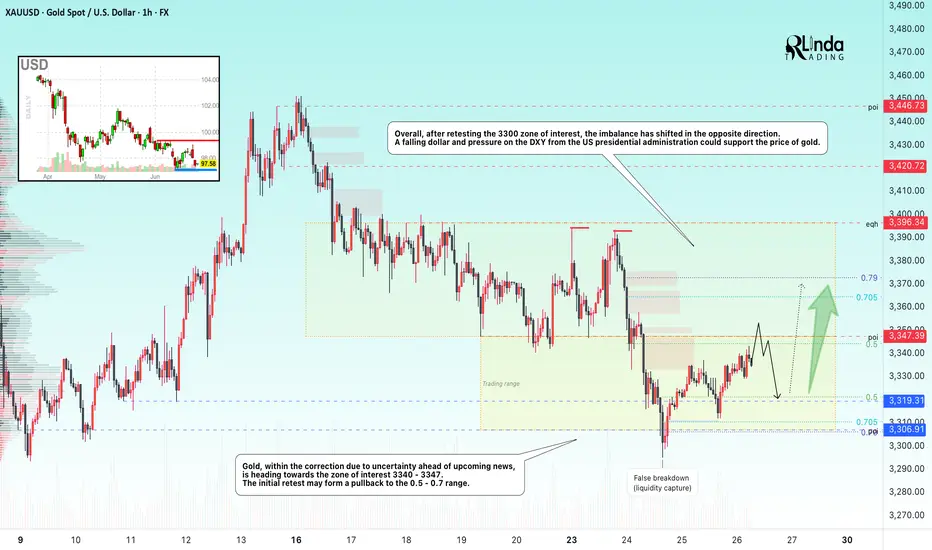
GOLD → Within range. Retest resistance at 3347FX:XAUUSD continues to correct after a false breakdown of support at 3300. Due to uncertainty, the price may remain in the range of 3300-3340 for some time.
Gold is fluctuating amid a weak dollar and uncertainty over Fed rates. Gold is struggling to hold on after rebounding from weekly lows, despite the US dollar falling to multi-year lows. Pressure on the dollar has intensified due to Trump's criticism of the Fed and rumors of a possible replacement for Powell. However, gold is limited in its growth due to a pause in geopolitical tensions and hawkish signals from the Fed chair. Investors are awaiting key macro data from the US (e 12:30 GMT Durable goods orders, GDP, Initial Jobless Claims) and especially the PCE inflation report on Friday.
Technically, the focus is on key areas of interest: 3300, 3306, 3340, 3347. Until strong news emerges, an intraday trading strategy should be considered.
Resistance levels: 3347, 3357
Support levels: 3320, 3307, 3300
Technically, a false breakout of resistance at 3347 and a retest of the local liquidity zone at 3320-3307 are possible before growth continues for the reasons mentioned above. Targets could be 3347, 3364, 3372, and 3396.
Best regards, R. Linda!
Gold RangeThis reaccumulation model for gold just popped into my head, so I wanted to post it on my profile to see how wrong I was later. My main focus right now is this potential internal distribution, which will likely take some time to confirm/invalidate. I'll take a closer look if there are more signs that it's playing out.
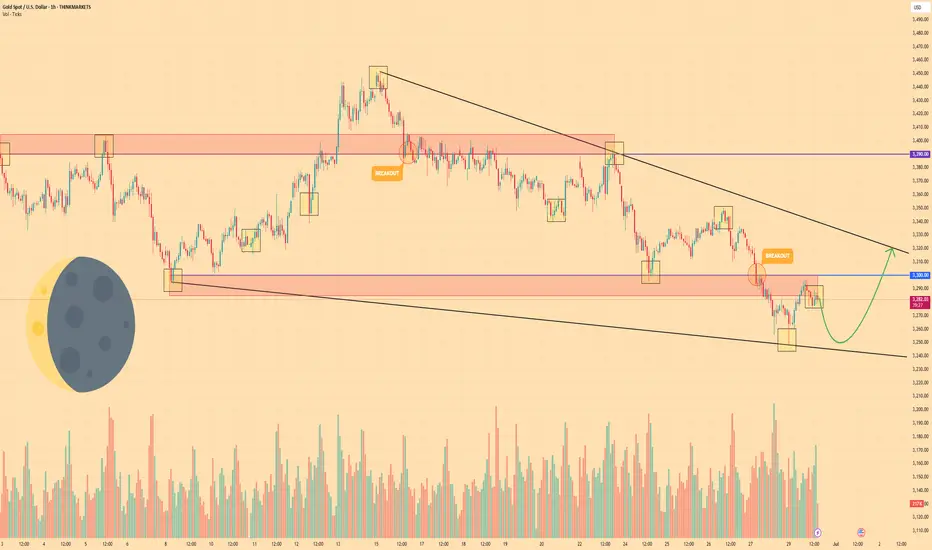
GOLD - Price can grow to resistance line of wedge patternHi guys, this is my overview for XAUUSD, feel free to check it and write your feedback in comments👊
Some time ago price bounced from $3390 level and declined, but soon turned back and even entered to resistance area.
After this, the price dropped from this area and then started to grow inside the wedge, where it at once made an impulse up.
Price reached $3390 level one more time and broke it, after which it continued to grow to the resistance line of the wedge.
When it reached this line, price turned around and in a short time declined below $3390 level, breaking and then made a retest.
Later, Gold broke $3300 level and fell to the support line of the wedge, after which it rose to the resistance area.
Now I expect that Gold can make a correction to almost support line and then bounce up to $3320 resistance line of the wedge.
If this post is useful to you, you can support me with like/boost and advice in comments❤️
Disclaimer: As part of ThinkMarkets’ Influencer Program, I am sponsored to share and publish their charts in my analysis.
Continue to short gold, bears will exert force againAffected by the NFP market, gold fell precipitously, almost giving back 50% of the gains in the previous wave, and the short-selling performance was particularly strong; technically, gold successfully built a double-top structural resistance in the 3365-3363 area in the short term, which played a technical suppression role in the short term. As gold fell, the current short-term resistance moved down to the 3340-3350 area;
On the other hand, although gold began to rebound after falling to around 3312, it clearly showed the characteristics of weak rebound, and it did not even stand above 3340 once, and the long forces were insufficient; and technically, a single lower shadow line was not enough to support the continued rebound of gold, so gold still had the need to retrace the support below from a technical perspective; and once gold fell again, it was very likely to test the 3305-3295 area again.
So I think we can take advantage of the rebound of gold to short gold again. We can still short gold with the 3340-3350 area as resistance and look at the target area: 3315-3305-3295.
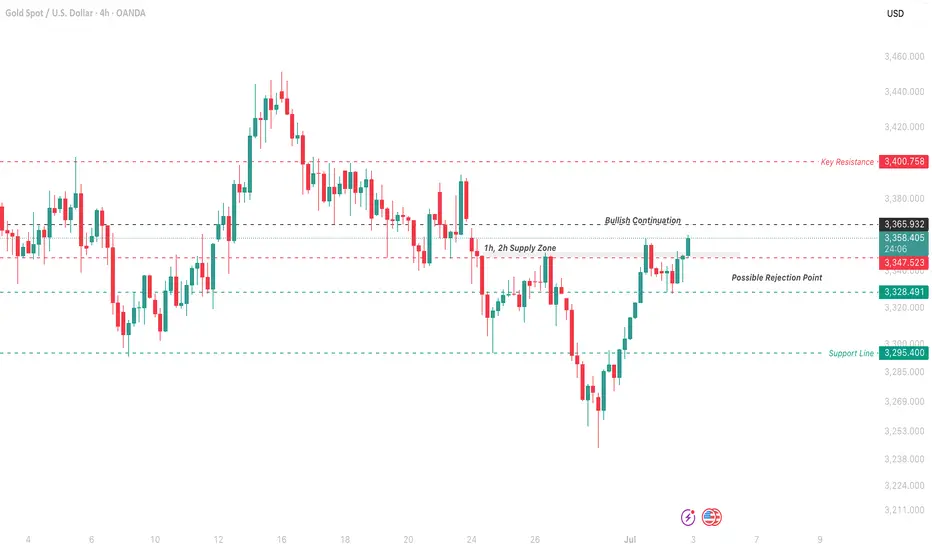
XAU/USD Struggles Below 3366, Bearish Pressure Remains ActiveXAU/USD Tests Supply Zone – Watching 3365 for Bullish Continuation
Gold is climbing amid global uncertainty and U.S. tariff concerns ahead of the July 9 deadline. But strong resistance is still in play.
The price is now testing the 1H–2H supply zone and has pushed past the pivot (3347–3352). A clear 4H close above 3365 will confirm bullish continuation.
Until then, upside remains capped. If price fails to sustain above 3365, a drop back toward 3328 and 3295 is likely.
Key Levels:
Resistance: 3352 – 3365 – 3400
Support: 3328 – 3295 – 3285
Pivot Zone: 3347–3352
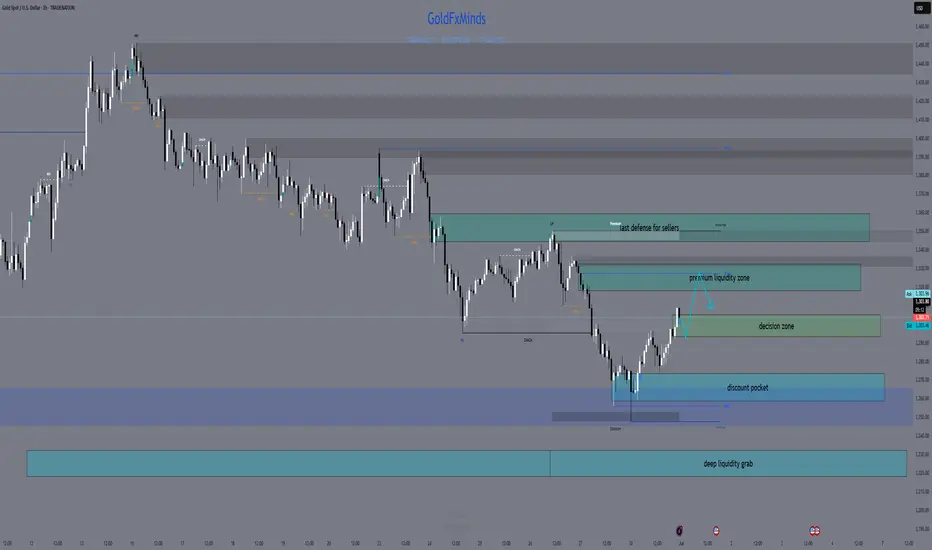
GoldFxMinds XAUUSD Daily Sniper Plan – July 1🌅 Good morning, gold hunters!
The start of a new month is here, and price action is as wild as ever! Yesterday’s liquidity raids swept both sides, leaving most traders guessing – but structure never lies. Let’s break down exactly where the real money sits for July 1, so you never get caught on the wrong side of gold.
🌎 Macro, News & Geopolitics
Macro: US data is in focus (ISM PMI, JOLTS, Powell speech), keeping volatility high and liquidity pools exposed.
Geopolitics: Tensions persist globally but no fresh headlines – market is pure price-driven.
Sentiment: Bulls got trapped high, sellers are hungry for a deeper sweep. Don’t trust easy breakouts!
🏛️ HTF Bias Recap
Weekly: Bullish structure, but overextended. Pullback zones active, buyers get best deals only at true discount.
Daily: Strong wick rejections at supply, sellers showing teeth. Watch for lower highs and failed breakouts.
H4: Range between 3332 and 3258, liquidity building at both edges. Smart money will hunt stops before any trend is real!
🔑 H4 Key Structural Levels
Premium Supply: 3320–3332 (main unmitigated supply block)
Mid Range Decision: 3296–3306 (watch for PA shift, don’t force entries here)
Discount Demand: 3272–3258 (clean OB/imbalance confluence)
Deep Discount Demand: 3232–3218 (ultimate liquidity pocket)
🎯 Sniper Zones (M30/M15 Refined)
SELL Zones:
3320–3332:
The untouched supply – only sell if PA prints a reversal after a NY liquidity grab. Don’t jump in early!
3345–3360:
Extreme extension zone. If price overreaches, look for signs of exhaustion. This is the bear’s last stand!
BUY Zones:
3272–3258:
True discount! Wait for a stop run below 3275, then catch the bounce ONLY if you see confirmation (engulfing, CHoCH, RSI support).
3232–3218:
No hope trades here. Only for flash crash or panic sell-offs with obvious absorption! Wait for a real PA reversal.
Decision Zone:
3296–3306
If price is stuck here, sit on your hands! Let the market show its hand first.
🚦 Quick Recap
Avoid already-mitigated zones – only hunt where liquidity is fresh!
NY session wicks and fake breakouts are the biggest traps. Be patient, let the stop hunt finish before you engage.
Confirmation over prediction. Discipline is your edge, not drawing boxes.
🎁 Bonus Tip
"Missing a sniper entry? The best traders never chase. Let gold come to you. There’s always a second chance for those with patience!"
📣 Like what you see?
Smash that like🚀🚀🚀 , drop your thoughts in the comments , and don’t forget to follow GoldFxMinds for more high-precision gold plans!
Analysis powered by Trade Nation chart feed – built for the sharpest minds in gold.
GOLD GOLD ,NEWYORK buyers stopped yesterday at 3355-2256 to respect a 45min and daily supply roof from our structure ,reclaiming 3355-3358 will be a sign that we can move into 3400 without stress.
on daily TF 3355-3358 remains resistance to upswing on daily candle close from my line chart.daily break will be watched .
dollar broke monthly demand floor and heading down is possible as the green back is hit by president trump continued attack on sir powell,putting the fed true independence at risk before investors and carry traders across the globe.
the current trillions of dollars addition national debt will affect the dxy and could weaken the fed inflation 2% mandate.
lets watch 3330-3329 for make or break.my aim is to watch 3300-3302 and from higher sell zone i will be watching 3378=3385 zone which will be leading into 2400 zone if sustain buying persist.

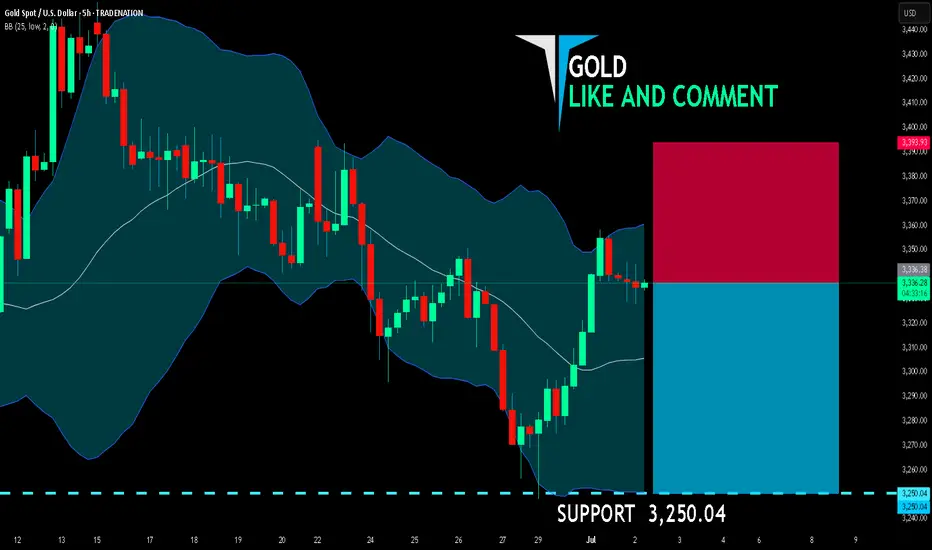
GOLD BEARS ARE STRONG HERE|SHORT
GOLD SIGNAL
Trade Direction: short
Entry Level: 3,336.38
Target Level: 3,250.04
Stop Loss: 3,393.93
RISK PROFILE
Risk level: medium
Suggested risk: 1%
Timeframe: 5h
Disclosure: I am part of Trade Nation's Influencer program and receive a monthly fee for using their TradingView charts in my analysis.
✅LIKE AND COMMENT MY IDEAS✅
GOLD GOLD came to my supply roof early and reacted and 3350 -3352 .the current sell have 100pips and could hold price untile broken.
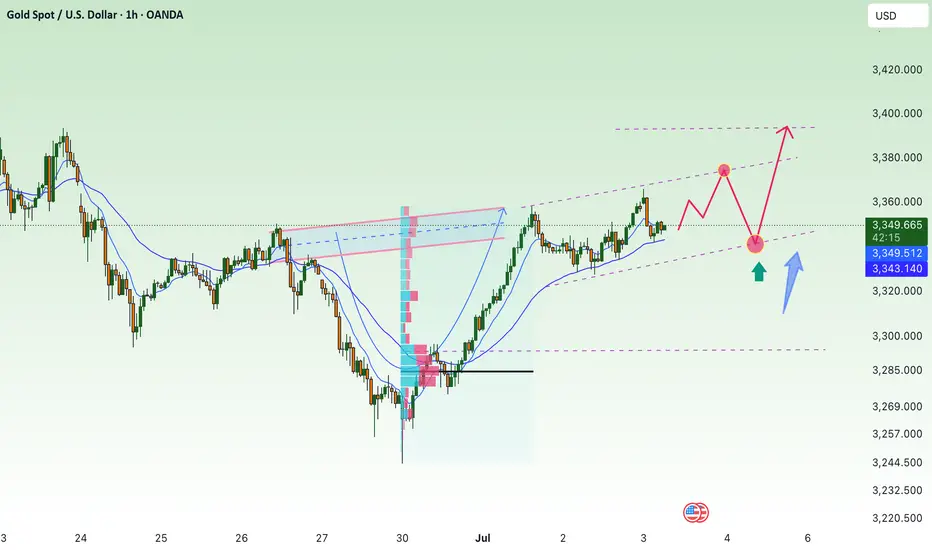
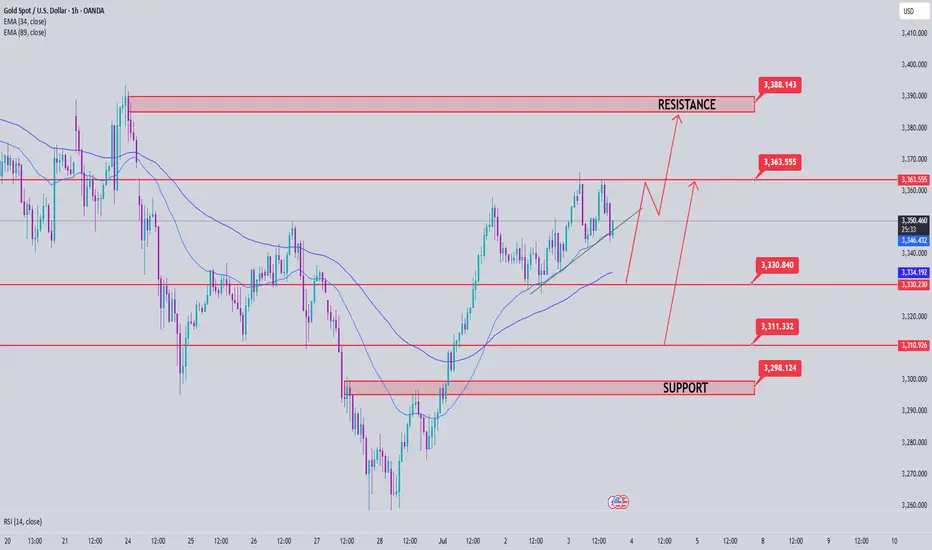
Gold Price Analysis July 3GOLD Technical Analysis - D1 Frame
On the D1 frame, the uptrend is still being maintained with momentum towards the price gap zone. During the European session, selling pressure started to appear around the resistance zone of 3365 - showing that this is the area where the sellers are making counter-moves.
On the chart, the gold price is accumulating and forming a triangle pattern, indicating the possibility of a strong movement phase.
If the price breaks the upper border of the triangle (above the 3363 zone), it will likely open up an opportunity to approach the next resistance at 3388.
On the contrary, if it breaks the lower border (below the 3330 zone), the correction trend may be triggered, heading towards deeper support zones.
Important Zones:
Resistance: 3363 – 3388
Support: 3330 – 3311 – 3297 – 3277
Trading Strategy:
BUY Breakout: When price breaks above 3363
SELL Breakout: When price breaks below 3330
Gold Trading Strategy July 3✏️D1 candle continues to increase towards the price gap zone. At the beginning of the European session, sellers accept to enter the market at this resistance price zone around 3365. The accumulation pattern of gold price is forming a triangle pattern.
The lower boundary is broken, it will lead to the breakout point of the lower boundary and vice versa, if the upper boundary of the triangle is broken, the price will move towards the next resistance.
📉 Key Levels
Resistance: 3388-3363
Support: 3330-3311-3297-3277
Buy trigger: breakout above 3363
Sell trigger: breakout below 3330
If this idea resonates with you or you have other ideas, please comment. I look forward to reading your thoughts!
Best regards, VHT Traders!
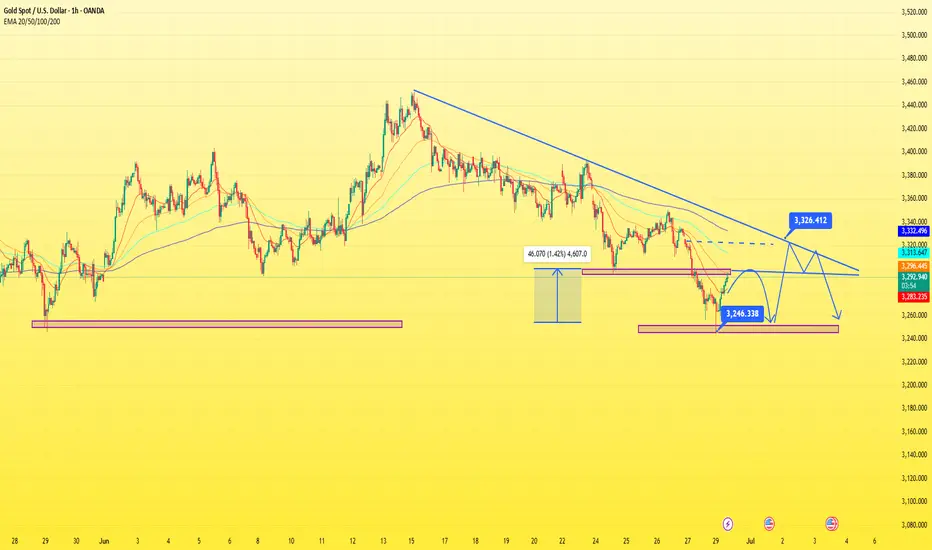
Maintain gold selling pressure at the beginning of the weekXAU / USD trend forecast JUNE 30, 2025
⚠️Gold (XAU/USD) extends its slide to the $3,265 zone in early Asian trade Monday, plumbing near one-month lows as risk appetite returns to the forefront. A breakthrough US-China rare earth agreement, hailed by markets, has tempered safe-haven demand, sending bullion lower. The ceasefire pact between Iran and Israel further fuels the risk-on tone. With the metal under pressure, traders now turn their focus to upcoming Fedspeak for direction, as rate path clarity remains elusive.
⚠️Gold prices continue to move below 3300, still mostly consolidating in a bearish range as Middle East peace talks move forward
🚨/// SELL XAU : zone 3327-3330
SL: 3335
TP: 50 - 100 - 300pips ( 3300 )
🚨/// BUY XAU : zone 3245 - 3248
SL: 3240
TP: 50 - 100 - 300pips ( 3275 )
When you make enough money, there is nothing you can't do.
GOLD The ADP Non-Farm Employment Change report for today showed a surprising decline of 33,000 jobs, well below the forecast of a 99,000 forecast and down from the previous month’s modest gain of 29,000 jobs.
Key Details:
This negative figure indicates that private businesses in the US shed 33,000 jobs in June, marking a contraction in private-sector employment—the weakest report since March 2023.
The report is produced by the ADP Research Institute, which uses anonymized payroll data from about 26 million workers to estimate private-sector employment changes ahead of the official government Non-Farm Payrolls (NFP) report.
The decline reflects ongoing uncertainty among employers amid policy and economic challenges, including tariff impacts and consumer caution.
Market Implications:
The unexpected job losses may raise concerns about the health of the US labor market and the broader economy.
This data could increase expectations for Federal Reserve rate cuts or a more dovish stance, potentially weighing on the US dollar and boosting safe-haven assets like gold and silver.
However, the ADP report often diverges from the official NFP, so markets will closely watch the upcoming government jobs data for confirmation.
In summary:
June’s ADP report revealed a contraction of 33,000 private-sector jobs, far below expectations, signaling caution in US labor market hiring and adding uncertainty to the economic outlook ahead of the official payrolls release.
#gold #xauusd
