XAUUSD: Bearish Trend, Key Support at $3,295Market Overview
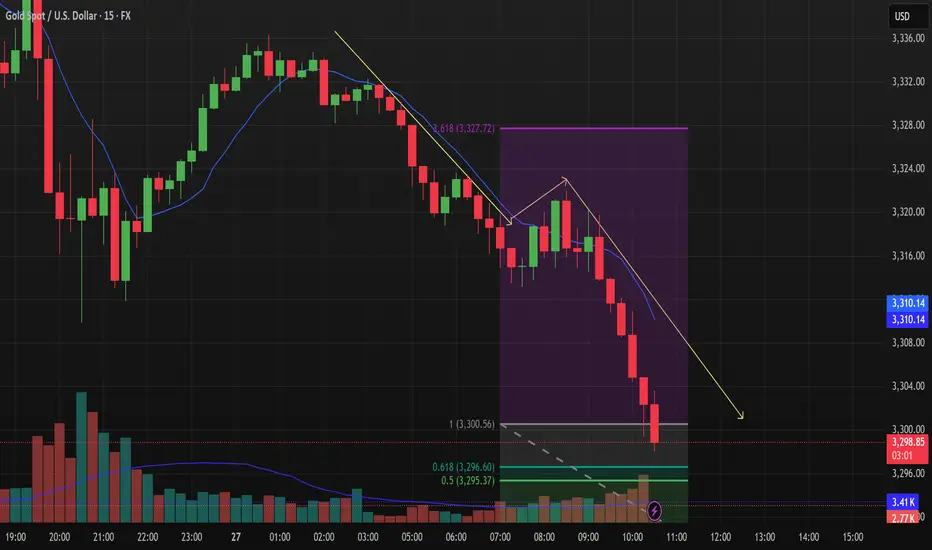
In today’s trading session (26/06/2025), XAUUSD shows continued downward momentum. Gold prices are currently hovering around $3,302.05, with a slight drop of 0.01%. The intraday price range has been tight, between $3,330.00 and $3,350.00, indicating a battle between the buyers and sellers around the short-term equilibrium zone.
Recent price action suggests that after a brief recovery, gold is once again encountering resistance at the $3,350.00 level. In the coming hours, a decisive breakout either above this resistance or below current support will dictate the market’s next move.
Key Technical Levels to Watch:
Support Levels: The first significant support is at the $3,295.37 level (50% Fibonacci retracement), with the next support at $3,296.60 (61.8% Fibonacci retracement), followed by a crucial level at $3,300.56.
Resistance Levels: The primary resistance area lies around $3,350.00, with the second resistance at $3,327.72, which coincides with the 3.618 extension of the previous price swing.
Price Action Analysis
As seen in the chart, XAUUSD is currently trading below both the 50-period (blue) and 200-period (yellow) moving averages, indicating a strong bearish trend. The price action is forming a series of lower lows and lower highs, reinforcing the downtrend.
Bearish Trend Continuation: A break below the support at $3,295.37 could signal further downside towards $3,290.00 or even $3,275.00. The yellow trendline indicates the overall bearish direction, and any failure to hold above $3,300.00 could trigger additional selling pressure.
Fibonacci Retracement Levels: Price is testing the 50% and 61.8% Fibonacci levels. A rejection at these levels could cause a pullback towards lower support zones, confirming the bearish outlook for the short term.
Volume Analysis
The volume chart shows relatively low volatility, with decreasing volume during the price pullbacks. This suggests that there is not enough buying interest to push the price higher, and the market may be more inclined towards bearish continuation in the near term.
Market Sentiment
Currently, the market is undecided. The recent price action suggests that traders are waiting for a confirmation of direction. The next few hours are critical in determining if the downtrend will continue or if we will see a short-term bounce at one of the key support levels.
Trading Strategy
Short Position: A break below $3,295.37 would be an excellent opportunity to short XAUUSD with a target at $3,290.00, and further down to $3,275.00.
Long Position: Only consider long positions if XAUUSD manages to break above $3,350.00 decisively, with the next target near $3,375.00.
Conclusion
XAUUSD remains under pressure, and unless there’s a strong reversal at support levels, the bearish momentum could continue in the short term. Traders should monitor the key levels mentioned above closely to adjust positions accordingly.
XAUUSD.F trade ideas
GOLD BEARISH BIAS|SHORT|
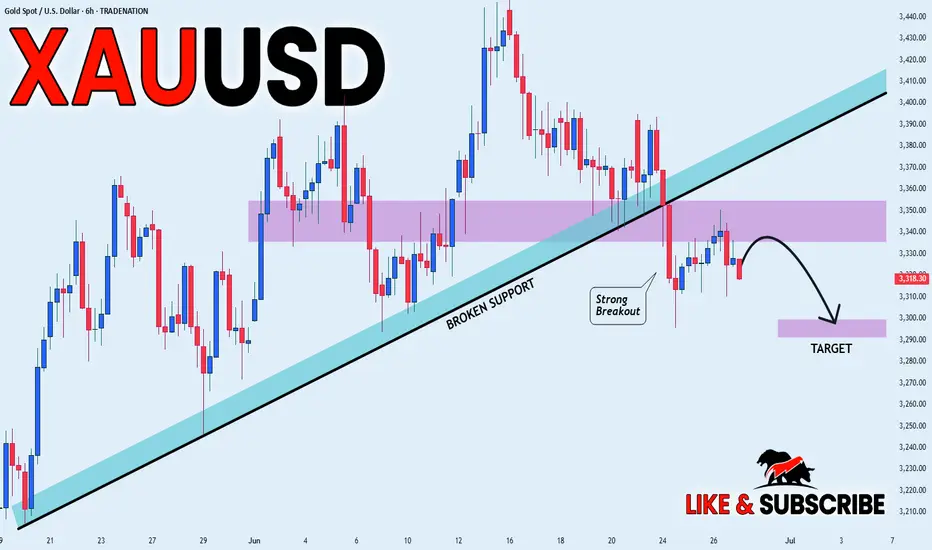
✅GOLD has printed some
Lower high and lower lows
So despite a long-term uptrend
We are locally bearish biased
Which is reinforced by the recent
Bearish breakout of both the
Rising and horizontal support lines
So we will be expecting a
Further bearish move down
With the target of retresting
The key structure below around 3,300$
SHORT🔥
✅Like and subscribe to never miss a new idea!✅
Disclosure: I am part of Trade Nation's Influencer program and receive a monthly fee for using their TradingView charts in my analysis.
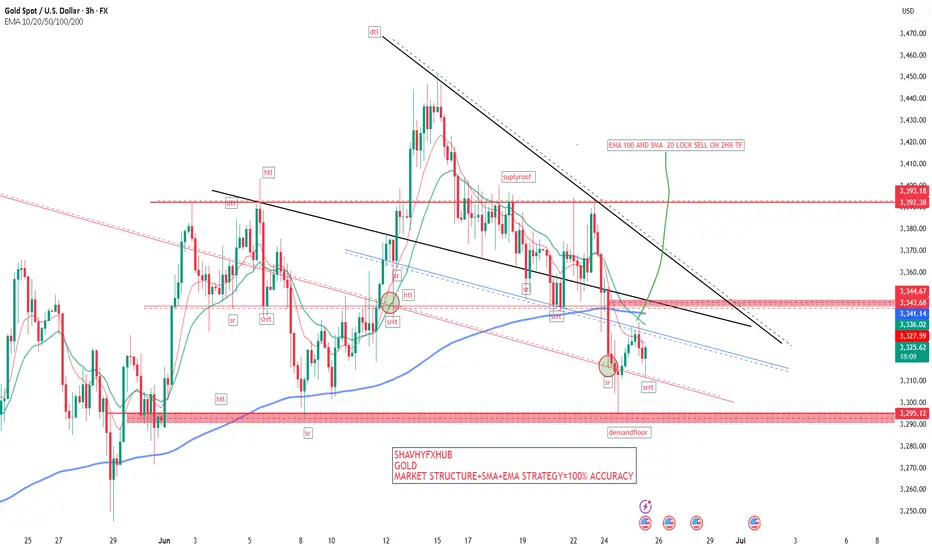
GOLD GOLD ,MARKET STRUCTURE +SMA+EMA =100 % accuracy without fundamental news out break.
but with news doesn't work best.
gold lower level buy at 3314 -3318 is valid based on 3hr structure.
Gold: Resistance Validated, Short at 3340-3350 Tomorrow📈 Gold Trading Recap & Tomorrow's Strategy: Resistance Holds, Short Opportunities Persist
💎 Today's newly updated live short strategy hit the TP target successfully! As mentioned earlier, when gold failed to break the support level, we anticipated it to range around 3330—today's trades were precisely centered on this logic. The 3350 resistance was also validated firmly during the session.
💎 Expect further upside in tomorrow's Asian session—recommend continuing short positions within the 3340-3350 range 🚀
🚀 Sell@3350 - 3345
🚀 TP 3335 - 3325 - 3315
Accurate signals are updated every day 📈 If you encounter any problems during trading, these signals can serve as your reliable guide 🧭 Feel free to refer to them! I sincerely hope they'll be of great help to you 🌟 👇
Gold Potential UpsidesHey Traders, in today's trading session we are monitoring XAUUSD for a buying opportunity around 3,300 zone, Gold is trading in an uptrend and currently is in a correction phase in which it is approaching the trend at 3,300 support and resistance area.
Trade safe, Joe.
Will the 3300 support hold today?Due to the sudden ceasefire agreement between Iran and Israel today, the gold market quickly flipped from bullish to bearish — when gold tested the 3300 support level just now, it rebounded near 3315 📈.
It may challenge the 3290-3300 support range again later: if it effectively breaks below, the next target is the strong support at 3265, and it may eventually dip to 3200 before starting a rebound 🔄.
If the breakout fails, it may consolidate near 3330, waiting for further market guidance 📊
⚡️⚡️⚡️ XAUUSD ⚡️⚡️⚡️
🚀 Sell@3330 - 3320
🚀 TP 3310 - 3305

GOLD DAILY CHART UPDATEHey Everyone,
Great finish to the week across all our multi timeframe analysis.
We updated our 1H chart throughout the week catching the buys from the dips using our levels and ema5 cross and lock allowed us to track the movement with confirmation.
This is now an end of week update on our daily chart idea. This chart shows our perfect play into the channel top and then rejection for the movement down. We used our smaller timeframe charts to catch the bounces from this movement down.
Following up on our previous analysis, price action has continued to respect our Goldturn channel beautifully. The key takeaway here is that the channel levels are being respected with precision, validating the strength and reliability of our Goldturn channel framework.
We’ll be back now on Sunday with our multi-timeframe analysis and trading plans for the week ahead. Thanks again for all your likes, comments, and follows.
Wishing you all a fantastic weekend!!
Mr Gold
GoldViewFX

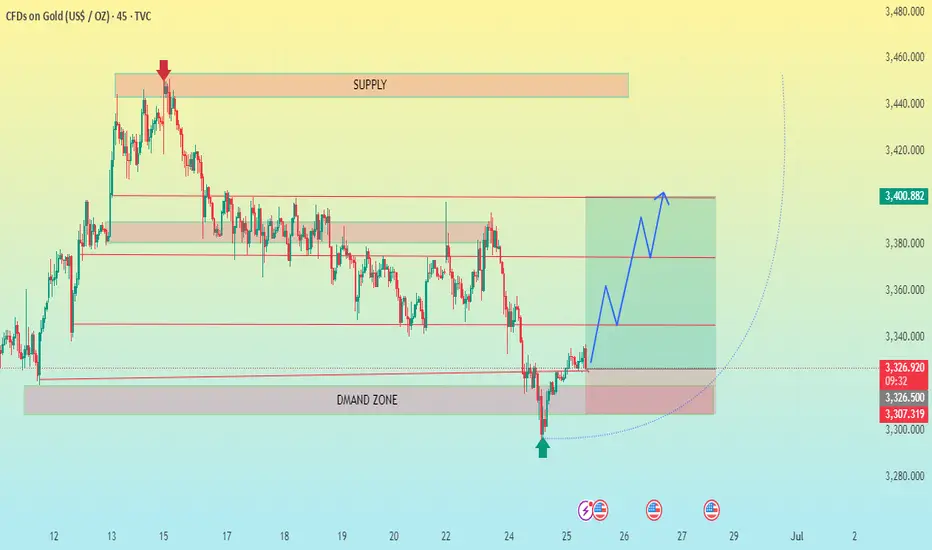
XAU/USD GOLD 45 MINUTR CHART PATTERN Here's a clear summary of your XAU/USD (Gold) 45-Minute Buy Trade Setup:
---
✅ Trade Type: Buy
⏱ Timeframe: 45 Minutes
📍 Entry Point: 3322.9
---
🎯 Take Profit Targets:
TP1: 3345
TP2: 3374
TP3: 3400
---
🛑 Stop Loss: 3307
---
📈 Risk/Reward Snapshot:
Risk (Entry to SL): 3322.9 – 3307 = 15.9 points
TP1 R:R: (3345 – 3322.9) / 15.9 = ~1.39
TP2 R:R: (3374 – 3322.9) / 15.9 = ~3.22
TP3 R:R: (3400 – 3322.9) / 15.9 = ~4.85
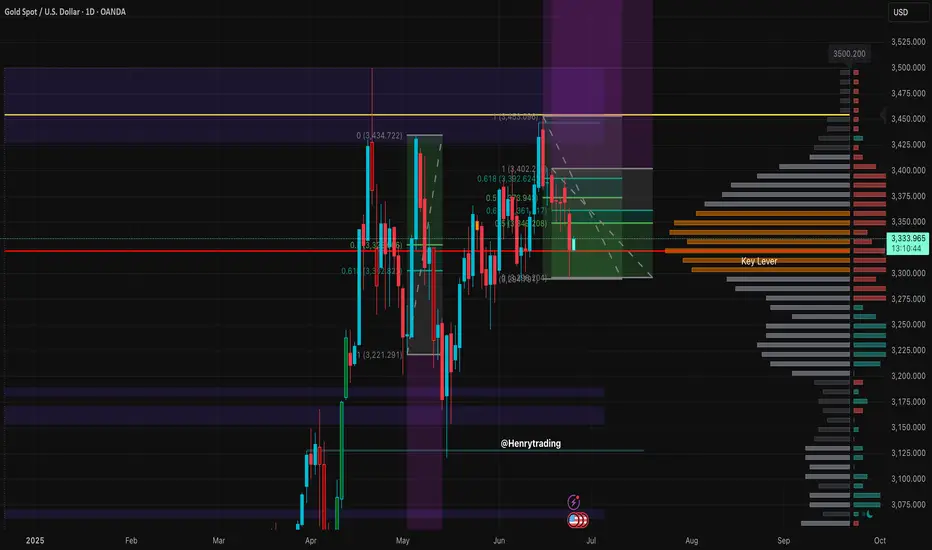
Trading Strategy (XAUUSD) – June 25, 2025 After a sharp decline in the previous session, XAUUSD has shown a mild recovery and is currently trading around 3,332 USD. However, price action suggests this could merely be a pullback within a broader downtrend, as gold has yet to break above the key resistance zone.
Technical Analysis
Price Action
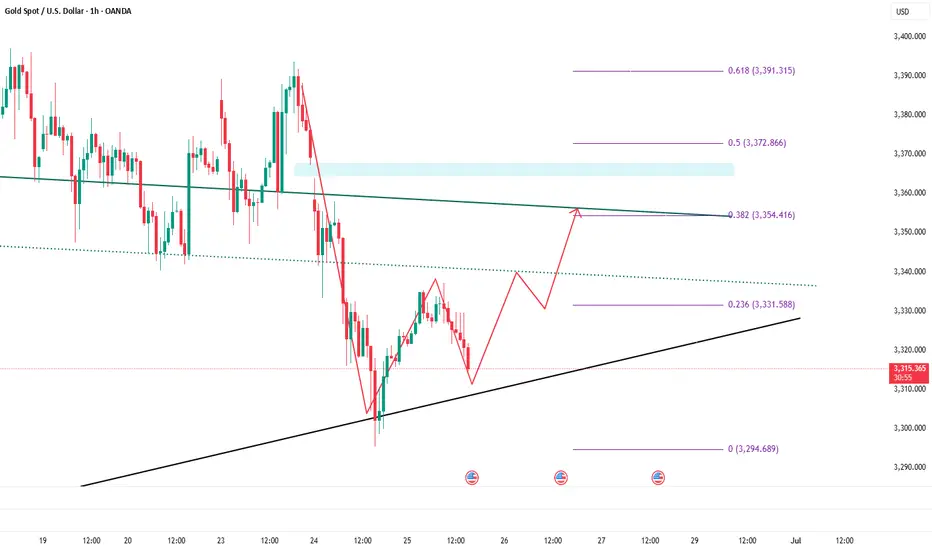
Gold has bounced from the support zone between 3,291 – 3,317 USD, which has historically acted as a strong demand area. This zone also aligns with the Fibonacci 0.382 retracement from the previous bullish leg.
However, XAUUSD remains below the key resistance zone at 3,373 – 3,392 USD, which is a confluence of:
- The Fibonacci 0.618 retracement from the most recent downtrend
- A historical supply zone that has been rejected multiple times
- The upper boundary of the sideways range formed since May
- If price fails to break through this zone in the coming sessions, the risk of continued downside remains high.
RSI Indicator
- The RSI (14) is currently hovering around the neutral zone (49–54), indicating that the rebound lacks the strength needed to confirm a trend reversal.
- The RSI has not crossed above the 55 threshold, suggesting the dominant trend is still bearish.
Key Technical Levels to Watch
Resistance:
- 3,373 – 3,392 USD: Confluent resistance zone (Fibonacci 0.618 + prior supply zone)
- 3,435 – 3,452 USD: Major swing high, a key medium-term reference level
Support:
- 3,291 – 3,317 USD: Immediate support zone, still holding strong
- 3,250 – 3,224 USD: Potential downside target if the bearish momentum resumes
Suggested Trade Setups
Scenario 1 – Buy if price holds above 3,291 and shows confirmation signals
Entry: 3,295 – 3,300 USD
Stop-loss: Below 3,289 USD
Take-profit: 3,340 – 3,355 – 3,370 USD
Conditions: Must show clear bullish reversal patterns (Pin Bar, Bullish Engulfing) on H1 or H4 timeframe
Scenario 2 – Sell if price rejects from resistance zone with confirmation candle
Entry: 3,370 – 3,375 USD
Stop-loss: Above 3,392 USD
Take-profit: 3,330 – 3,310 – 3,290 USD
Conditions: Clear bearish rejection candle + declining volume
Note: XAUUSD is currently in a technical rebound phase after a strong drop but lacks solid reversal confirmation. Traders should closely monitor the price reaction near the 3,373 – 3,392 USD resistance zone over the next sessions. This area will determine whether the downtrend will resume or a reversal begins.
Stay tuned for more daily trading strategies, and make sure to save this analysis if you find it helpful for your trading plan.
Strategy analysis by @Henrybillion
6.24 Gold safe haven fades and gold falls
Technical aspect: After the gold price hit the 3400 integer mark overnight, it fell rapidly under the impetus of negative news. The overall fluctuation range is still within the 3330-3400 range we expected. This shows that the current market dominated by news lacks continuity. We make a golden section of the high and low points of the overnight decline to the current level, and the current position of 0.618 is 3370.
Pressure level: 3370\3375\3400
Support level: 3330\3300
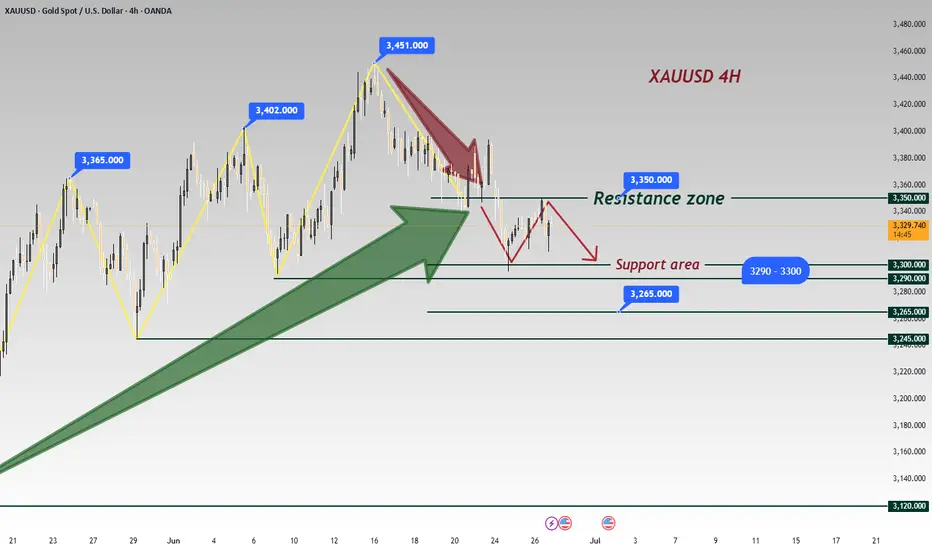
XAUUSD - Breakdown: - RISK OFF - Gold BearsGOLD has reached my previous analysis target ✅
Now seeing a pullback wave before potential continuation to the downside, keep in mind it is End of Month.
🎯 Pullback Zones:
1️⃣ 3340
2️⃣ Extended: 3350–3356
📉 If no new bullish fundamentals:
Next targets: 3293–3280
#XAUUSD #Gold #TechnicalAnalysis #Forex #Commodities #TradingLevels #MarketOutlook
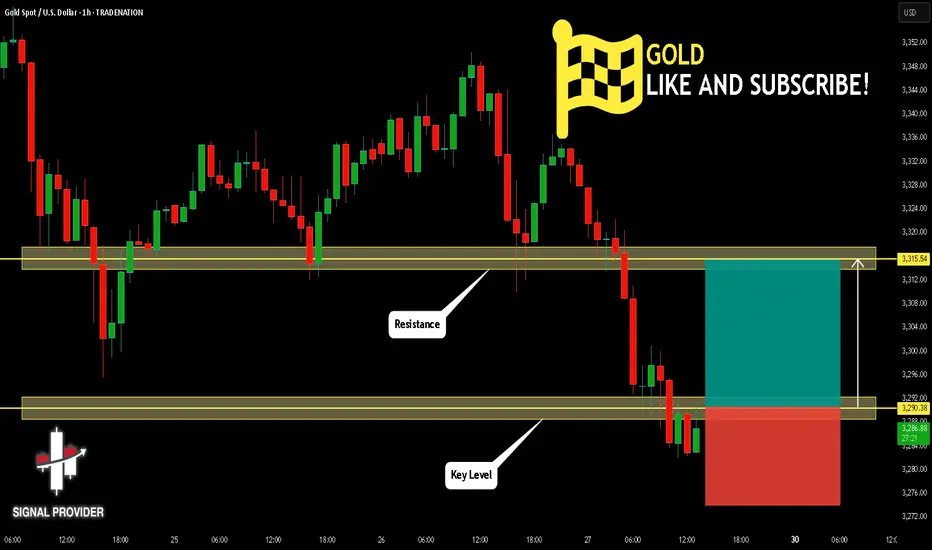
GOLD Will Grow! Long!
Here is our detailed technical review for GOLD.
Time Frame: 1h
Current Trend: Bullish
Sentiment: Oversold (based on 7-period RSI)
Forecast: Bullish
The market is trading around a solid horizontal structure 3,290.38.
The above observations make me that the market will inevitably achieve 3,315.54 level.
P.S
We determine oversold/overbought condition with RSI indicator.
When it drops below 30 - the market is considered to be oversold.
When it bounces above 70 - the market is considered to be overbought.
Disclosure: I am part of Trade Nation's Influencer program and receive a monthly fee for using their TradingView charts in my analysis.
Like and subscribe and comment my ideas if you enjoy them!
Gold bulls pay attention to risk aversionGold bulls pay attention to risk aversion
Today, the price of gold still has a large room for decline, and bulls need to pay attention to risk aversion.
When the price of gold hovered around $3,330, bulls began to rise collectively, as if the Federal Reserve was going to cut interest rates tomorrow and a world war was about to break out in the Middle East.
Wake up! Is this kind of fluctuation worthy of being called a market?
1. The "risk aversion sentiment" that bulls hyped up to the sky has long cooled down
Israel and Iran are no longer able to fight again, and Trump also said that both sides are "exhausted", but gold is still pretending to be "risk aversion"?
I laughed to death, do you really think the market is stupid?
Red Sea shipping friction? This matter has been hyped for half a year, should gold rise? No! This shows that the market does not buy it at all.
2. Expectations of a rate cut by the Federal Reserve? Don't dream!
If the PCE data tonight is higher than expected, the price of gold will dive directly.
Now the hawkish voices within the Federal Reserve are getting stronger and stronger. Powell said that "interest rate cuts may be possible", but what is the actual situation? Inflation data rebounded slightly, and gold prices suffered a heavy blow.
3. Technical aspects?
This is just the last fig leaf for the bulls. 3300 support? Any negative data will destroy it.
Gold is now in a volatile market, with both ups and downs, and it is completely dependent on news support.
If the PCE data is negative tonight, 3250 points will definitely be broken.
At that time, the bulls will find an excuse to say "the adjustment is temporary."
Wake up and avoid risks quickly.
Suggestions:
The 3300 support level of gold price becomes a pressure level
If it falls below $3,300, try to short gold at a high level. The stop loss is set in the 3300-3310 range
The support level below the gold price: 3250-3200-3165
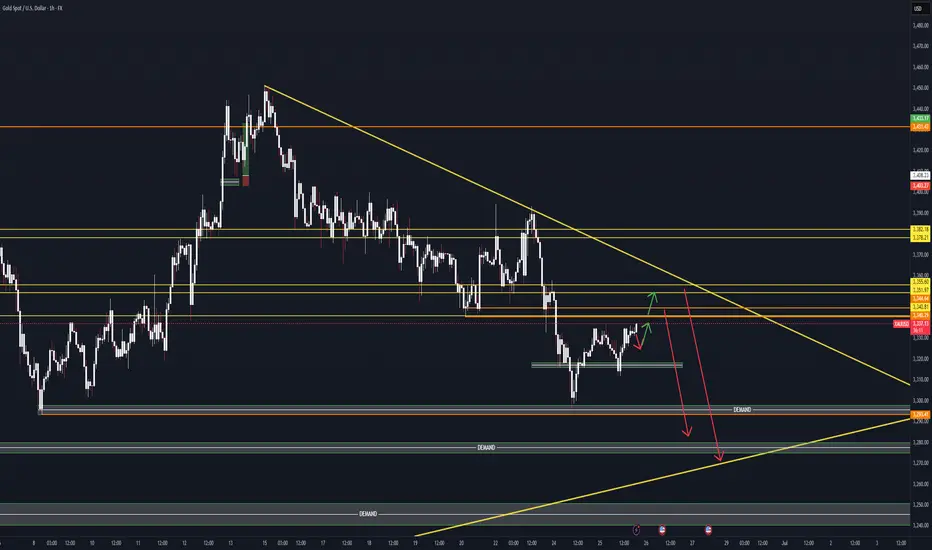
HelenP. I Gold may continue to decline to support levelHi folks today I'm prepared for you Gold analytics. After dropping from the support zone, the price of Gold found temporary support near the trend line and started to rise again. The upward movement was sharp and even created a gap while breaking through the previous support level, which then acted as resistance. For some time, the price hovered around this resistance area but failed to gain enough strength to break higher. Eventually, Gold pulled back to the trend line and began consolidating within a triangle pattern. Inside this structure, it managed to break above the resistance zone again, but this breakout turned out to be false. The price quickly reversed and dropped, breaking through the resistance level and exiting the triangle to the downside. This breakdown also shows that the bullish momentum has weakened significantly. Now, Gold is trading near the trend line again, showing hesitation and a lack of strong bullish continuation. Given this technical behavior, I expect a small rise toward the trend line, followed by a continued drop toward the support level at 3320. That’s the area I’m watching as my current goal. If you like my analytics you may support me with your like/comment ❤️
Disclaimer: As part of ThinkMarkets’ Influencer Program, I am sponsored to share and publish their charts in my analysis.

Gold stalls below $3350 as USD weakness continuesGold remains delicately balanced as traders in Asia and Europe proceed with caution. Despite recent USD weakness lending some support, buyers haven’t broken above $3350.
📉 USD Weakness & Market Sentiment – Fragile Recovery?
🔻 Dollar Wobbles: Talk of Fed leadership change is stirring doubt over the USD’s trajectory, adding political risk that may benefit gold.
⚖️ Mixed Sentiment: Gold consolidates in a tight range after early‑week drop. With PCE data and Fed speeches ahead, traders await the next catalyst.
📊 Technical Structure – Consolidation Underway
Gold trades below short‑term EMAs, hinting at a bearish pause or stealth accumulation. Current levels near $329X.
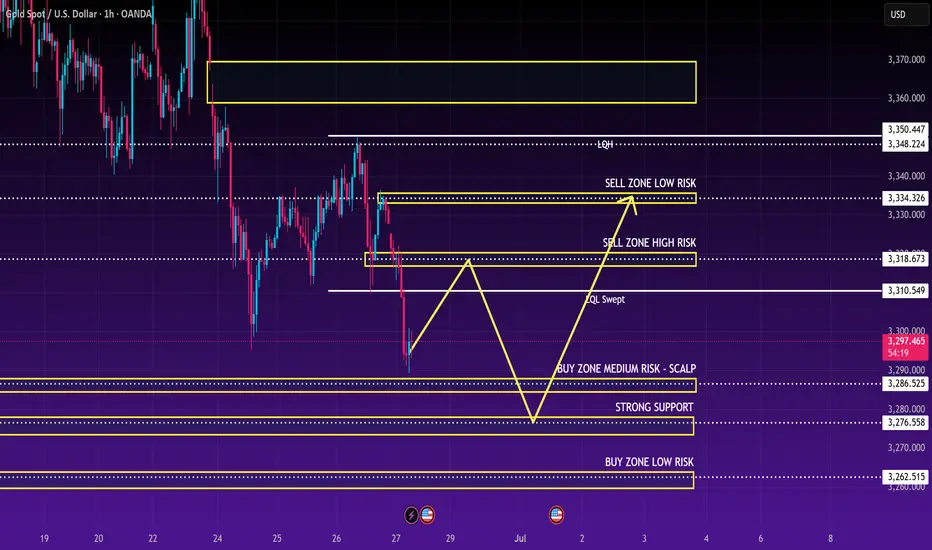
Key Zones:
🟢 Demand (Buy): $3264 / $3276 / $3294
🔴 Supply (Sell): $3313 / $3321 / $3330 / $3341
🎯 Intraday Trading Plan:
🛒 BUY ZONE: $3264–$3266 (SL: $3270; TPs: $3280 → … → $3320)
⚡️ BUY SCALP: $3282–$3284 (SL: $3278; TPs: $3288 → … → $3330)
📉 SELL ZONE: $3331–$3333 (SL: $3337; TPs: $3326 → … → $3300)
⚠️ SELL SCALP: $3313–$3315 (SL: $3320; TPs: $3310 → … → $3280)
🧭 Watchlist: Friday’s PCE, Fed commentary & Middle East tensions may sway price.
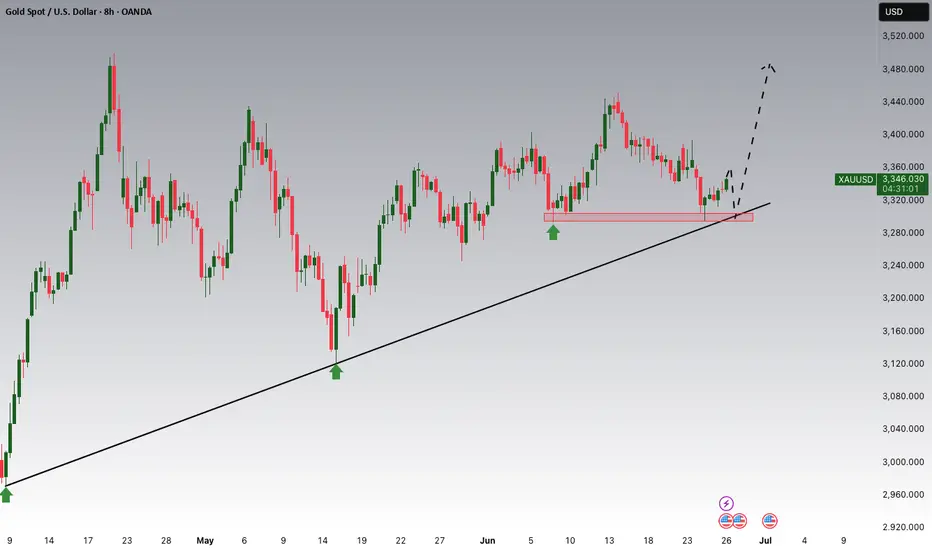
Start going long on goldAlthough gold is under pressure and weak at present, gold still rebounded near 3295 under the influence of yesterday's major negative news, proving that there is still a large amount of buying funds below, limiting the retracement space of gold; and from 3295 to 3335, there is still a rebound space of $40, proving that gold is not extremely weak. Moreover, there is a gap left above, and there is a technical need to rebound to fill the gap;
In addition, yesterday gold fell sharply due to news, and there should be many longs trapped in the market. If gold is relatively stable, there may be self-rescue behavior of the trapped longs, so gold longs still have the opportunity to rebound to 3340-3350. At present, the main focus is on the short-term support area of 3315-3305, and we can moderately consider going long on gold in this area.
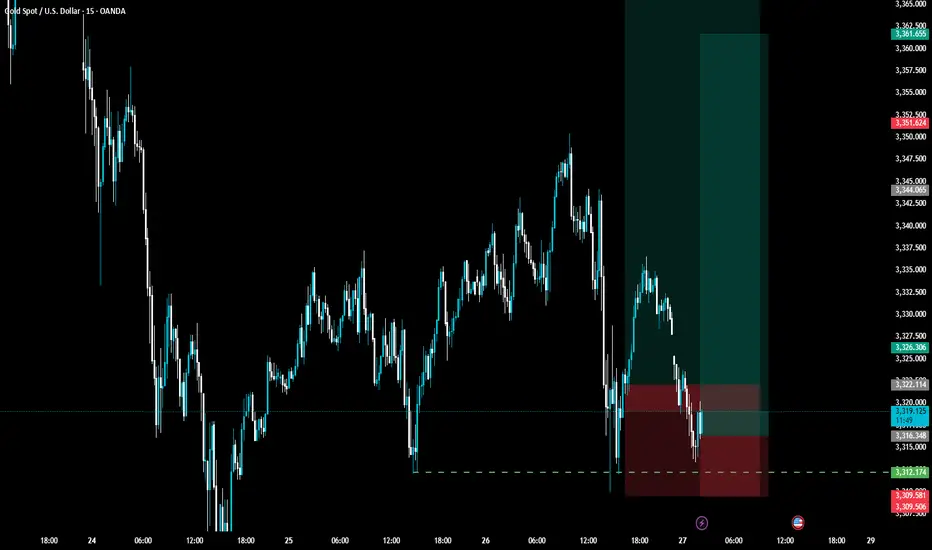
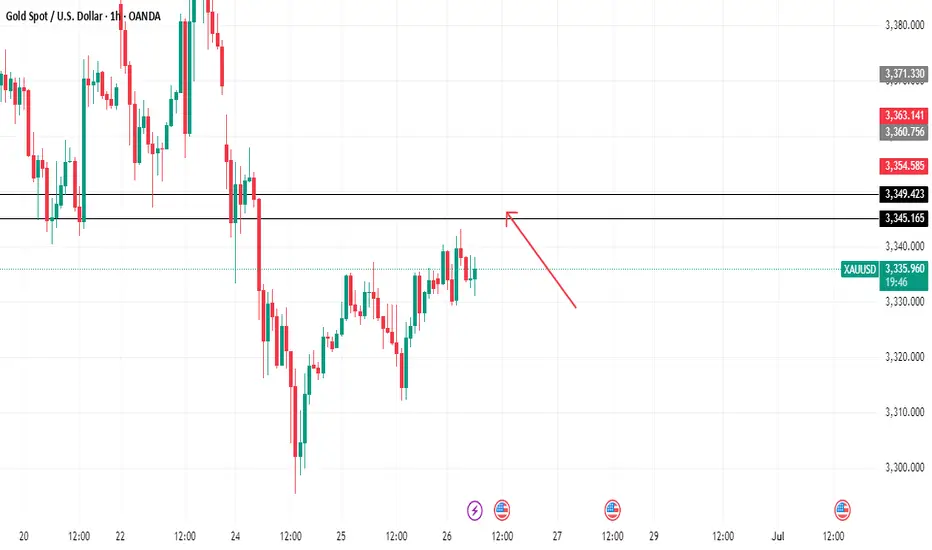
XAUUSD - Local Bearish Trend and Retest of Support-ResistanceOverall Trend:
The chart shows that Gold (XAUUSD) has been in a downtrend over the depicted period, particularly after a significant drop around June 24th/25th from the higher price levels (around 3348-3350). While there have been attempts at recovery, the price has generally been making lower highs and lower lows, indicating bearish momentum.
Key Observations and Potential Entry Points:
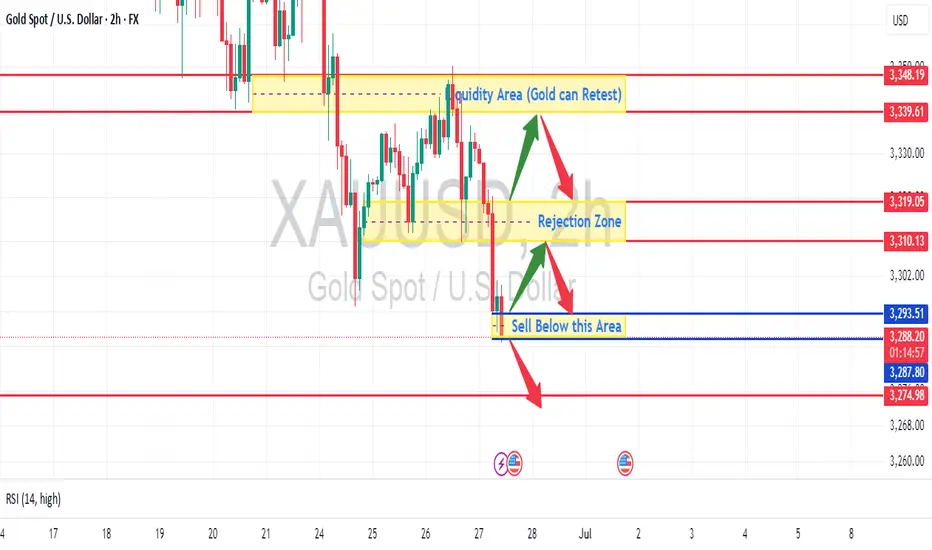
Liquidity Area (Resistance/Potential Retest Zone): -The yellow shaded area marked "Liquidity Area (Gold can Retest)" between approximately 3330 and 3348 acted as a strong resistance zone after the initial drop.
Potential Entry (Short): If the price were to rally back into this "Liquidity Area" and show clear signs of rejection (e.g., bearish candlestick patterns like pin bars, engulfing patterns, or failure to break above it), it would be a strong point to consider a short (sell) entry. The red arrow indicates this possibility.
Rejection Zone (Current Resistance): - The yellow shaded area marked "Rejection Zone" around 3310-3319 is currently acting as a significant resistance. The price has attempted to break above it multiple times and has been rejected.
Potential Entry (Short): This area also presents a potential short (sell) entry if the price retests it and shows clear signs of rejection. The current candle is below this zone, indicating the rejection has already occurred.
"Sell Below this Area" (Breakdown Point): - The blue shaded area around 3293.51 - 3287.80 is highlighted as a critical support level.
Strong Point to Enter Trade (Short): - The chart explicitly labels this as "Sell Below this Area." If the price breaks convincingly below this support level (with strong bearish candle close below and follow-through), it would be a high-conviction short (sell) entry point. This indicates a potential continuation of the downtrend to lower targets. The red arrow signifies this downward move.
RSI (Relative Strength Index): - The RSI (14) is currently at 28.33. This indicates that Gold is approaching or is in oversold territory. While oversold conditions can sometimes precede a bounce, in a strong downtrend, prices can remain oversold for extended periods. It's crucial to combine RSI with price action. If the price breaks below the "Sell Below this Area" with an already oversold RSI, it might suggest a strong bearish momentum overwhelming any immediate bounce.
Trade Entry Strategy Summary:
Aggressive Short Entry: Consider a short if the price retests the "Rejection Zone" (3310-3319) or the higher "Liquidity Area" (3330-3348) and shows clear bearish rejection.
Confirmation Short Entry (Strongest Signal): The most robust short entry highlighted is a confirmed break and close below the "Sell Below this Area" (3293.51 - 3287.80). This would signal a continuation of the bearish momentum.
Important Considerations:
Risk Management: Always define your stop-loss order (e.g., above the rejection zone or above the breakdown level) to limit potential losses.
Target Levels: While not explicitly marked with targets, after a breakdown, look for previous swing lows or significant psychological levels as potential profit targets. The red line at 3274.98 could be an initial target if the "Sell Below this Area" is breached.
Confirmation: Always wait for candlestick confirmation (e.g., a strong bearish close) before entering a trade.
Timeframe: This is a 2-hour chart. The analysis is valid for this timeframe, but always consider higher timeframes for broader trend confirmation.
News/Fundamentals: While this is a technical analysis, be aware of any upcoming economic news or events that could impact Gold prices.
In conclusion, the chart strongly suggests a bearish bias for Gold, with key resistance zones above and a critical support level below that, if broken, could lead to further significant downside.
Disclaimer Warning - Do your own research before trading in Gold, we are not responsible for your loss...
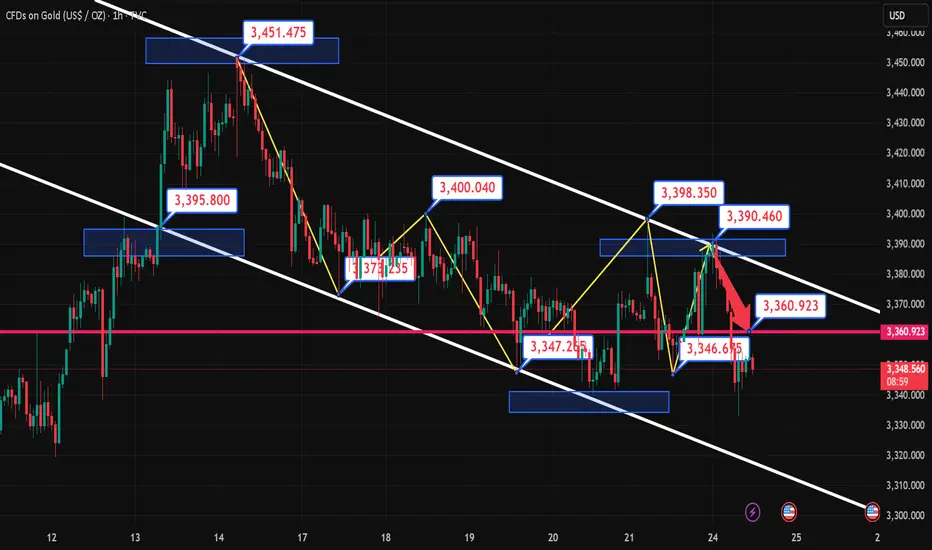
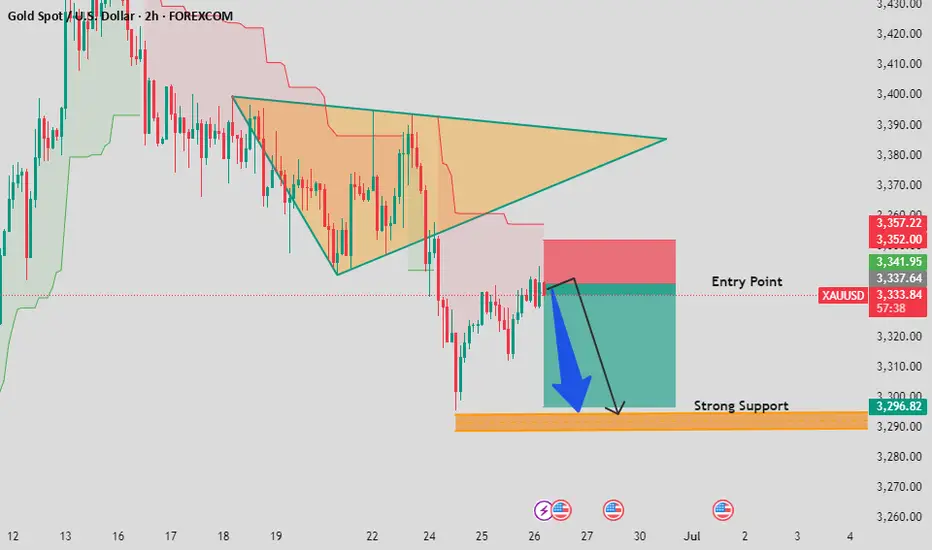
Gold (XAUUSD) Short SetupBearish Breakdown Below Triangle Pattern!
Hey traders! 👋 Gold has broken down from a symmetrical triangle formation, signaling a potential bearish move. Price is currently testing the retest zone near the entry point (~3,335). If the rejection holds, we could see a sharp drop toward the strong support area at 3,296. 📉
🔹 Entry: ~3,335
🔹 Target: ~3,296
🔹 Stop: Above ~3,352
🔹 Risk/Reward: Favorable setup
💬 Drop your thoughts in the comment section – do you agree with the short bias? Let's discuss!
🙏 Support this idea by liking and sharing. Your feedback means a lot!
XAUUSD maintaining the falling pattern H4 Timeframe Analysis
Gold is currently holding the falling wedge pattern on H1 & H4 and Market has to lift up at range of 3380-3285.
What's possible scanarios we have?
As we have seen h4 candle closes above 3280-3285 then keep buying and eyes at 3305 then 3320 milestone also I'm holding my buy positions.
On the otherhand if The H4 candle closes below 3280-3275 then buying will be limited and market will join the 3250 zone.i will sell accordingly .
Additional TIP:
Above 3280-3285 keep buy
Below 3275 keep sell
#XAUUSD

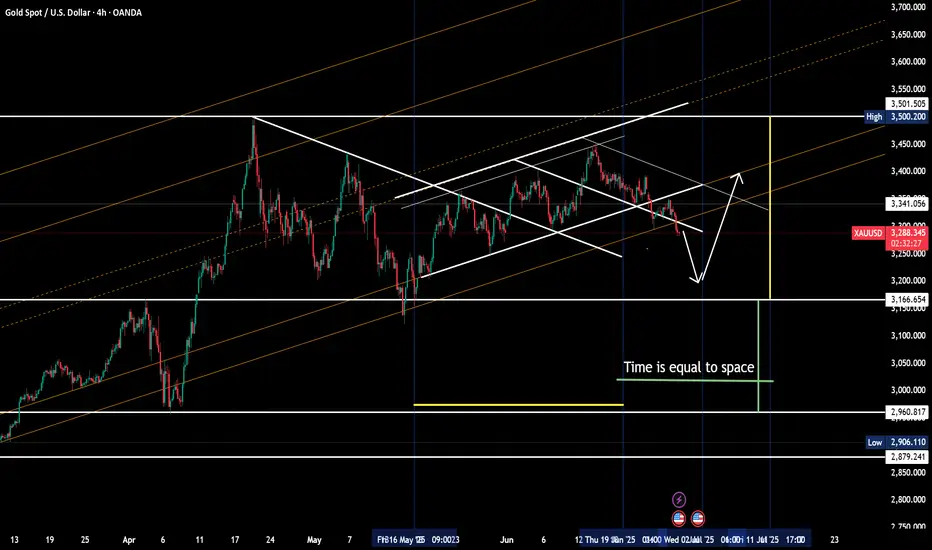
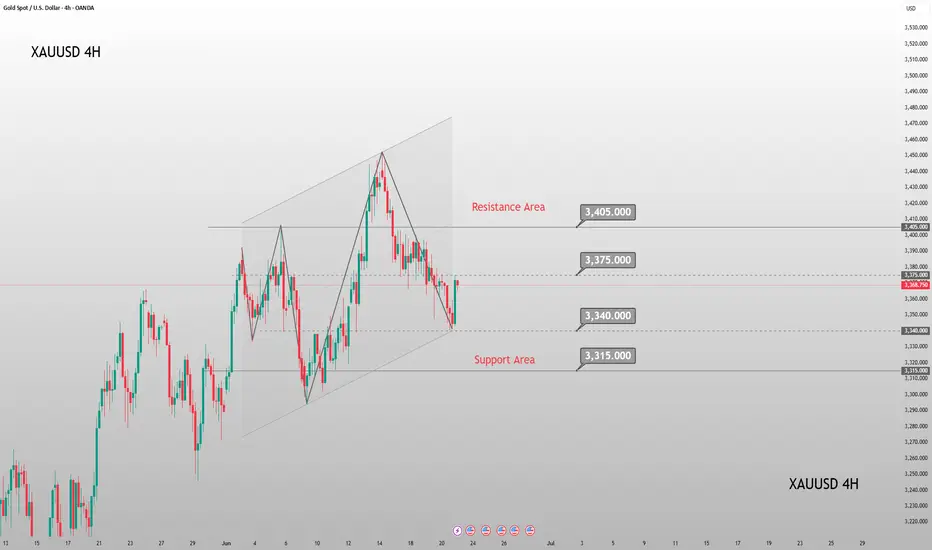
Next Week Gold Trend Forecast & Trading TipsDuring this round, the price was sold off sharply from the historical high of 3,500 to 3,120 before rebounding. After consecutive rallies, it faced pressure and fell back to 3,452 due to the fading of market risk aversion. On Friday, it rebounded from a low of 3,340. The daily chart recorded a consolidative bearish candle, with the K-line combination leaning bearish, while the 4H chart showed signs of stopping the decline.
In the short term, it is expected to consolidate below 3,400 next week. For the medium term, attention should be paid to the geopolitical crisis and the Federal Reserve's July interest rate decision. A breakthrough node will be ushered in after confirming the resistance above 3,400.
On the short-term 4-hour chart, the support below is focused around 3,340-45, and the short-term resistance above is around 3,380-85. The key focus is on the suppression at the 3,400-05 level. The overall strategy of going long on pullbacks within this range remains unchanged. For medium-term positions, it is advisable to stay on the sidelines, avoid chasing orders, and patiently wait for entry at key levels.
Investment itself is not the source of risk; it is only when investment behavior escapes rational control that risks lie in wait. In the trading process, always bear in mind that restraining impulsiveness is the primary criterion for success. I share trading signals daily, and all signals have been accurate without error for a full month. Regardless of your past profits or losses, with my assistance, you have the hope to achieve a breakthrough in your investment.
XAU/USD) Bullish reversal analysis Read The captionSMC trading point update
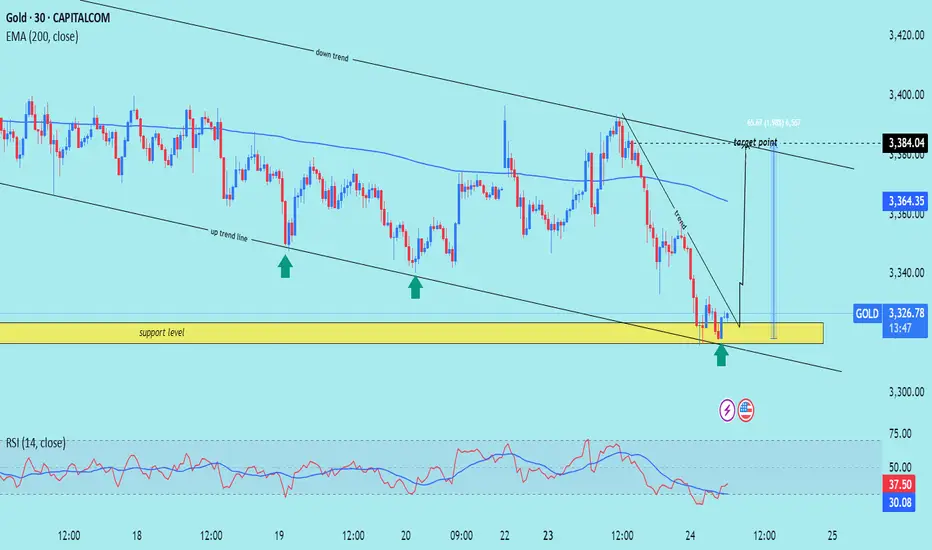
Technical analysis of Gold (XAU/USD) on the 30-minute timeframe, based on technical signals and price action behavior. Here's the breakdown
---
Gold Bullish Reversal Setup – Targeting 3,384
---
Key Technical Highlights:
1. Support Zone & Price Reaction:
Price has tested a strong horizontal support level (highlighted in yellow).
Multiple bullish rejection wicks indicate buying pressure at this zone.
The green arrows show successful support bounces, hinting at bullish intent.
2. Trendline Analysis:
Price bounced near the lower boundary of the falling wedge/downtrend channel.
An uptrend line convergence supports potential reversal.
A breakout above the short-term descending trendline is indicated.
3. EMA & Target Projection:
EMA 200 at 3,364.33 may act as dynamic resistance, the next short-term hurdle.
Target zone projected at 3,384.04, offering a potential move of +65.67 pts (~1.98%).
4. RSI Indicator:
RSI(14) is oversold (~29.93), signaling a potential reversal.
A bullish crossover may be forming, supporting upward momentum.
---
Trading Plan:
Entry Zone: Near current support area around 3,325
Target: 3,384
Stop Loss (Suggested): Below 3,300, under support structure
Risk/Reward: Favorable based on support hold and breakout projection
Mr SMC Trading point
---
Conclusion:
This setup suggests a short-term bullish reversal from a key support area, with confirmation likely if price breaks above the descending trendline and clears the 200 EMA.
Please support boost 🚀 this analysis)