XAUUSD.F trade ideas
Gold Slips as Ceasefire Eases SafeHaven Demand Bearish Below3339Gold Drops on Israel-Iran Ceasefire
Gold prices declined as safe-haven demand eased following President Trump’s announcement of a ceasefire between Israel and Iran. Despite the pullback, gold remains up nearly 23% year-to-date, supported by ongoing geopolitical tensions, economic uncertainty driven by Trump’s tariffs, and robust central bank purchases.
Market Focus:
All eyes are now on U.S. Federal Reserve Chair Jerome Powell’s testimony, which may offer fresh insights into potential near-term interest rate cuts.
Technical Outlook:
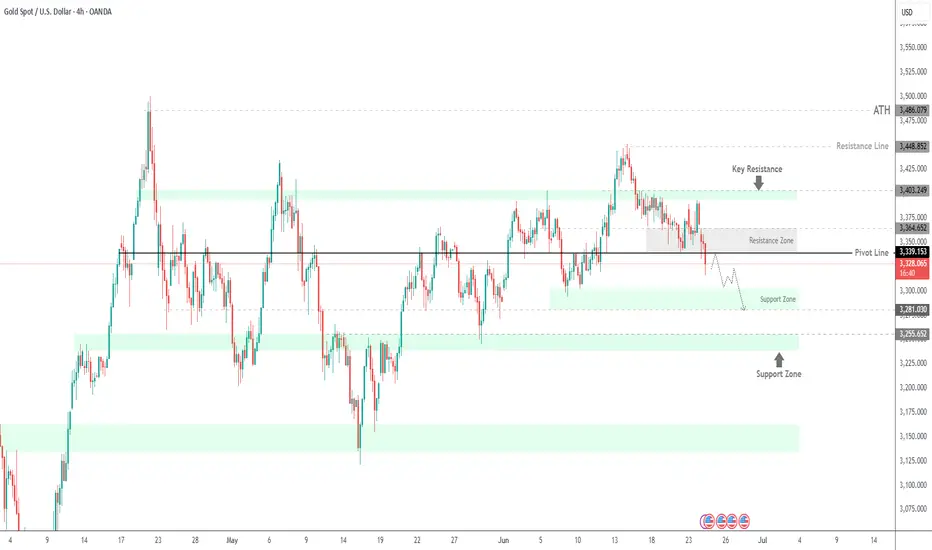
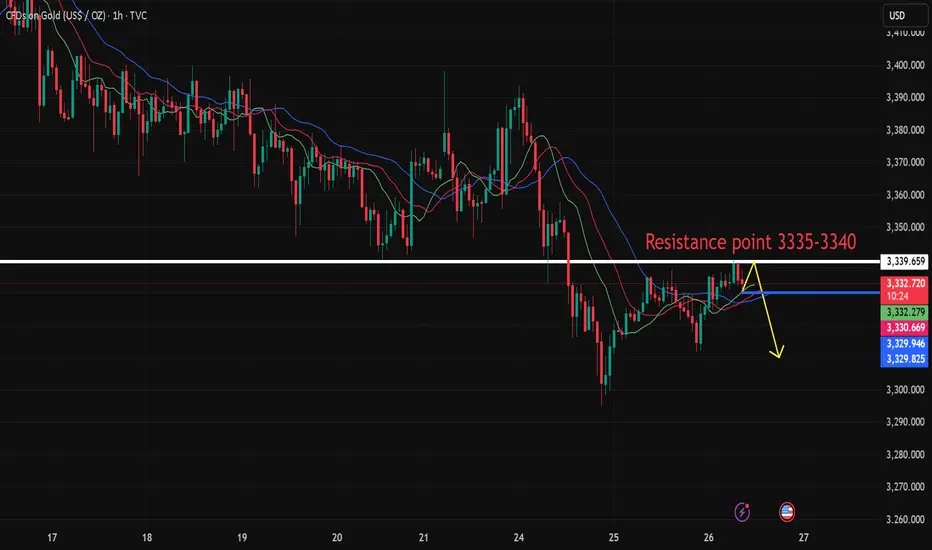
Gold remains under bearish pressure as long as it trades below the 3329–3339 pivot zone.
A confirmed 4H candle close below 3329, or especially 3309, would further validate downside momentum toward the support range.
Support Levels: 3302, 3281, 3256
Resistance Levels: 3364, 3393
A clear break below 3302–3281 would open the path toward deeper bearish continuation.
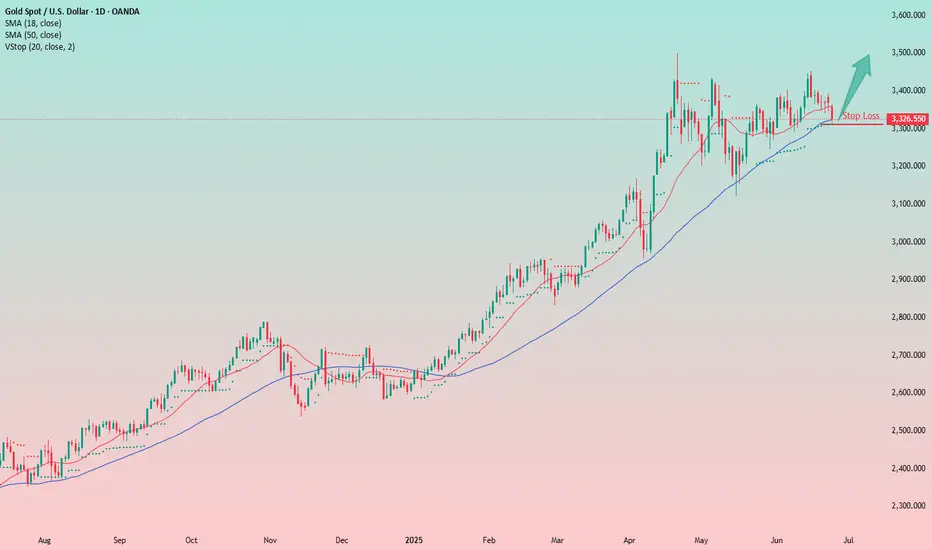
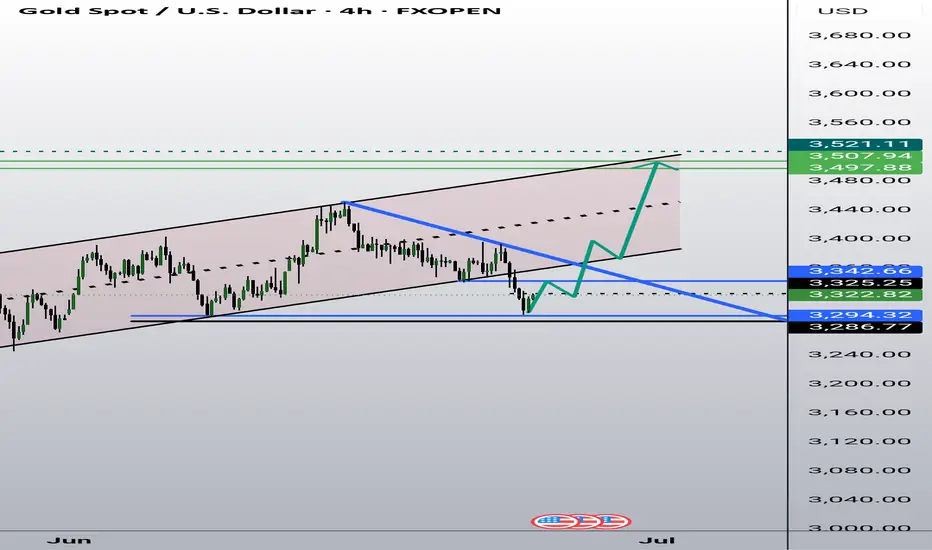
Trend Continuation Setup: Long Entry from MA supportPrice has pulled back to the key moving averages, acting as dynamic support. Trend remains bullish.
A bullish setup has formed, offering a long entry opportunity with limited downside risk.
📝Trade Plan :
Entry: Near the current price, around the moving averages
Stop Loss: Just below today’s low, at the 3310 level
Target: First target around 3500, with potential for continuation if momentum builds
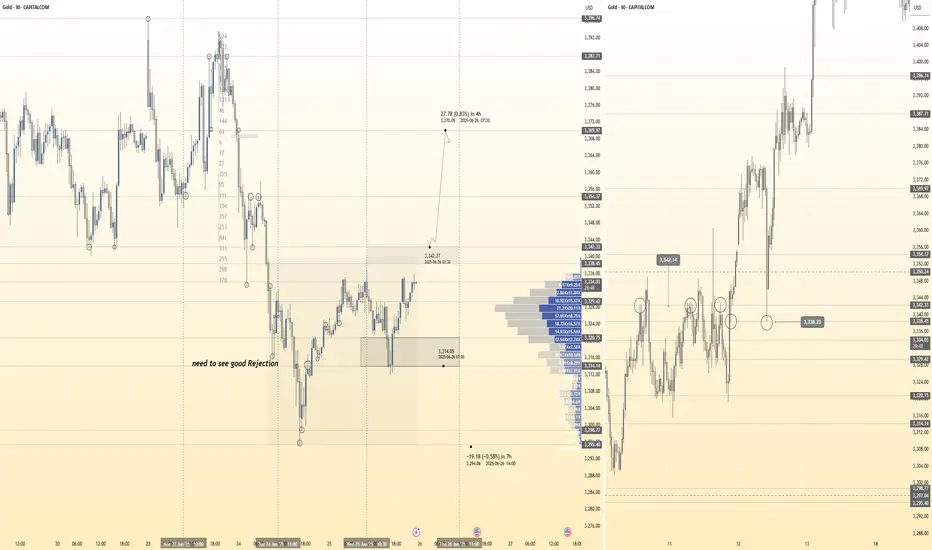
June 27, 2025 - XAUUSD GOLD Analysis and Potential OpportunitySummary:
The 3310 zone has shown strong support. If this level breaks, bearish pressure is likely to increase.
On the upside, the 3350 area remains a strong resistance — if price approaches but fails to break through, it could offer a good short opportunity.
Keep a close watch on these two zones. Until a breakout occurs, treat price action as range-bound.
I'll be updating again during the London session — need a quick rest now 😴. Stay tuned!
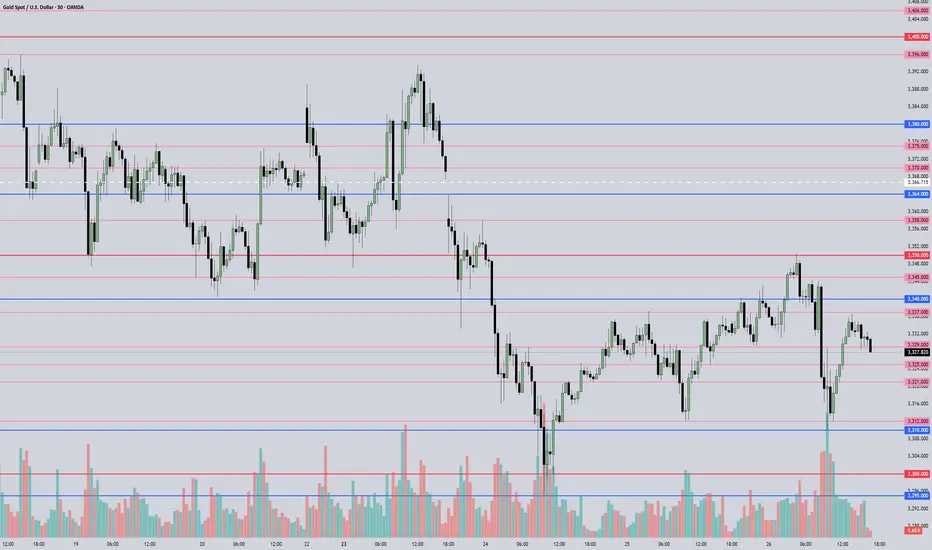
🔍 Key Levels to Watch:
• 3364 – Resistance
• 3350 – Midpoint / Intraday Key Resistance
• 3345 – Resistance
• 3337 – Critical Resistance
• 3321 – Support
• 3310–3312 – Intraday Key Support
• 3300 – Psychological Support
• 3295 – Support
• 3285 – Support
📉 Intraday Strategy:
• SELL if price breaks below 3325 → watch 3321, then 3318, 3310, 3300
• BUY if price holds above 3337 → target 3343, then 3350, 3358, 3364
👉 If you want to know how I time entries and set stop-losses, hit the like button so I know there's interest — I may publish a detailed post by the weekend if support continues!
Disclaimer: This is my personal opinion, not financial advice. Trade with caution and always manage your risk.
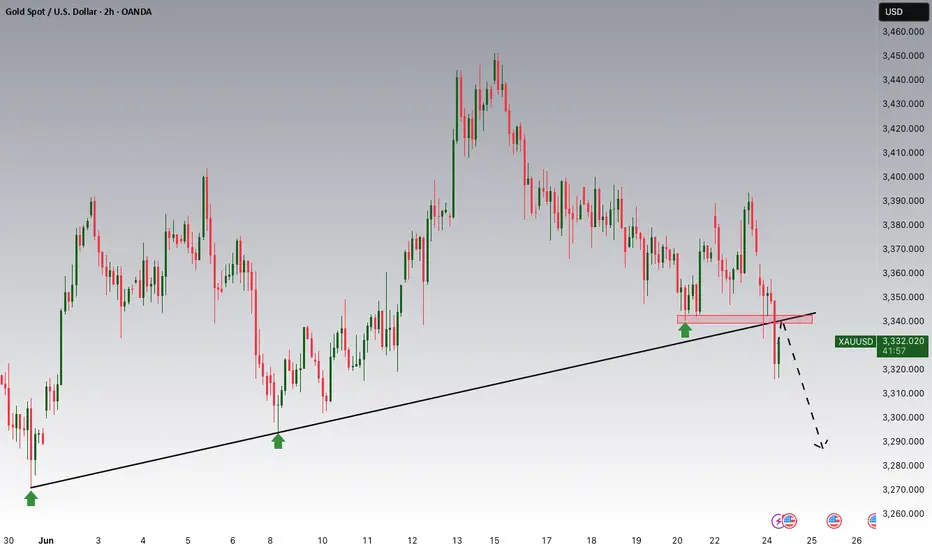
Gold: Breakout and Potential retraceHey Traders, in today's trading session we are monitoring XAUUSD for a selling opportunity around 3,340 zone, Gold was trading in an uptrend and successfully managed to break it out. Currently is in a correction phase in which it is approaching the retrace area at 3,340 support and resistance area.
Trade safe, Joe.
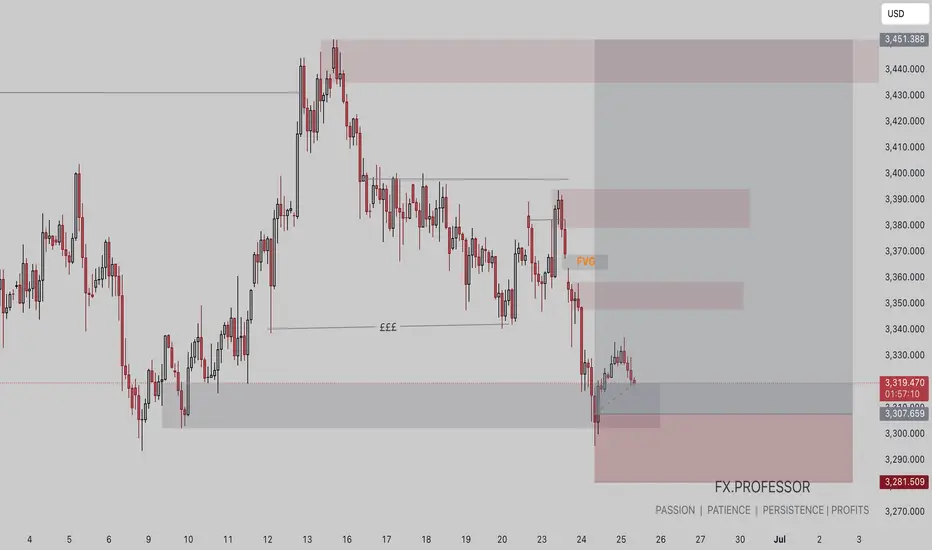
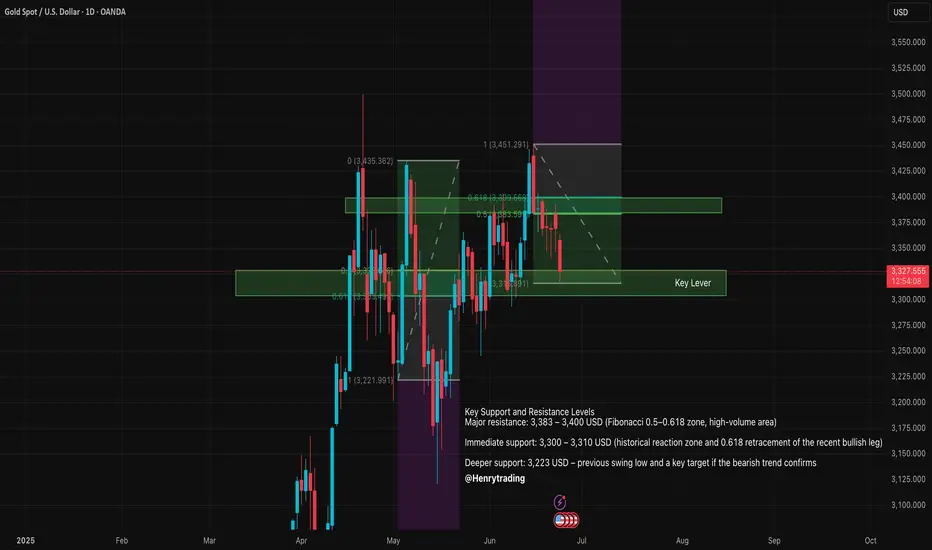
XAUUSD Technical Analysis – June 24, 2025On June 24, 2025, XAUUSD (spot gold) continues to face significant bearish pressure after failing to hold above the key resistance zone around 3,383 – 3,400 USD/oz. This area marks a confluence of the 0.5–0.618 Fibonacci retracement levels and a high-volume distribution zone, signaling strong supply dominance in the short term.
Technical Structure and Fibonacci Analysis
- The recent swing high was established at 3,451 USD, completing a bullish wave from the low of 3,223 USD.
- Price was unable to break through the 0.618 Fibonacci retracement at 3,399 USD, leading to a sharp pullback.
- The current structure suggests the formation of a potential head and shoulders pattern, which would confirm if the market breaks below the 3,300 USD support zone.
Key Support and Resistance Levels
- Major resistance: 3,383 – 3,400 USD (Fibonacci 0.5–0.618 zone, high-volume area)
- Immediate support: 3,300 – 3,310 USD (historical reaction zone and 0.618 retracement of the recent bullish leg)
- Deeper support: 3,223 USD – previous swing low and a key target if the bearish trend confirms
Potential Scenarios
- Bearish scenario: If the price sustains below 3,350 USD and decisively breaks 3,300 USD, it may signal the start of a medium-term downtrend, with targets near 3,200 USD or even lower.
- Bullish scenario: A bounce from the 3,300 USD support could trigger a short-term recovery, but traders should closely watch the reaction near the 3,383 – 3,400 USD resistance zone to assess supply pressure.
RSI and Momentum Indicators
- The 14-period RSI is trading below the 50 level and pointing downward, indicating that bearish momentum remains dominant.
- The RSI has also crossed below its moving average, reinforcing the negative outlook.
Ps: XAUUSD is currently in a critical phase as it tests the 3,300 USD support level. A break below this level could confirm further downside and strengthen the bearish trend. Traders are advised to remain cautious, wait for clear price action confirmation, and apply strict risk management as volatility increases.
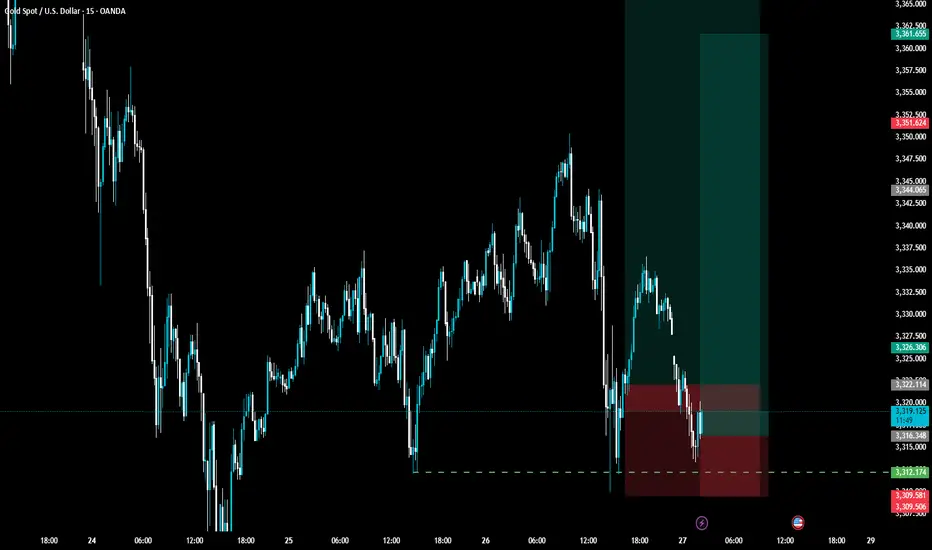
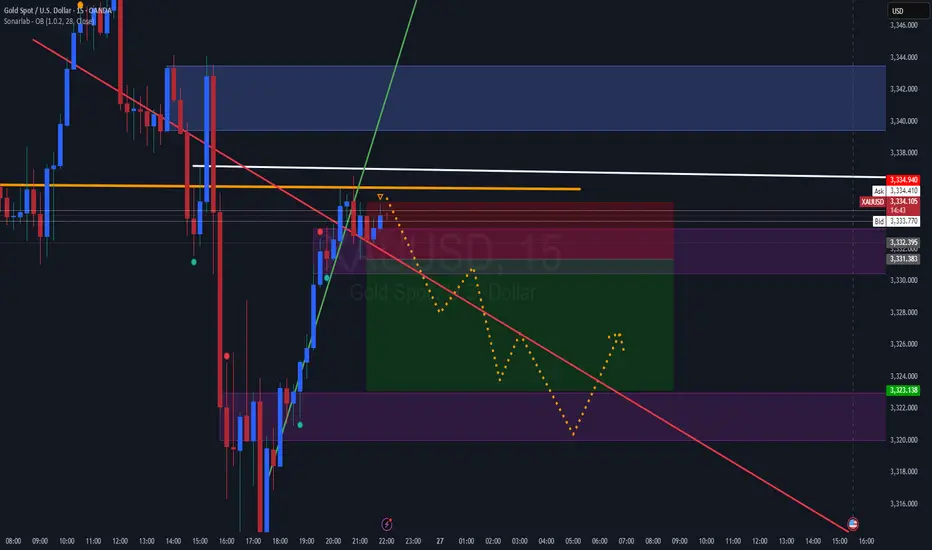
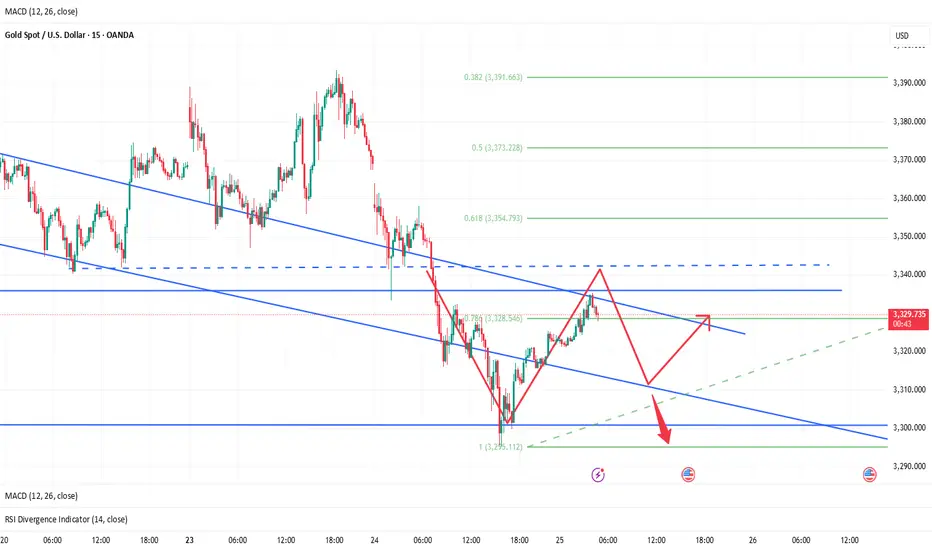
Possible movement on the near future, if it close under 3332If the prices closes under 3332 and we have enough volume in the markets we will hunt the liquidity in the 3320-3315 area, before a possible move to the upside.
Is Gold Setting a Trap for Traders?Gold is currently retesting the FVG zone around 3,392 after breaking below a key trendline — a classic sell-trigger area if price gets rejected.
Bearish momentum is supported by:
U.S. jobless claims: 244K < 245K forecast → Stronger USD
Iran–Israel ceasefire → Reduced demand for safe-haven assets
If price fails to break above 3,392, the next downside target is the 3,299 support zone.
Trade idea: Watch for a rejection around 3,390–3,392 to consider short positions.
Bearish bias remains valid as long as price stays below 3,392.
Review and Speculation for the 10 Elite PairsYou can follow us for more Analysis(Images and Videos) with Precise definition of the Financial Market.ENJOY!!!

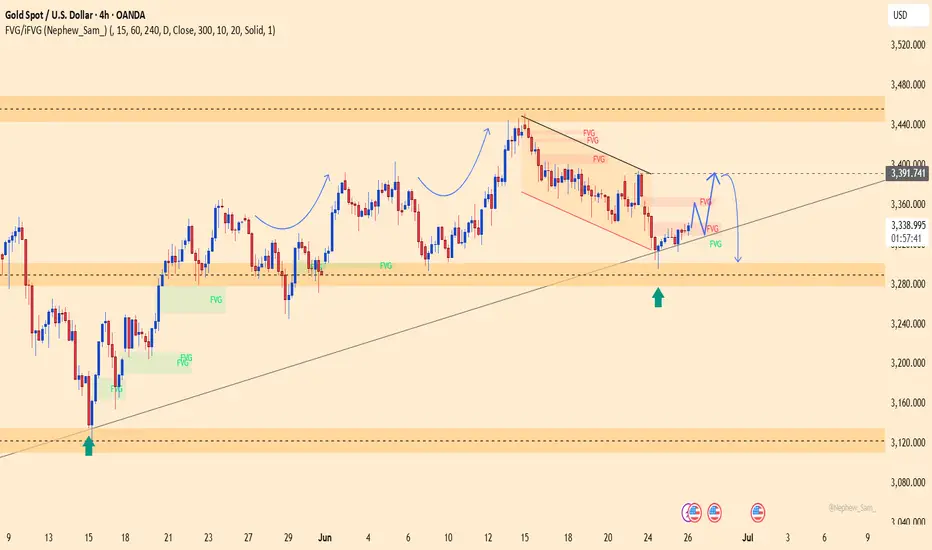
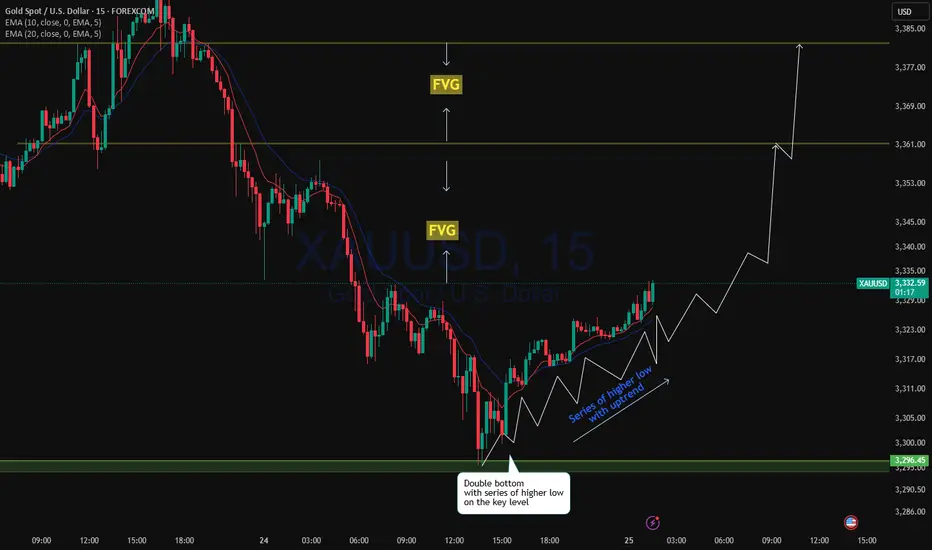
XAUUSD Ready bounce back?XAUUSD 3295.00 is an important weekly and daily key level price has just bounced back from the key level with double bottom formation. It is possible for the price to continue to bounce back to daily resistance level?
While was in down trend price has left significant imbalance in the market showing possible uptrend with the filling of FVG.
A buy trade with strong liquidity grab is high probable.
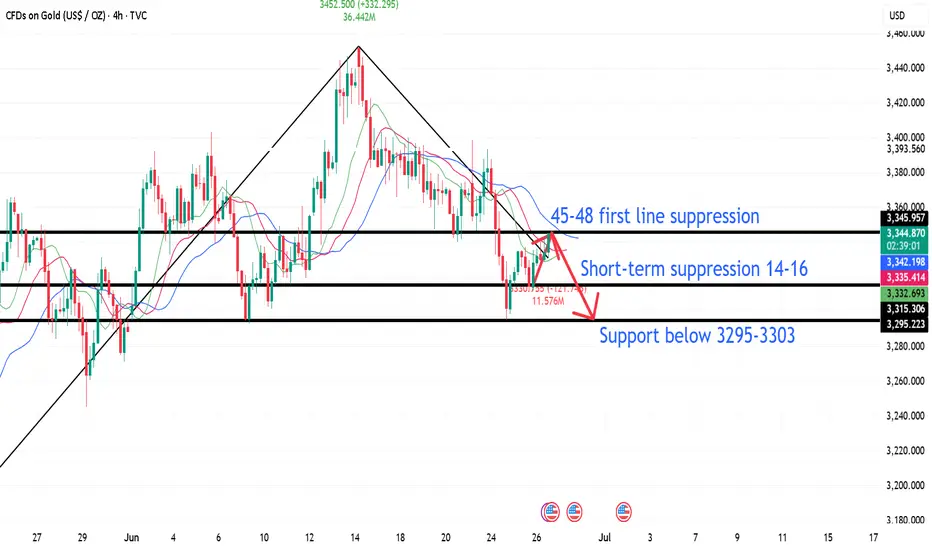
6.26 Gold intraday operation strategy, rebound 42-48 line shortFrom the 4-hour analysis, the upper resistance is around 3342-48. The intraday rebound relies on this position to continue to be short and follow the trend to fall. The short-term support below is around 3314-3316 integers. The upper pressure is around 3342-48. The overall support relies on this range to maintain the main tone of high-altitude low-multiple cycles. The short-term long-short watershed is 3370. It is difficult to say that it is strong before the daily level breaks through and stands on this position. I will remind you of the specific operation strategy during the session, so please pay attention to it in time.
Gold operation strategy:
1. Short the gold rebound at 3345-48, stop loss at 3356, target 3317-3325, and continue to hold if it breaks;
Gold has Bottom OutAfter 2 weeks of selling gold gas bottom out
Best level to enter Long position
High risk reward at current level
Hanzo | 30-Min Setup / incoming 300 Pip After Break Out Time Frame: 30 -Minute Warfare
Entry Mode: Only after verified Break out
🩸Bullish Break : 3338 : 3342.5
Price must break liquidity with high volume to confirm the move.
➕ Hanzo Protocol: Dual- Entry Intel
Zone Activated: Deep Analysis ( 3338 ) Point
why we did chose it ?
Solid Key level
➗1st Wick Touch (11 Jun /2025)
➗2nd Wick Touch (12 Jun /2025)
➗3rd Wick Touch (24 Jun /2025)
Deep Analysis ( 3338 ) Point
why we did chose it ?
➗1st Wick Touch (11 Jun /2025)
➗2nd Wick Touch (11 Jun /2025)
➗3rd Wick Touch (11 Jun /2025)
➗4th x2 Wick Touch (20 Jun /2025)
➗5th x2 Wick Touch (24 Jun /2025)
🔖That means we created a Solid Zone (3338 : 3342) of Breakout on the 30-min Chart -
Price must break liquidity with a clear 30-min candle to confirm the move.
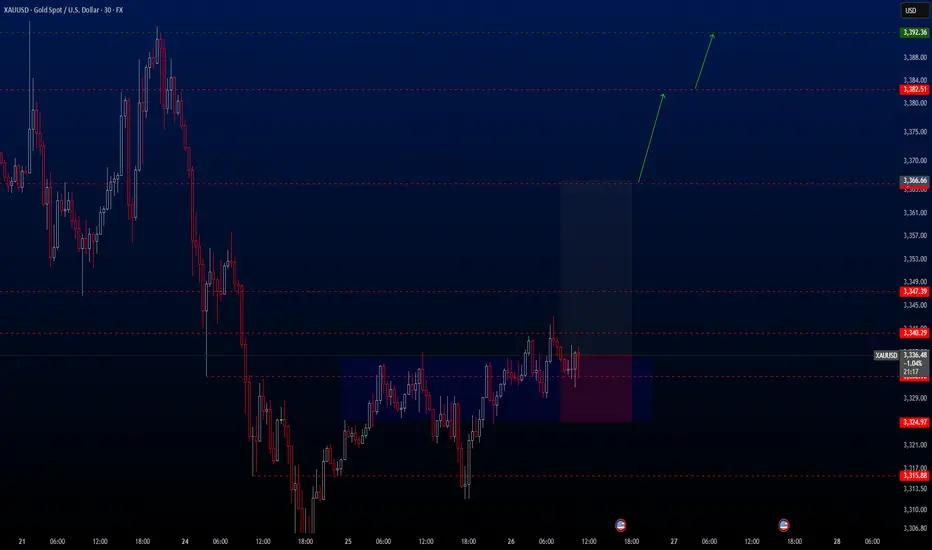
XAUUSD Hello traders.
Today’s first trade setup comes from the XAUUSD pair. The pair is currently positioned in an ideal buy zone, and I’ve spotted a potential long opportunity. There are three different take profit levels, all of which are listed below. Personally, I’ll be closing my position at the first TP level: 3366.66.
However, keep in mind that two major economic events will be released today:
📌 Gross Domestic Product (GDP) (QoQ) – Q1
📌 Initial Jobless Claims
These are highly impactful events, so please manage your risk accordingly.
🔍 Trade Details
✔️ Timeframe: 30-Minute
✔️ Risk-to-Reward Ratio: 1:2.5
✔️ Trade Direction: Buy
✔️ Entry Price: 3336.62
✔️ Take Profit: 3366.67 / 3382.51 / 3392.36
✔️ Stop Loss: 3324.97
🕒 If momentum fades or the price consolidates within a tight range, I’ll keep this trade open only until 23:00 (UTC+4). After that, I’ll close it manually—whether in profit or loss—depending on how the price action evolves.
🔔 Disclaimer: This is not financial advice. I’m simply sharing a trade I’ve taken based on my personal trading system, strictly for educational and illustrative purposes.
📌 Interested in a systematic, data-driven trading approach?
💡 Follow the page and turn on notifications to stay updated on future trade setups and advanced market insights.
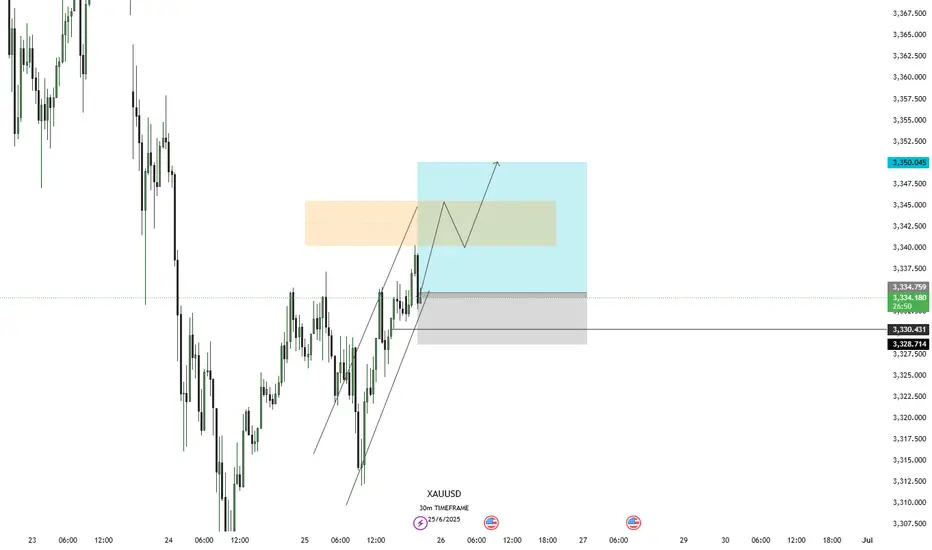
Diamond Targets Loaded 🔱 XAUUSD Trade Setup 🔱
Timeframe: 30m
📈 Price is currently respecting the ascending channel with bullish momentum. We have a clear breakout target area identified.
🎯 Target Zones (Diamonds):
💎 Diamond 1 → 3340
💎 Diamond 2 → 3345
💎 Diamond 3 → 3350
🔻 Support Zone: 3330
💣 Treasure Miss (SL): 3328
6.26 Gold intraday analysis guideOn Wednesday (June 25), international spot gold rose slightly during the US trading session, but was still suppressed by the 20-day moving average (US$3,355). The RSI (14) was at 48.7, in the neutral range of 40-60, suggesting that the market lacks a clear direction. US$3,355 (20-day moving average) has become the recent watershed between long and short positions. If it breaks through this level, it may test the psychological barrier of US$3,400. The support below is US$3,245 (the low point on May 29). If it fails, it may drop to the integer level of 3,200 and US$3,121 (the low point on May 15). Stability of the geopolitical situation: If the ceasefire agreement in the Middle East continues, the outflow of safe-haven funds may further suppress the gold price. Fed policy expectations: If the July non-agricultural and CPI data show that inflation is cooling down, it may rekindle expectations of interest rate cuts and boost gold. The current gold market is in a "wait-and-see mode", and both long and short sides lack decisive momentum. Traders need to pay close attention to: US economic data: especially employment and inflation indicators for the Fed's policy path. Geopolitical dynamics: Any breakdown of the ceasefire agreement could quickly push up safe-haven demand. Dollar trend: If the Fed maintains a hawkish stance, a stronger dollar may further suppress gold prices. Gold is expected to maintain range fluctuations in the short term, with the $3,355 moving average resistance and $3,245 support forming a key trading range. The direction of the breakthrough depends on new fundamental catalysts.
Personal operation analysis:
Trend: Oscillating trend
Support: Near 3,300.00
Resistance: Near 3,335.50
Strategy:
View logic: Short view near 3,335-3,340, stop loss 3,345, take profit near 3,300--3,280, and follow the stop loss 300 points.
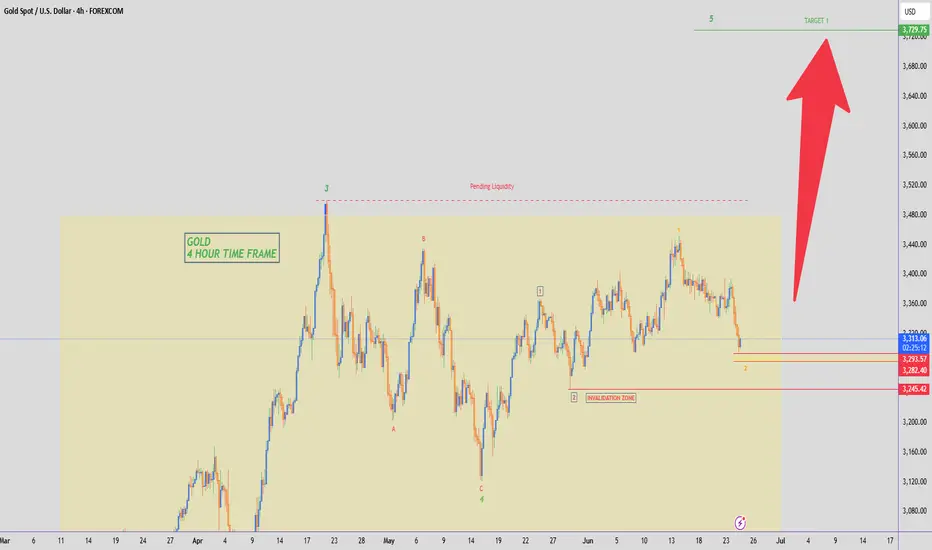
GOLD - WAVE 5 BULLISH TO $3,734 (UPDATE)Here’s an updated analysis, as ‘Minor Wave 2’ is still forming & pulling back deeper into the $3,285 zone.
We’ll be keeping an eye around this zone for a slow down in bearish momentum & if we get it, we’ll enter a buy trade. If momentum doesn’t slow down, we will let it go towards $3,245 & invalidate bullish structure. That way we know to look for sell’s📉
TP1: $3,374
TP2: $4,300
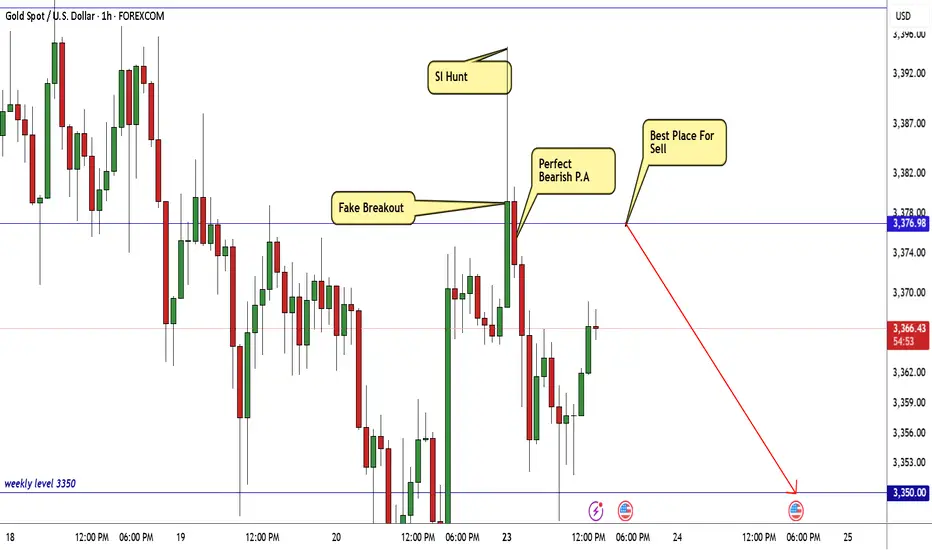
Gold Take All Stop losses,Are You Ready To Sell To Get 300 Pips?Here is my 1H Gold Chart and this is my opinion , the price opened this week with massive wick to upside to take all stop losses and then moved to downside very hard and aggressive , we have a very good Res that we sell from it last week 3377.00 , it`s still strong and forced the price many times to respect it so it still my fav level to sell it again today if the price touch it and give me a good bearish price action to confirm the entry and we can targeting 300 pips at least . if we have a daily closure above my res then we will think about buying instead of selling , but until now i`m looking to sell it from the level i mentioned .
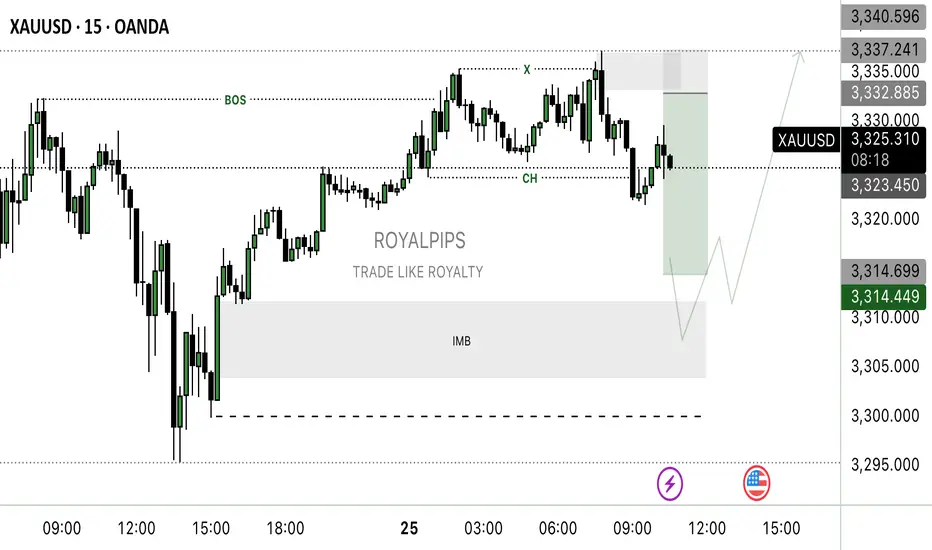
XAUUSD GOING LONG📊 CHoCH Spotted (LTF) – Market just broke structure bullish!
📈 Buyers are now in control.
🔻 Waiting for price to pull back into Demand Zone (last bearish candle before the push up).
🎯 Target: Supply Zone above
🛑 SL: Just below Demand Zone
🟢 Looking to buy the dip and ride the bullish wave!
Suppression remains unchanged, the latest layout of gold📰 Impact of news:
1. Powell's testimony
2. Geopolitical impact
📈 Market analysis:
The short-term rebound of gold is the release of energy for the accumulated bulls. From the current market trend, 3340 above is the key point of the short-term watershed between bulls and bears. The short-term resistance above is around 3342-3348, and the short-term support below is around 33220-3315. If it falls below this, it will continue to look towards yesterday's low of 3290-3280. The daily level is under pressure and continues to see a decline and adjustment. If it touches 3340-3350 above, you can try to short. After it retreats to 3320-3315 and obtains effective support, you can consider going long.
🏅 Trading strategies:
SELL 3340-3350
TP 3330-3320-3315
BUY 3320-3315
TP 3330-3340-3350
If you agree with this view, or have a better idea, please leave a message in the comment area. I look forward to hearing different voices.
OANDA:XAUUSD FX:XAUUSD FOREXCOM:XAUUSD FXOPEN:XAUUSD TVC:GOLD
Extra, pre market — June 25, 2025Global financial markets mounted a broad-based relief rally as geopolitical tensions in the Middle East eased significantly following a ceasefire between Israel and Iran. The U.S.-brokered truce, while fragile, has triggered a visible return to risk appetite across equity, fixed income, and currency markets. U.S. President Donald Trump, despite playing a central role in halting the conflict, publicly rebuked both Israel and Iran for violations, urging Israel via Truth Social to “BRING YOUR PILOTS HOME, NOW!” This unusual stance appears to have stabilized sentiment across asset classes, at least for now.
U.S. equity markets responded favorably to the geopolitical de-escalation. The Dow Jones Industrial Average surged by +507.24 points (+1.2%) to close at 43,089.02, while the Nasdaq 100 added +334.19 points (+1.5%) to end at 22,190.52. The S&P 500 rose +67.01 points (+1.1%), settling at 6,092.18 (Screenshot_1.png). The Russell 2000 also climbed +1.1%, driven by renewed confidence in domestic cyclicals. Volatility sharply dropped, with the CBOE VIX Index falling -11.9% to 17.48, indicating a lower perceived risk premium.
Sector rotation was pronounced. Technology (XLK) led with a +1.8% gain to $247.24, closely followed by Financials (XLF) at +1.5%, and Communications (XLC) at +1.3%. In contrast, Energy (XLE) sank -1.3% to $84.91, weighed down by falling oil prices, and Consumer Staples (XLP) edged down slightly by -0.1% (Screenshot_1.png). Investors appeared to rotate out of defensive sectors into higher-beta growth plays, signaling a risk-on tone.
The sector divergence was matched by style factor dispersion. On a relative basis, Private Equity (PSP/SPY) outperformed all other factors with a +1.2% daily move, followed by IPOs (IPO/SPY) at +0.9% and Hedge Funds (GURU/SPY) at +0.6% (Screenshot_6.png). Among equity styles, Small-Cap Growth (IJT/SPY) posted a +0.6% relative return, while Value (IVE/SPY) and Low Volatility (USMV/SPY) underperformed at -0.3% and -0.6% respectively. This points to growing investor confidence in higher-risk, higher-reward assets, likely fueled by reduced macro stress.
The relief was also evident in global bond markets. U.S. Treasury yields declined modestly as demand for duration returned. The 10-year yield (US10Y) closed at 4.298%, down from earlier June highs, while the 2-year (US2Y) yield dropped to 3.797% (Screenshot_5.png). European yields followed suit: Germany’s 10Y Bund yield dropped to 2.144%, and the UK Gilt yield hovered at 4.475%. Notably, Japanese 10Y yields have increased to 1.404%, up 22.88% YTD, signaling shifting monetary dynamics in Asia.
Credit markets remained resilient. On a year-to-date basis, Local Emerging Market Bonds (EMLC) are outperforming with an 11.3% return, followed by USD Emerging Market Debt (EMB +6.9%), and Convertibles (CWB +5.2%). U.S. Corporate bonds continued to benefit from carry and spread compression, with High Yield (HYG) and Investment Grade (LQD) both showing solid inflows and positive performance (Screenshot_4.png). Fixed income appears to be balancing carry with renewed duration appeal amid easing geopolitical risk and softer Fed expectations.
Commodities, particularly energy, experienced sharp reversals. WTI Crude Oil (CL1) and Brent Crude (CO1) fell 6.0% and 6.1% respectively, closing at $64.37 and $67.14 (Screenshot_7.png). This move reflects the de-escalation in the Strait of Hormuz risk and was compounded by Trump's call to "DRILL, BABY, DRILL!!!"—signaling a political push for increased U.S. production. Gold, meanwhile, retreated slightly to $3,328.22 (-0.1%), though remains up 28.4% YTD, having benefited from haven flows during the height of the conflict. Silver saw a similar retreat to $35.74 (-0.5%), though retains a +23.6% YTD gain.
In foreign exchange, the U.S. dollar weakened across major pairs as safe-haven demand declined. The EUR/USD rose to 1.1606 (+8.5% YTD), while the GBP/USD reached 1.3612 (+7.6% YTD). In contrast, the USD/JPY fell to 145.75, marking a -8.7% YTD decline (Screenshot_10.png). The reversal in dollar strength aligns with broader global reflation trades and a moderation in Fed hawkishness, supported by Chair Powell’s comments that the U.S. economy remains “solid” and that tariff impacts may be more muted than feared.
On a global equity level, YTD returns tell a diverse story. Latin America continues to dominate, with Argentina (ARGT +54.2%), Brazil (EWZ +22.6%), and Mexico (EWW +22.0%) leading gains (Screenshot_9.png). Among developed markets, Canada (EWC +27.5%) and Germany (EWG +18.7%) outshine, whereas Turkey (TUR -25.2%) and India (PIN -0.75%) lag meaningfully. In Asia, South Korea (EWY +14.8%) and Taiwan (EWT +13.6%) saw notable performance, bolstered by strength in tech exports and domestic policy easing.
Looking ahead, the sustainability of this rally depends on several unresolved variables. First, the Middle East ceasefire, while currently holding, is inherently fragile. Any renewed hostilities could spike volatility and reverse energy price trends rapidly. Second, the Fed remains in a delicate position. Markets are currently pricing in a prolonged pause, but Trump’s pressure on the central bank and shifting economic data could alter expectations quickly. Finally, watch for China’s re-entry into Iranian oil markets following Trump’s announcement that Beijing “can now continue to purchase oil from Iran.” This move could reignite trade friction or trigger secondary sanctions, especially if EU or U.S. energy security concerns are heightened.
In conclusion, the combination of geopolitical relief, Fed ambiguity, and a rotation into riskier assets has created a fertile environment for short-term bullish momentum. However, macro fragility persists. Investors should remain tactically optimistic but structurally cautious, especially in sectors sensitive to energy prices and interest rates. Keeping a diversified allocation across risk assets, commodities, and high-quality fixed income remains advisable in this unpredictable macro regime.
GOLDCurrently on a buy trade on Gold but we also have 2 supply levels above as our POI where we could be watching closely for sell opportunities. Personally, i prefer the extreme POI because it has FVG right below it which i expect to be filled up so my bias on GOLD is buy to sell.