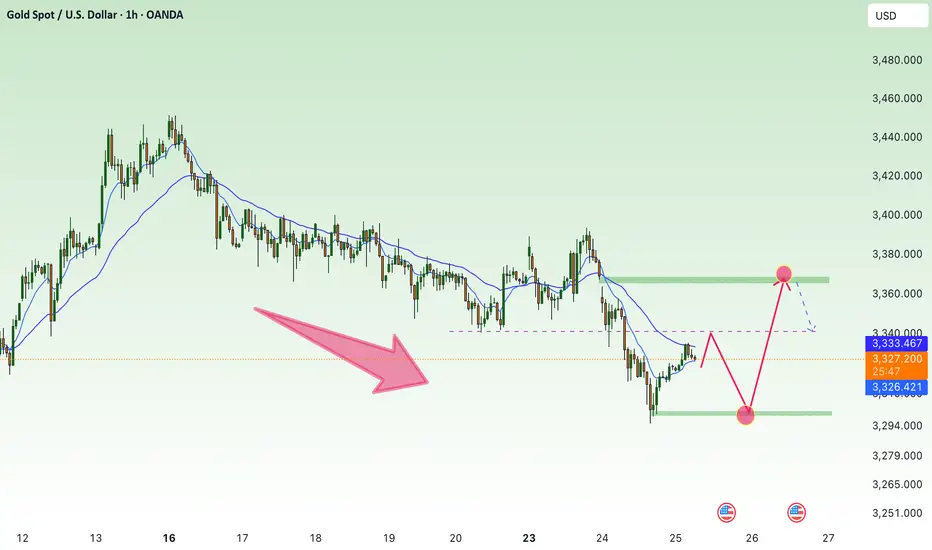
Weekly Analysis on GOLDAs of the moment i am current on a buy trade position. Looking forward for next week trading session. If price run in my favor then that's the time i will manage this trade and look for possible scale in position.
XAUUSD.F trade ideas
Extra, pre market — June 25, 2025Global financial markets mounted a broad-based relief rally as geopolitical tensions in the Middle East eased significantly following a ceasefire between Israel and Iran. The U.S.-brokered truce, while fragile, has triggered a visible return to risk appetite across equity, fixed income, and currency markets. U.S. President Donald Trump, despite playing a central role in halting the conflict, publicly rebuked both Israel and Iran for violations, urging Israel via Truth Social to “BRING YOUR PILOTS HOME, NOW!” This unusual stance appears to have stabilized sentiment across asset classes, at least for now.
U.S. equity markets responded favorably to the geopolitical de-escalation. The Dow Jones Industrial Average surged by +507.24 points (+1.2%) to close at 43,089.02, while the Nasdaq 100 added +334.19 points (+1.5%) to end at 22,190.52. The S&P 500 rose +67.01 points (+1.1%), settling at 6,092.18 (Screenshot_1.png). The Russell 2000 also climbed +1.1%, driven by renewed confidence in domestic cyclicals. Volatility sharply dropped, with the CBOE VIX Index falling -11.9% to 17.48, indicating a lower perceived risk premium.
Sector rotation was pronounced. Technology (XLK) led with a +1.8% gain to $247.24, closely followed by Financials (XLF) at +1.5%, and Communications (XLC) at +1.3%. In contrast, Energy (XLE) sank -1.3% to $84.91, weighed down by falling oil prices, and Consumer Staples (XLP) edged down slightly by -0.1% (Screenshot_1.png). Investors appeared to rotate out of defensive sectors into higher-beta growth plays, signaling a risk-on tone.
The sector divergence was matched by style factor dispersion. On a relative basis, Private Equity (PSP/SPY) outperformed all other factors with a +1.2% daily move, followed by IPOs (IPO/SPY) at +0.9% and Hedge Funds (GURU/SPY) at +0.6% (Screenshot_6.png). Among equity styles, Small-Cap Growth (IJT/SPY) posted a +0.6% relative return, while Value (IVE/SPY) and Low Volatility (USMV/SPY) underperformed at -0.3% and -0.6% respectively. This points to growing investor confidence in higher-risk, higher-reward assets, likely fueled by reduced macro stress.
The relief was also evident in global bond markets. U.S. Treasury yields declined modestly as demand for duration returned. The 10-year yield (US10Y) closed at 4.298%, down from earlier June highs, while the 2-year (US2Y) yield dropped to 3.797% (Screenshot_5.png). European yields followed suit: Germany’s 10Y Bund yield dropped to 2.144%, and the UK Gilt yield hovered at 4.475%. Notably, Japanese 10Y yields have increased to 1.404%, up 22.88% YTD, signaling shifting monetary dynamics in Asia.
Credit markets remained resilient. On a year-to-date basis, Local Emerging Market Bonds (EMLC) are outperforming with an 11.3% return, followed by USD Emerging Market Debt (EMB +6.9%), and Convertibles (CWB +5.2%). U.S. Corporate bonds continued to benefit from carry and spread compression, with High Yield (HYG) and Investment Grade (LQD) both showing solid inflows and positive performance (Screenshot_4.png). Fixed income appears to be balancing carry with renewed duration appeal amid easing geopolitical risk and softer Fed expectations.
Commodities, particularly energy, experienced sharp reversals. WTI Crude Oil (CL1) and Brent Crude (CO1) fell 6.0% and 6.1% respectively, closing at $64.37 and $67.14 (Screenshot_7.png). This move reflects the de-escalation in the Strait of Hormuz risk and was compounded by Trump's call to "DRILL, BABY, DRILL!!!"—signaling a political push for increased U.S. production. Gold, meanwhile, retreated slightly to $3,328.22 (-0.1%), though remains up 28.4% YTD, having benefited from haven flows during the height of the conflict. Silver saw a similar retreat to $35.74 (-0.5%), though retains a +23.6% YTD gain.
In foreign exchange, the U.S. dollar weakened across major pairs as safe-haven demand declined. The EUR/USD rose to 1.1606 (+8.5% YTD), while the GBP/USD reached 1.3612 (+7.6% YTD). In contrast, the USD/JPY fell to 145.75, marking a -8.7% YTD decline (Screenshot_10.png). The reversal in dollar strength aligns with broader global reflation trades and a moderation in Fed hawkishness, supported by Chair Powell’s comments that the U.S. economy remains “solid” and that tariff impacts may be more muted than feared.
On a global equity level, YTD returns tell a diverse story. Latin America continues to dominate, with Argentina (ARGT +54.2%), Brazil (EWZ +22.6%), and Mexico (EWW +22.0%) leading gains (Screenshot_9.png). Among developed markets, Canada (EWC +27.5%) and Germany (EWG +18.7%) outshine, whereas Turkey (TUR -25.2%) and India (PIN -0.75%) lag meaningfully. In Asia, South Korea (EWY +14.8%) and Taiwan (EWT +13.6%) saw notable performance, bolstered by strength in tech exports and domestic policy easing.
Looking ahead, the sustainability of this rally depends on several unresolved variables. First, the Middle East ceasefire, while currently holding, is inherently fragile. Any renewed hostilities could spike volatility and reverse energy price trends rapidly. Second, the Fed remains in a delicate position. Markets are currently pricing in a prolonged pause, but Trump’s pressure on the central bank and shifting economic data could alter expectations quickly. Finally, watch for China’s re-entry into Iranian oil markets following Trump’s announcement that Beijing “can now continue to purchase oil from Iran.” This move could reignite trade friction or trigger secondary sanctions, especially if EU or U.S. energy security concerns are heightened.
In conclusion, the combination of geopolitical relief, Fed ambiguity, and a rotation into riskier assets has created a fertile environment for short-term bullish momentum. However, macro fragility persists. Investors should remain tactically optimistic but structurally cautious, especially in sectors sensitive to energy prices and interest rates. Keeping a diversified allocation across risk assets, commodities, and high-quality fixed income remains advisable in this unpredictable macro regime.
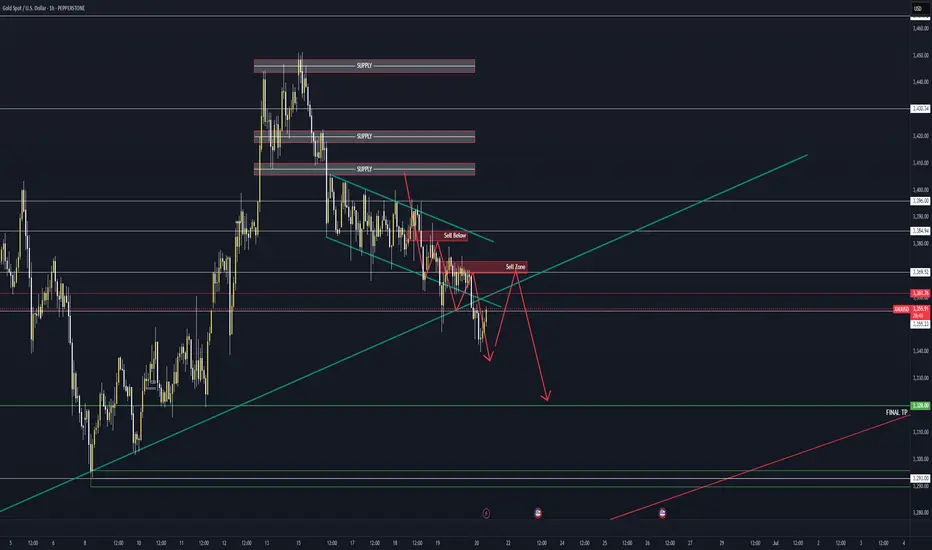
GOLDCurrently on a buy trade on Gold but we also have 2 supply levels above as our POI where we could be watching closely for sell opportunities. Personally, i prefer the extreme POI because it has FVG right below it which i expect to be filled up so my bias on GOLD is buy to sell.
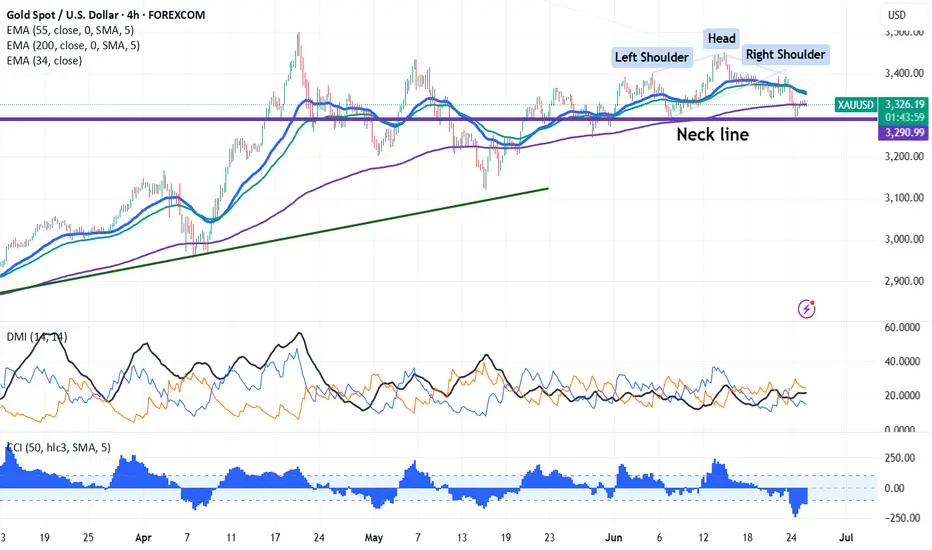
Technical Alert: Gold's Head and Shoulders Suggests Bearish SigChart pattern-Head and Shoulder
Gold pared most of its gains as Israel and Iran ceasefire agreement. It hits an low of $3295 and is currently trading around $3327.
Gold prices are holding below short term moving average 34 EMA and 55 EMA and above long-term moving averages (200 EMA) on the 4-hour chart. Immediate support is at $3340 and a break below this level will drag the yellow metal to $3330/$3300. The near-term resistance is at $3385 with potential price targets at $3400/43420$3450/$3475/$3500/$3550.
It is good to sell below $3295 with a stop-loss at $3330 for a target price of $3000.
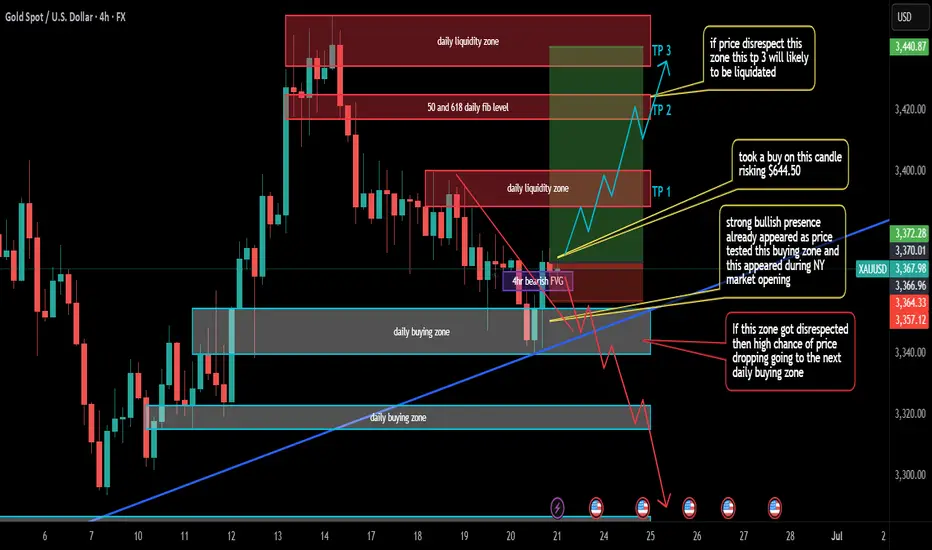
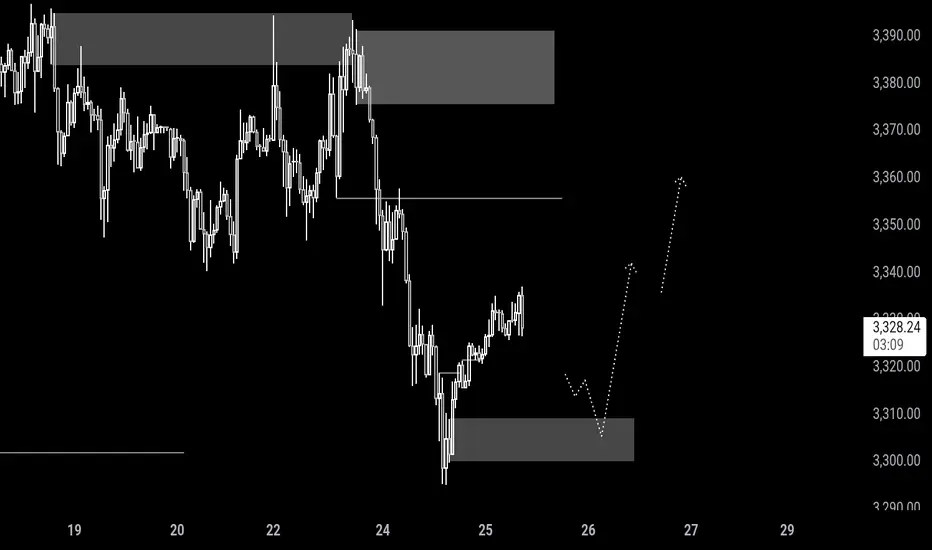
Bullish journey from here 24 th juneMarket in the last 2 weeks was on a bearish journey and it's time now ready for it's bullish move. Now the market at 4 hour chart and it's strong support and eventually will take it's turn heading towards 3390. So it's good to trigger your buy ordered around 3330-3326 area

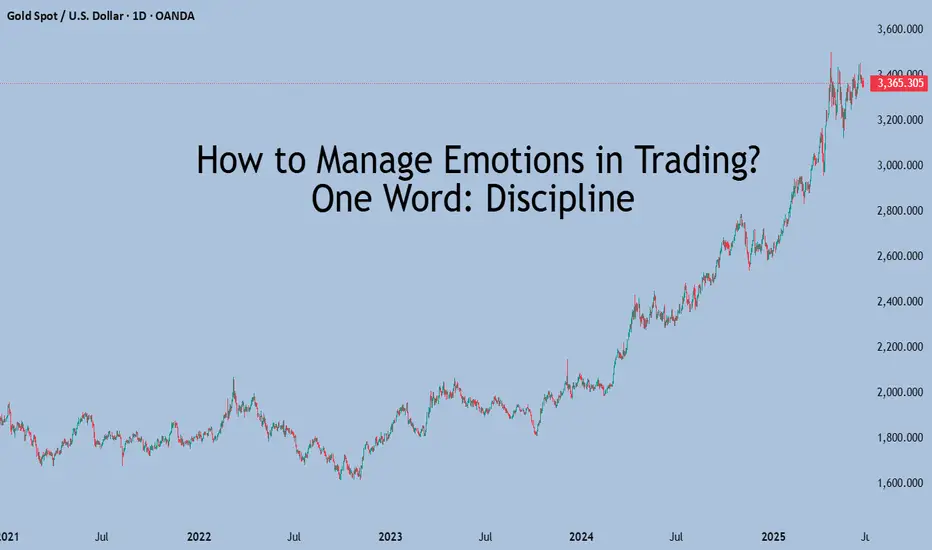
How to Manage Emotions in Trading? One Word: DisciplineHow to deal with emotions?
If you don't feel like reading a long explanation — here's the short answer: Discipline.
There are two typical emotional traps in trading:
1. After a big loss:
You feel the urge to recover quickly. Emotions kick in: despair, paralysis, frustration, snapping at loved ones — the classic downward spiral.
2. After a big win:
You feel like a king. “I’ve figured out the market. I’m unstoppable.” This leads to overconfidence, oversized positions, increased risk, and careless spending of profits — all while forgetting that black swans do exist.
What’s the cure in both cases? Discipline.
That’s your weak spot in both scenarios.
When you lose a lot, you shouldn’t even allow deep drawdowns to begin with.
Set clear exit rules:
1. Hard stop-losses.
2. A maximum loss limit (ideally 5–10% of capital), after which you completely exit all positions and take a minimum one-month break from charts and trading activity.
This protects your capital and — even more importantly — your mental health.
If you can’t follow your own stop-loss or take breaks when needed — then you don’t need emotional advice. You need to work on discipline.
When you feel euphoric from profits, this is trickier, but also manageable.
Reduce your position sizes after a major win or take a 2–3 day break to reset your brain and step back from emotional excitement
Again — the tool that helps here is discipline.
So how do you build that discipline?
Discipline isn’t just about trading. It’s a life skill that touches everything — from health to finance to habits. Here's how to develop it:
Start with physical training
Yes, really.
If you’re new, aim for 30 minutes of exercise, 3 times a week.
Even if you’re tired halfway, just walk in place — finish the 30 minutes. This trains your brain to complete what it starts, no matter how you feel.
The self-discipline from training your body will spill into every other area of your life — including trading.
Build simple habits
Start small:
Get up at the first alarm
Make your bed right after waking up
Put away clothes properly
Clean your shoes after coming home
Pick 2–3 micro-habits, and once they stick, your "discipline muscle" will grow. Over time, it becomes a natural skill.
Don’t expect results in the first week
Give yourself 30 days, and you’ll see real change.
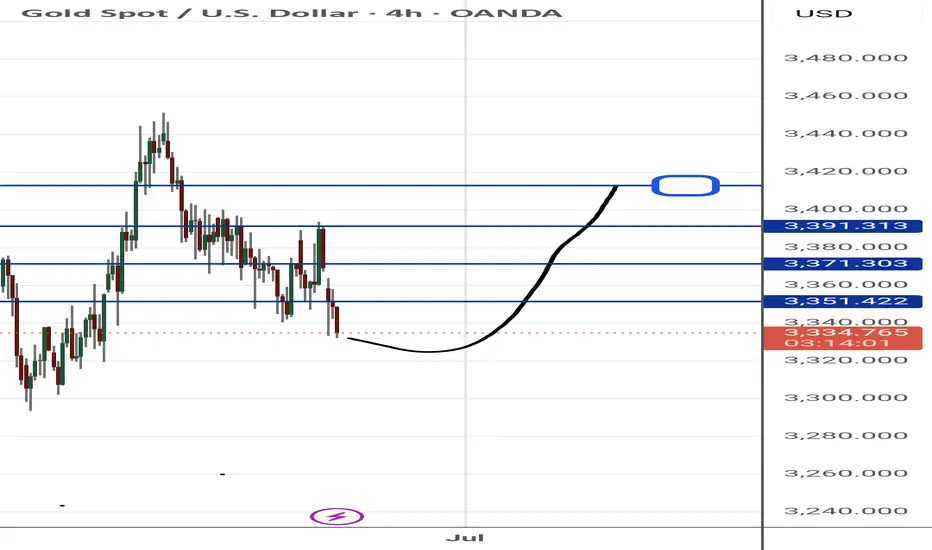
Gold Eyes $3,361 in Bearish Setup📊 Technical Analysis of Gold (XAU/USD) – 30-Min Chart
Chart Context:
Timeframe: 30-minute
Instrument: CFDs on Gold (USD/OZ)
Current Price: $3,386.282
Price Change: +14.757 (+0.44%)
Date: June 23, 2025
---
🔍 Key Observations:
1. Descending Triangle Formation
The chart shows a descending triangle, characterized by:
A flat support zone around the $3,351–$3,355 range.
A descending resistance trendline, suggesting lower highs over time.
This is typically a bearish pattern, indicating that sellers are pressuring price lower.
2. Breakout and Retest
There was a recent breakout above the descending trendline (highlighted with a blue move).
However, the price may be performing a false breakout or retest, as a downward arrow suggests a potential reversal back toward the support.
3. Volume and Market Sentiment
Although volume is not shown, the chart’s structure implies selling pressure is still dominant after each rally is rejected.
Price remains within a consolidation box, indicating indecision — but leaning bearish due to the triangle pattern.
---
🎯 Target: $3,361
The label "Target 3361" marks a likely support level if the bearish pattern plays out.
This is a measured move from the triangle height and structure, projecting downward from the breakdown point.
---
🛑 Support Zones
Strong demand zones highlighted in red between $3,325–$3,340.
If price breaks below $3,351, expect a drop to $3,325–$3,330, which are historical demand areas.
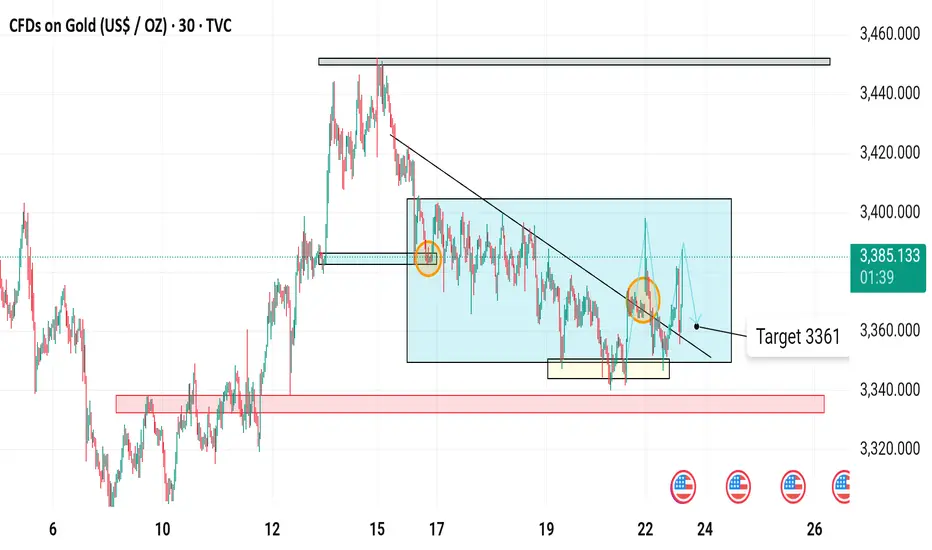
XAU/USD Bullish Reversal from Key SupportXAU/USD Bullish Reversal from Key Support 📈🟢
📊 Chart Analysis:
Rounded Bottom Structure ⬆️
The price has formed a rounded bottom pattern, indicating potential trend reversal from bearish to bullish.
Multiple bounces (🟠 circles) from the curved support trendline confirm the validity of this structure.
Support Zone Rejection ✅
Price recently rejected from a major horizontal support zone (around 3,303.796 USD) with a strong bullish wick.
This zone has acted as a springboard for prior upward moves.
Falling Wedge Breakout 💥
A falling wedge (bullish pattern) has formed and is breaking to the upside.
Breakout confirmation is underway, indicating momentum shift.
Target Projection 🎯
The projected move from the breakout suggests a potential target at 3,385.820 USD.
This aligns with previous resistance areas.
Key Levels to Watch:
Resistance: 3,385.820 USD (target) and 3,425–3,450 USD (major resistance zone)
Support: 3,303.796 USD (short-term), followed by 3,225–3,250 USD zone
🔔 Conclusion:
Price action suggests a bullish bias with a possible upward continuation if it sustains above the wedge breakout.
Confirmation above 3,330 USD with volume can fuel a rally toward the 3,385–3,400 USD target zone.
📌 Risk Management Tip: Watch for fakeouts near wedge resistance or a re-test of 3,303 USD for better entries.

Gold potential short term bullishness Gold prices have found some relief and are experiencing a minor recovery amidst the mixed market sentiment driven by ongoing Middle East tensions, Trump's call for rate cuts, and Fed Chair Powell's hawkish tone. This has led to an interesting market reaction. We might see short-term growth in gold prices after a retest of the liquidity zone below $3,320.
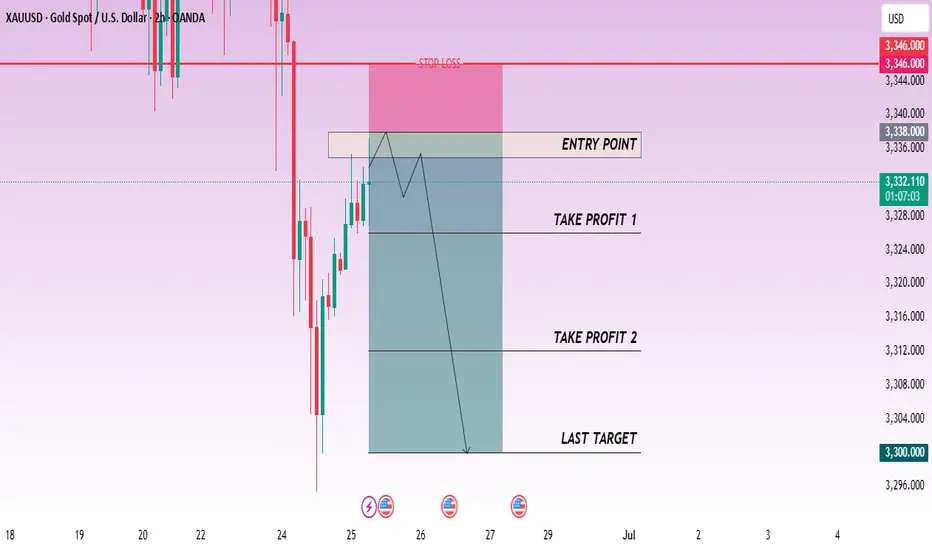
CHECK XAUUSD SIGNAL READ CAPTAINxauusd sell now ✅
entry point (2336) (3338)
TAKE PROFIT 1: (3326)
TAKE PROFIT 2: (3312)
LAST TARGET(3300)
STOP LOSS (3346)
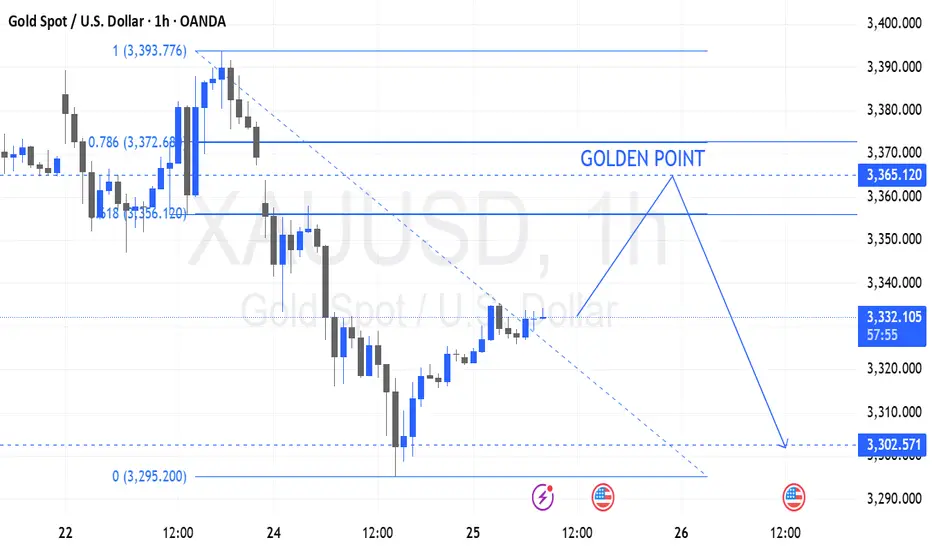
XAUUSD 1H Analysis – Golden Point in SightPrice is currently making its way toward the Golden Point zone at 3365.120, aligning with the 0.786 Fibonacci retracement from the recent bearish leg. This area also coincides with a descending trendline, adding confluence for a potential reversal setup.
📍 Key Levels:
🔹 Resistance: 3365.120 (Golden Point / 0.786 Fib)
🔹 Support: 3302.571 (Target zone)
🔹 Swing High: 3393.776
🔹 Swing Low: 3295.200
🎯 Trade Idea:
Watching for a potential rejection from the 3365 zone to catch a short down to the 3302.571 area. Bearish confirmation required around the Golden Point before entry.
📌 This setup follows the HurricaneFx Signature Strategy.
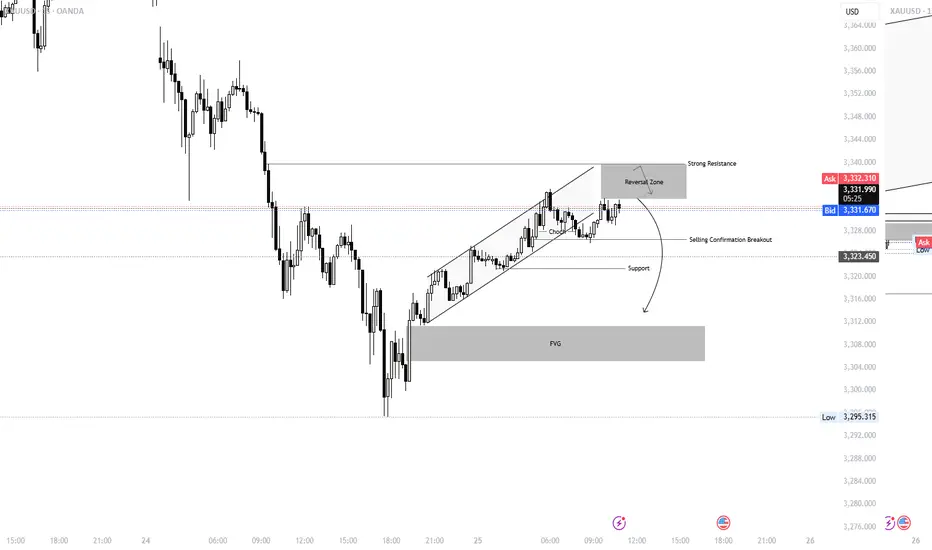
Trap Above? Reversal Brewing or Just a Pullback?Gold (XAUUSD) continues to play mind games near a strong intraday resistance zone. Price formed a nice bullish channel and just tapped into the reversal zone near 3335, aligning with past supply and liquidity sweep potential.
⚔️ After a Ch.o.C (Change of Character) broke minor structure, it’s likely we see:
A deeper reversal toward support at 3323.450
Or a full breakdown heading into the FVG zone near 3308–3310
If we get a selling confirmation breakout, expect a flush back into imbalance & maybe beyond 👇
📉 Technical Bias: Bearish Rejection Setup
🧠 Sentiment: Watching for sell signals post-liquidation
📍 Key Zone: 3330–3335 = SELL Interest
🔔 Trigger: Watch 3323.450 for clean confirmation
💬 Note for traders: This could be the “trap” before NY liquidity kicks in — manage risk tight!
Gold price short term recovery 3366⭐️GOLDEN INFORMATION:
Kansas City Federal Reserve President Jeff Schmid stated on Wednesday that the central bank has sufficient time to assess the impact of tariffs on inflation before making any decisions regarding interest rates. His remarks suggest a cautious approach and align with Fed Chair Jerome Powell’s comments from the previous day.
Chair Powell reaffirmed the view that there is no urgency to alter monetary policy, emphasizing a patient, data-driven approach as the Fed monitors economic developments. This less dovish tone from Fed leadership may help cap downside pressure on gold in the near term.
Meanwhile, money markets are fully pricing in two rate cuts by the end of 2025, with a September move seen as more probable than one in July—although expectations for a July cut have slightly increased since last week.
⭐️Personal comments NOVA:
Gold price recovered and continued to accumulate, pay attention to the GAP 3366 area at the beginning of the week, selling pressure is still maintained.
⭐️SET UP GOLD PRICE:
🔥SELL GOLD zone: 3366- 3368 SL 3373
TP1: $3358
TP2: $3345
TP3: $3330
🔥BUY GOLD zone: $3303-$3301 SL $3296
TP1: $3315
TP2: $3328
TP3: $3340
⭐️Technical analysis:
Based on technical indicators EMA 34, EMA89 and support resistance areas to set up a reasonable BUY order.
⭐️NOTE:
Note: Nova wishes traders to manage their capital well
- take the number of lots that match your capital
- Takeprofit equal to 4-6% of capital account
- Stoplose equal to 2-3% of capital account
XAUUSD - Breakdown: Israel-Iran Conflict - RISK OFF Part III missed to Publish my Idea here, I frequently share charts on my X handle for those who would like to follow, @JOHNDOUGHFX
OK let get into it.. I will publish my entire Idea as I did from the start of the sells, it has been quiet accurate but with terrible choppy PA.
FOMC likely a no move event. Rates to stay high due to tariff risks, Gold has been sentiment driven from last week-so Risk ON/OFF dominates.
Israel-Iran talks ongoing → expect noise + fake escalations before a “Deal"
Gold Order Flow zones at 3409 / 3450
Israel–Iran conflict = main wildcard.
Expect sudden headline moves: escalation threats → quick spikes.
But watch for fake outs followed by a “deal” headlines.
That’s your Risk ON trigger.
Buy the rumor, sell the news.
Key levels for OANDA:XAUUSD :
⚠️ Liquidity trap zone: 3409–3415
⚠️ Double top watch: 3448–3450 (psy level)
Below 3400, we could fade toward:
🔻 3350
🔻 3330
🔻 3322
Plan both sides, don’t chase breakouts.
For today's Analysis, Yesterday we have closed a bullish Doji Candle, signaling buyers, even though we broke below today, there was no selling pressure breaking the previous Daily low, and it has reacted close to As we have tapped the 39 Area, and pulled back, 43-45 if defended, will see price push higher into the high 65-70-75 extended Price Points before we can look for sells again.
As Iran - US tensions are now extended for 2 weeks, I believe the typical news escalations will keep price action on the edge, at present the market is sentiment driven with Risk OFF, so plan your trades accordingly. Risk ON can come with any optimistic news, especially a "DEAL"
Cheers and have a good last trading day!!