Xauusd Going Towards BuyDespite rising selling pressure on the dollar and mixed US PCE numbers, Gold prices fell further on Thursday, reaching new four-week lows around $3,260 per troy ounce. Collaborating with the decline, recent improvements in the Israel-Iran conflict continue to fuel investor withdrawals from the safe haven region.
XAUUSD.F trade ideas
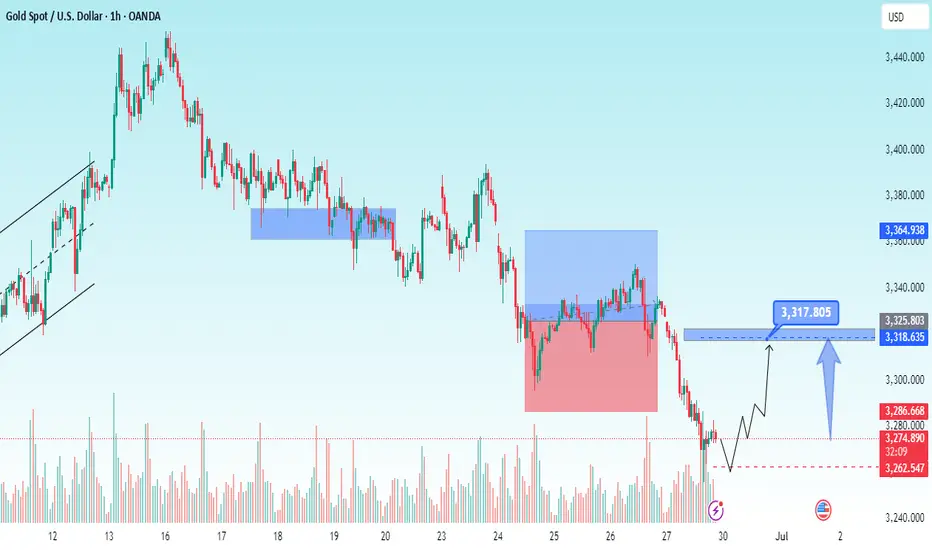
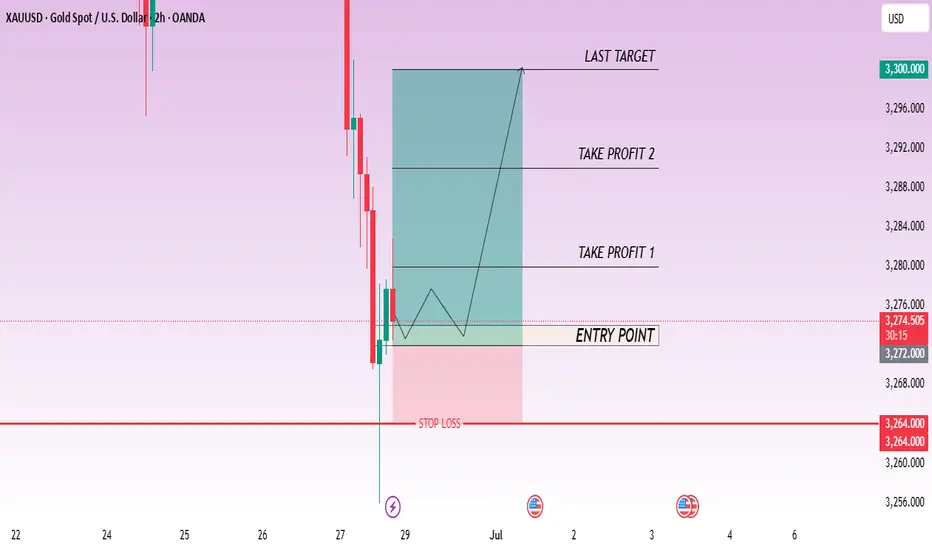
CHECK XAUUSD SIGNAL READ CAPTAINbuy Setup)
Entry Zone: Around 3274.000 \3272.000
Stop Loss: 3264.000
Take Profits:
TP1: ~3280.000
TP2: ~3290.000
Final Target: 3300.000
Bullish strategy around 3270 in US trading
Gold prices (XAU/USD) once again came under selling pressure during the Asian session on Friday, falling back below $3,300 following a lackluster performance the day before. Gold prices are approaching a two-week low hit on Tuesday as investors await the release of the US personal consumption expenditures (PCE) price index. This key inflation indicator is expected to provide a new interpretation of the Fed's policy outlook and could significantly affect the direction of the US dollar (USD), ultimately determining the short-term direction of this non-yielding gold.
Selling pressure last weekend caused gold prices to fall below 3300, and today the selling pressure continued to fall
⭐️Set gold price:
🔥Sell gold area: 3326-3328 SL 3333
TP1: $3315
TP2: $3302
TP3: $3290🔥
Buy gold area: $3248-$3250 SL $3243
TP1: $3260
TP2: $3270
TP3: $3280⭐️
XAU/USD: $3,350 is the key focus for bulls and bears.The gold price broke through the key level of $3,330 during the European session, which was what the bulls had been trying to break through last week. This level is both the 50-day moving average and the resistance point at the upper edge of the descending channel. Technical indicators show that buying power is accumulating.
However, $3,350 is a key resistance level above. If the gold price can break through strongly, it will target $3,400; conversely, it will look to the first support level of $3,330.
Recent news will dominate the trend of gold, and traders should trade cautiously.
XAUUSD
sell@3345-3350
tp:3330-3320
I am committed to sharing trading signals every day. Among them, real-time signals will be flexibly pushed according to market dynamics. All the signals sent out last week accurately matched the market trends, helping numerous traders achieve substantial profits. Regardless of your previous investment performance, I believe that with the support of my professional strategies and timely signals, I will surely be able to assist you in breaking through investment bottlenecks and achieving new breakthroughs in the trading field.
XAU/USD – Bullish Trend Faces Resistance at $3,350 XAU/USD – Bullish Trend Faces Resistance at $3,350 | Watch for Breakout or Pullback!
📅 Published on: Jul 01, 2025
✍️ By: MR_MARK0
🧠 Market Context:
Gold (XAU/USD) has been riding a strong bullish wave, pushing through multiple resistance levels. Currently, price is hovering just below the $3,350 resistance, which marks a critical level for either trend continuation or a potential pullback. Momentum remains in favor of buyers, but signs of exhaustion are beginning to surface.
🔍 Key Zones:
🔴 Resistance Zone: $3,350.0 – $3,352.5
🟢 Support Zone: $3,338.0 – $3,340.0
🟢 Demand Block: $3,310.0 – $3,315.0 (bullish base before recent breakout)
📌 Strategy in Play:
The chart reflects a Trend Continuation Strategy with key support/resistance zones identified. Price has shown strength, but we are now at a make-or-break level. Patience is crucial here.
🧭 Trade Idea:
🔁 Buy the Dip:
Entry Zone: $3,340 – $3,342
SL: Below $3,338
TP1: $3,352
TP2: $3,360
🔁 Breakout Play (Aggressive):
Entry: On breakout above $3,352 with bullish volume
SL: Below breakout candle low
TP: $3,360 and $3,372
⚠️ Risk Note:
Price is extended; a fake breakout above $3,350 may trigger a bull trap. If price fails and drops below $3,338, expect a corrective move toward $3,330 – $3,310. Watch volume divergence and candle rejection patterns.
Xauusd We can see on the 1hr,4hr that it’s hit a zone area , currently got lots of consolidation in the 1hr,15min,5min chart. Currently using 0.01 lot sizes at the moment for it to drop to 3315 area. Once it reaches there gold might go all the way down to 3345 area in the NY
XAUUSD I Trade Update Welcome back! Let me know your thoughts in the comments!
** XAUUSD Analysis - Listen to video!
We recommend that you keep this pair on your watchlist and enter when the entry criteria of your strategy is met.
Please support this idea with a LIKE and COMMENT if you find it useful and Click "Follow" on our profile if you'd like these trade ideas delivered straight to your email in the future.
Thanks for your continued support!Welcome back! Let me know your thoughts in the comments!

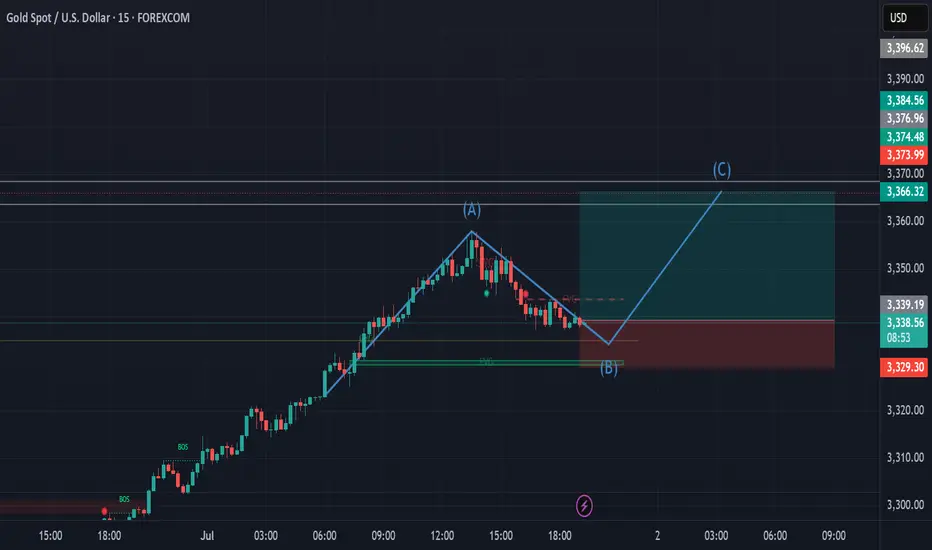
Long on XAUUSD on the 15M TF📉 XAUUSD 15m Setup
Clean bullish structure forming with potential ABC corrective pattern.
Expecting price to react from demand zone (B) and push toward 3366–3374 liquidity zone (C).
Break of structure confirmed, FVG filled — now waiting for continuation.
🔁 Let’s see if Gold delivers!
#XAUUSD #SmartMoney #PriceAction #TradingSetup #GoldAnalysis
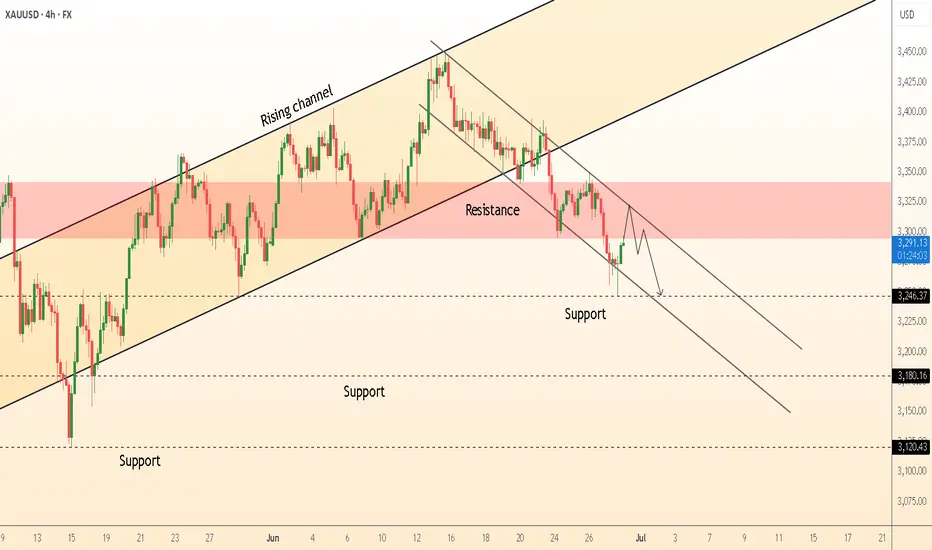
DeGRAM | GOLD under the resistance area📊 Technical Analysis
● Price broke the long-standing rising-channel floor, then formed a clean bear flag inside a fresh down-sloping channel; the flag’s ceiling coincides with the 3 300-3 310 supply band.
● Lower-high sequence and confluence of flag top with former support turned resistance favour continuation toward the mid-channel / fib pivot at 3 246, next 3 180.
💡 Fundamental Analysis
● Friday’s hotter US core-PCE and Fed governor Bowman’s “no cuts in 2025” comment lifted 2-yr yields above 4.80 %, firming the DXY and draining flows from non-yielding gold.
✨ Summary
Sell 3 290-3 305; hold below 3 310 targets 3 246 → 3 180. Short bias void on an H4 close above 3 310.
-------------------
Share your opinion in the comments and support the idea with a like. Thanks for your support!
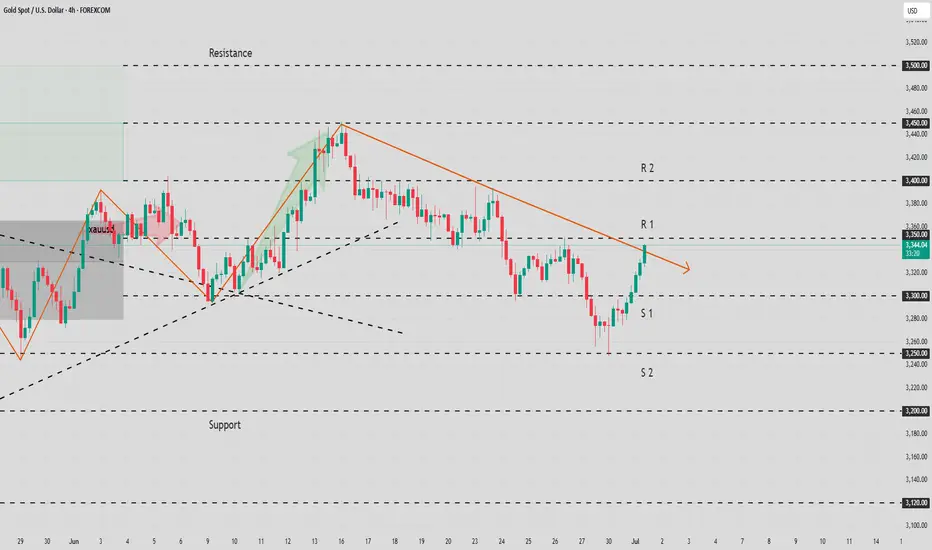
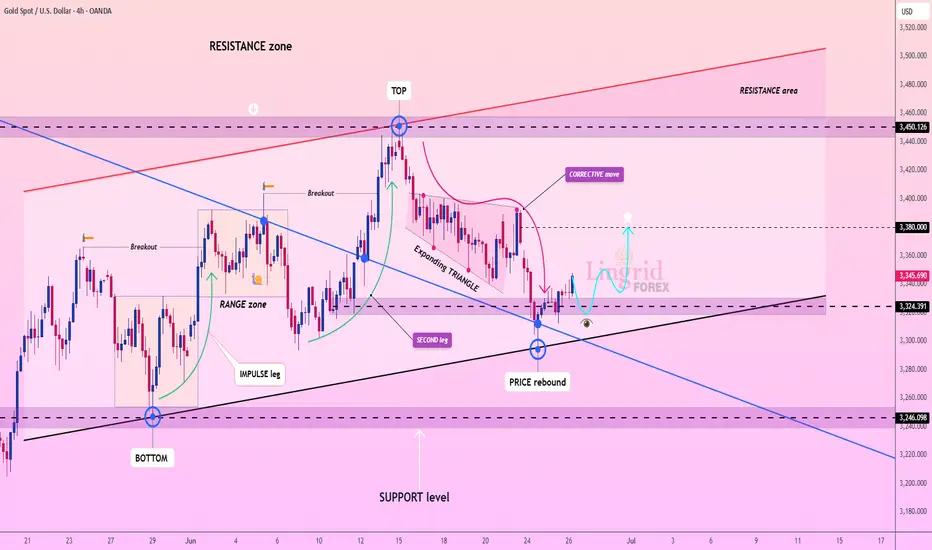
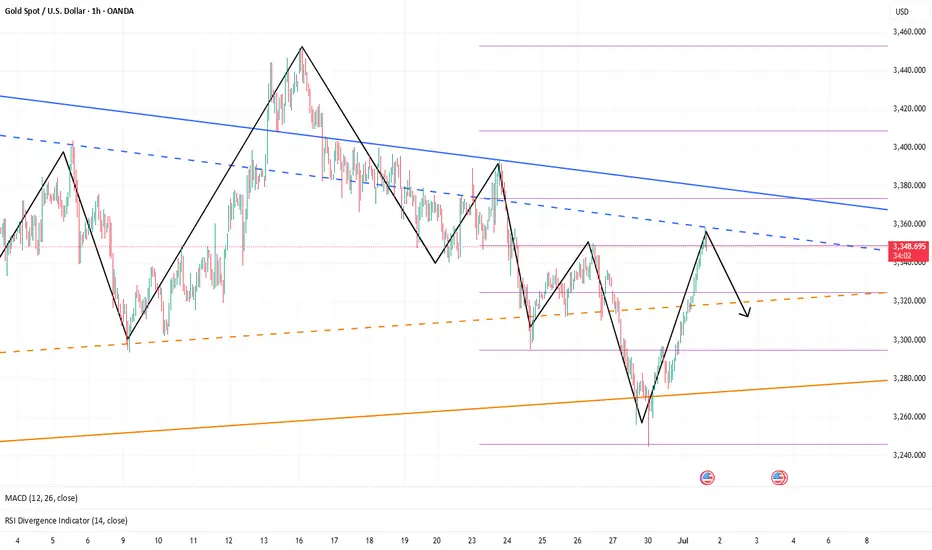
Lingrid | GOLD Potential Bullish Reversal TradeOANDA:XAUUSD is rebounding from key structure support after forming a double-leg corrective move inside an expanding triangle. Price has reclaimed the 3,324 zone, aligning with the trendline and support confluence, suggesting a short-term bullish bias. If this rebound sustains, gold could retest the 3,380 barrier before eyeing the 3,450 resistance ceiling. A rejection from mid-levels would reintroduce downside pressure toward the 3,246 zone.
📈 Key Levels
Buy zone: 3,320–3,330
Sell trigger: break below 3,324
Target: 3,450
Buy trigger: strong candle close above 3,380
💡 Risks
Weak volume could stall upside continuation
Failure to hold the trendline may drag price toward 3,246
Broader resistance zone between 3,380–3,450 could limit upside momentum
If this idea resonates with you or you have your own opinion, traders, hit the comments. I’m excited to read your thoughts!
GOLD 30Min Engaged ( Bearish Reversal Entry Detected )➕ Objective: Precision Volume Execution
Time Frame: 30-Minute Warfare
Entry Protocol: Only after volume-verified breakout
🩸 Bearish Reversal : 3370
Volume Poc + Value
➗ Hanzo Protocol: Volume-Tiered Entry Authority
➕ Zone Activated: Dynamic market pressure detected.
The level isn’t just price — it’s a memory of where they moved size.
Volume is rising beneath the surface — not noise, but preparation.
🔥 Tactical Note:
We wait for the energy signature — when volume betrays intention.
The trap gets set. The weak follow. We execute.
GOLD 30Min Engaged ( Bearish Reversal Entry Detected )
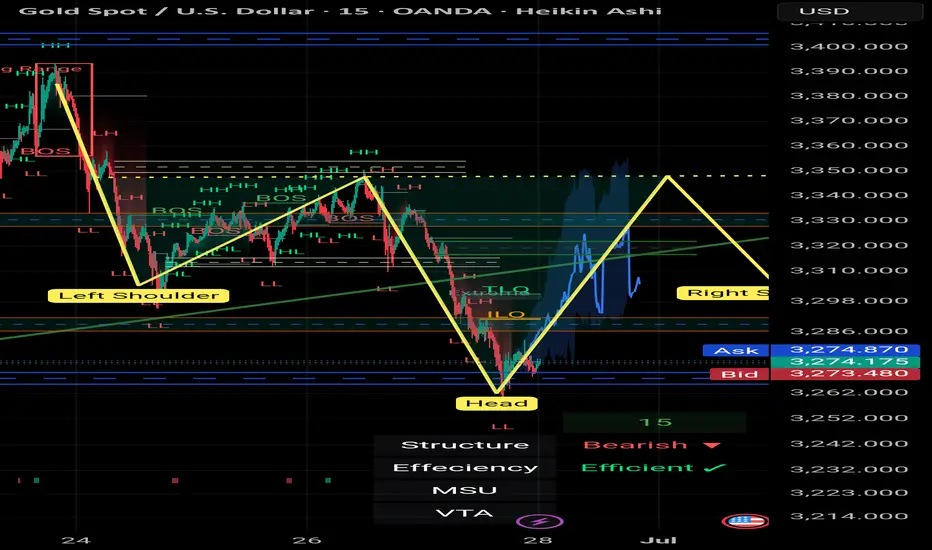
Reverse Head & Shoulders Setup | Gold Spot | 15min | by Mohsen M
🔸 **Chart:** Gold Spot / USD (XAU/USD)
🔸 **Timeframe:** 15min
🔸 **Method:** Smart Money Concepts (SMC) + Pattern Recognition
🔸 **Focus:** Reverse H&S, Order Blocks, TLQ, BOS
---
## 🔍 Market Context:
- **Market Structure:** Bearish on higher TF
- **Short-Term Trend:** MSU (Market Structure Up)
- **Efficiency:** ✅ Confirmed — clean price delivery
- **Key Pattern:** Bullish **Inverse Head & Shoulders**
---
## 🧠 Technical Breakdown:
1. **Left Shoulder – Head – Right Shoulder** perfectly forming within a high-value demand zone
2. Price reacted strongly from **Order Block (OB)** + TLQ marked at the bottom wick (Head zone)
3. BOS confirms bullish attempt to shift structure
4. Anticipating neckline break at ~3345 level for further upside
5. Potential resistance and liquidity resting above 3400 (HH region)
---
## 📌 Trading Plan (Pre-London Open / Monday 1:30 AM UTC+3:30):
- **Entry Idea:**
Watch for bullish confirmation after price stabilizes above Right Shoulder zone (~3300–3320)
Or re-entry on a retest of neckline after breakout
- **Stop Loss:**
Below "Head" and OB zone (~3260)
- **Take Profits:**
- TP1: Neckline break zone (~3345)
- TP2: 3400 – Liquidity pool
- TP3: Final HH sweep (~3420+)
---
## ⚠️ Alternate Bearish Case:
> If price breaks below the "Head" zone and OB fails to hold,
> → Expect bearish continuation to the next liquidity zone near **VTA @ 3200**
---
## ✅ Summary:
This is a clean **bullish reversal setup** using SMC logic and a classic H&S pattern:
**OB + TLQ + BOS + Efficient Market + Clear Pattern ➝ High-Probability Setup**
Structure: 🟥 Bearish (macro)
Trend: 🔼 MSU (micro)
Efficiency: ✅ Efficient
Pattern: 🟩 Inverse Head & Shoulders
---
📊 Prepared by: **Mohsen Mozafari Nejad**
Gold setup: ascending triangle and Trump’s debt bombGold just formed an ascending triangle, and a breakout could send it $300 higher. In this video, we analyse the new pattern, the key breakout level, and why Trump’s new tax bill and Powell’s potential replacement could spark a major move. Will fundamentals match the technicals? Watch to find out.

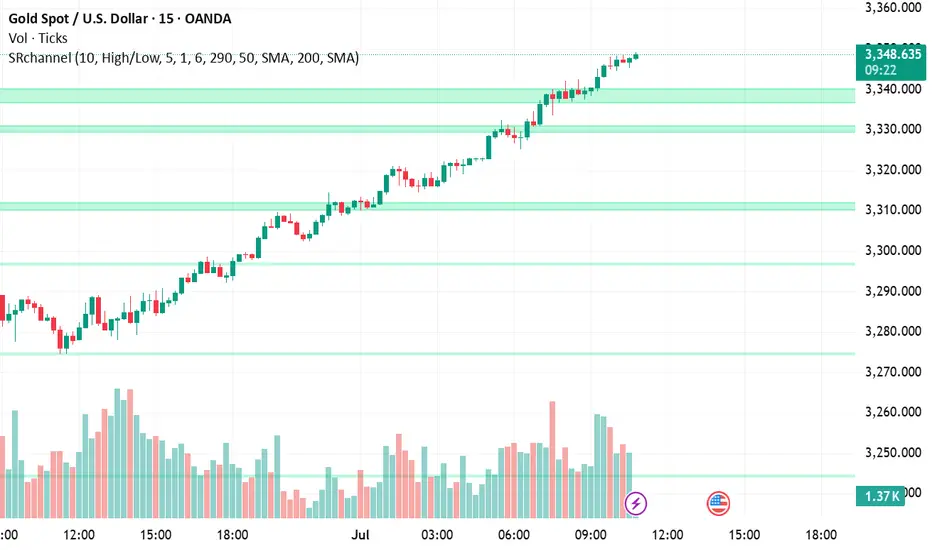
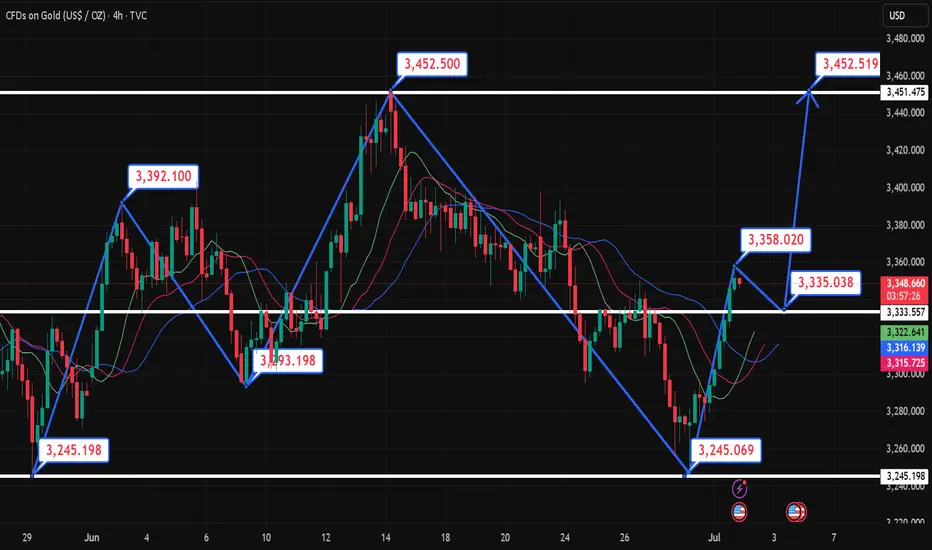
XAUUSD: Gold Surges on U.S. Fiscal Reform ExpectationsGold remains firmly within a short-term bullish structure after rebounding strongly from the $3,258 support zone and forming a consolidation pattern just below the $3,342 resistance. This area marks the confluence of a descending trendline and a fair value gap (FVG), where buyers may gather momentum to break through.
Fundamental news continues to favor the upside: concerns over the U.S. budget deficit and an upcoming tax reform package have boosted safe-haven demand for gold. Meanwhile, U.S. bond yields and the dollar remain low, further driving capital into precious metals.
Yesterday, gold rose by approximately $33.49, equivalent to 3,349 pips, confirming strong bullish inflows. If price breaks above the $3,342–$3,356 zone, the next target could extend beyond the $3,400 mark.
However, if short-term pullbacks occur, the $3,258 area remains a key support level to watch for potential bullish re-entry signals.
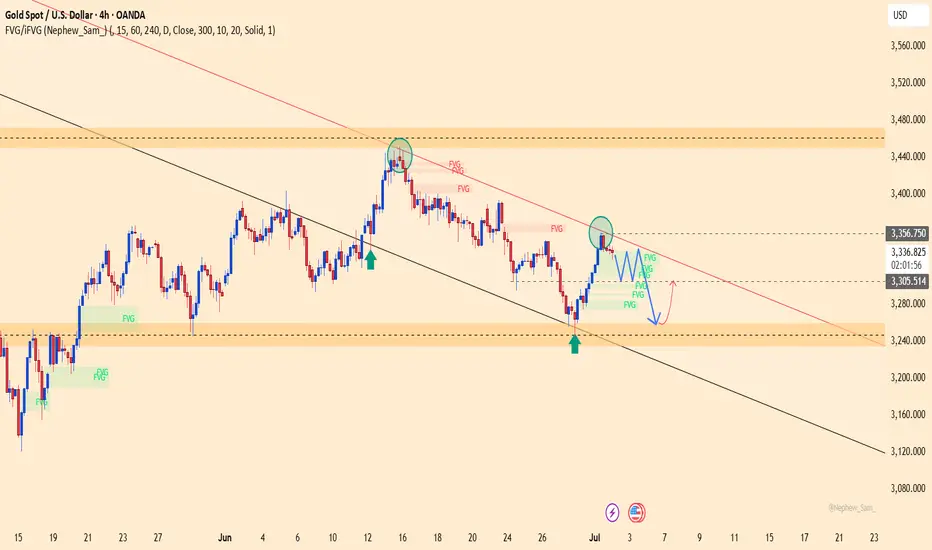
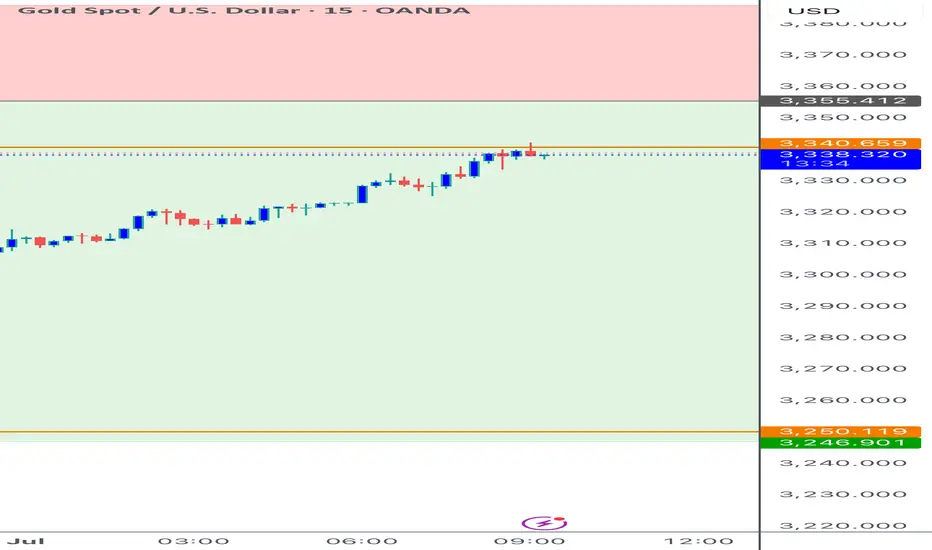
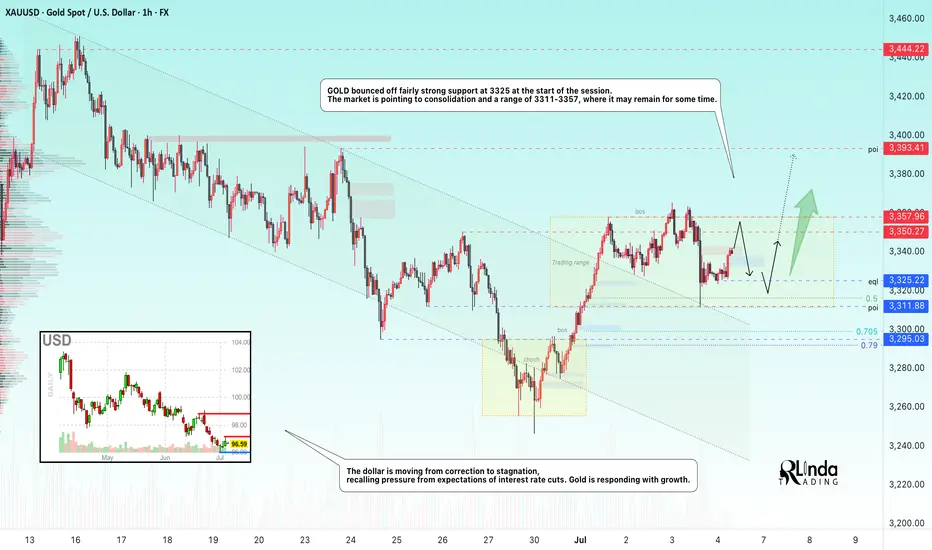
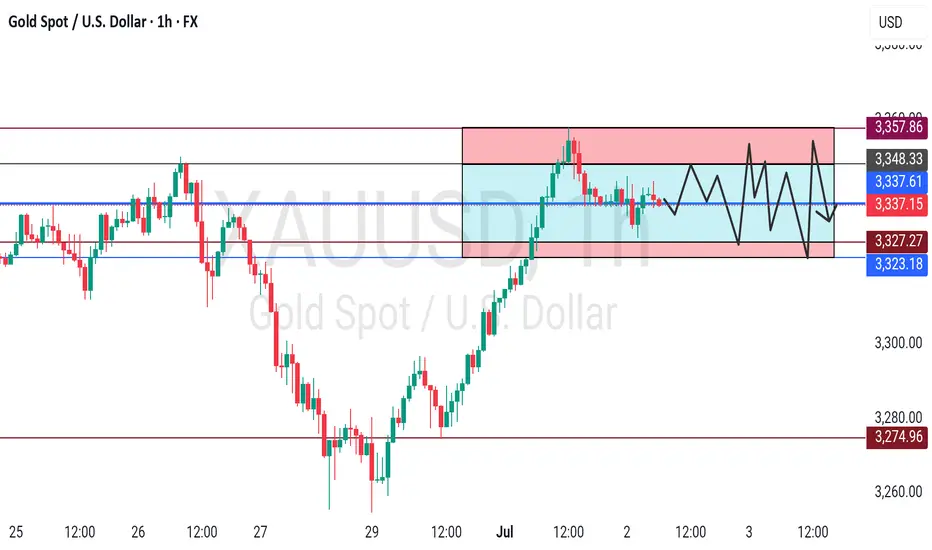
GOLD → Consolidation after a trend break...FX:XAUUSD , after breaking out of a downtrend, is consolidating, which may continue for some time due to Thursday's news and low liquidity on Friday.
Gold stabilized after a correction, but volatility risks remain. After falling from a weekly high of $3,366, gold prices found demand again in Asia on Friday. Strong US employment data cooled expectations of an imminent Fed rate cut, which supported the dollar and limited gold's gains. Additional pressure is coming from the hawkish shift in Fed expectations, but US budget risks and weak liquidity due to the holidays could increase price volatility in the coming days.
Technically, the focus is on the boundaries of the current consolidation at 3311 and 3357. In addition, within the range there is an important level of 3325, which divides the market into bearish and bullish zones...
Resistance levels: 3350, 3357, 3393
Support levels: 3325, 3311
It is important to understand the situation: due to the holiday in the US, liquidity is lower, making it easier to move the price. The rest of the world, interested in gold, can easily push the price up. The trigger will be the zone 3350 - 3350. There is a chance that the market will try to break through the resistance without a pullback and continue to rise to 3393.
However, the most likely scenario is that after yesterday's volatility, gold will remain within 3325 - 3357 before rising next week
Best regards, R. Linda!
GOLD BUY + SHORT TRADE IDEA Buy Signals !
We Are Looking For Buy trade Reasons : Consolidating Upto Demand Thats We Are Looking For A Bullish Move to Supply Zone
Buy Zone : 3269-3263
Targets : 3300/3325
SL : 3255
Sell Signal !
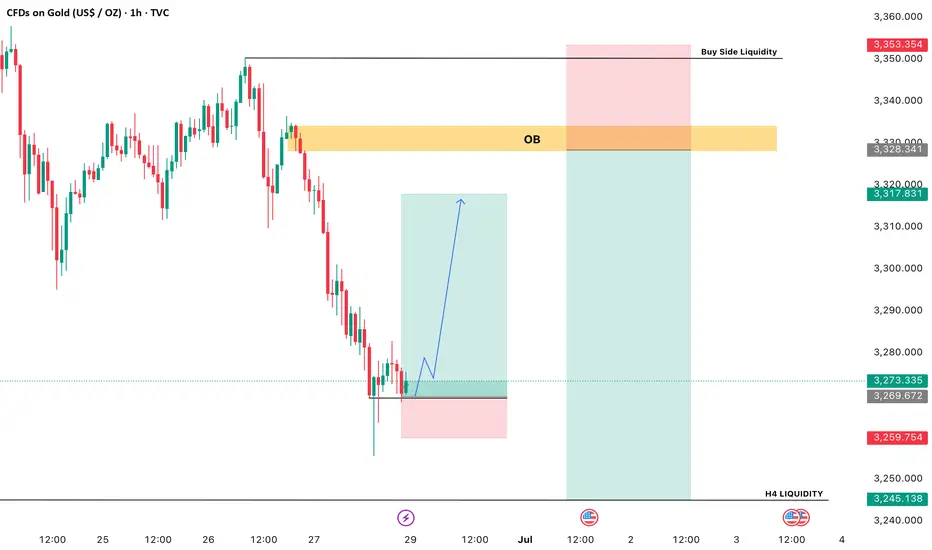
We Are Looking For Best Sell Trade Reasons : Order Block H1 + H4 Thats We Are Take Sell With Best Entry With High Target Sell Side Liquidity
Sell Zone : 3327-3334
Target Sell Side Liquidity - 3245-3250
SL 3345
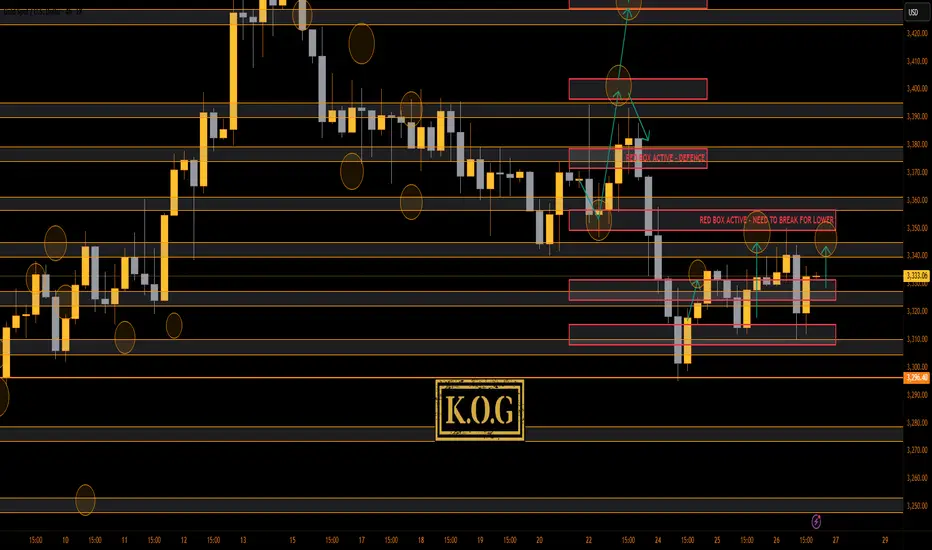
THE KOG REPORT - UpdateEnd of day update from us here at KOG:
Again, just like yesterday, we completed the long trade into the red box, RIPPED then played red box hockey before swooping the low and coming back up. What madness on the markets with continuous whipsawing which is not allowing traders to hold positions without huge stop losses.
For now, we have support at the 3325-8 level which if held should give us a move upside towards the red box. What we want to see here is do we get a lower high or not?
MA's still drawn together and more choppy price action expected in the sessions to come.
As always, trade safe.
KOG
GOLD - Range bound, Need to stay calm??#GOLD.. .be ready for a headache range bound move guys,
It will be very choppy so don't be panic and dont expect too much.
It will be messy.
Good luck
Trade wisely
I hold on to my short position and wait patiently.Currently, gold continues to rebound to around 3358, and there has been no decent retracement during the rebound, so during the trading period, apart from chasing the rise, there are almost no opportunities to go long on gold; so is the steady rise in gold during the day brewing a bigger rally?
I think there are three reasons for the continued rise of gold:
1. The continued weakness of the US dollar provides support for the strong rise of gold;
2. The trapped long chips have recently shown self-rescue behavior, and strong buying funds have driven gold up;
3. The market intends to eliminate and kill a large number of shorts in recent times;
Based on the above reasons, I think it is not a wise decision to chase gold at present; on the contrary, I still prefer to short gold in the short term, and I still hold a short position now; the following are the reasons to support my insistence on shorting gold:
1. The US dollar has a technical rebound demand after a sharp drop, which will limit the rebound space of gold and suppress gold;
2. After the recent trapped long chips successfully rescue themselves, they may cash out in large quantities, thereby stimulating gold to fall again;
3. While killing the shorts, the market has also lured a large number of long funds to a certain extent. Based on the above reasons, I currently still hold short positions near 3345 and 3355, and hope that gold can retreat to the 3335-3325 area.
7.1 Technical guidance for short-term gold analysis!!!Gold hourly level: From the opening to now, it has been rising slowly with a small negative in the middle. It is all positive. This kind of pull-up pattern must not be tested for shorting. During the European session, it also broke through the upper rail resistance of the 3335 downward channel. There is a second pull-up in the US session; but it has not been able to step back, and even the 10-day moving average does not give a chance. If you want to step back and follow the long position, there is no chance for the time being, and going long directly seems more radical; conservative can wait patiently, be bullish, and don't go short; if it can be confirmed tonight that it is above 3335, you can try to follow the bullish trend, and the upper resistance target is 3374;
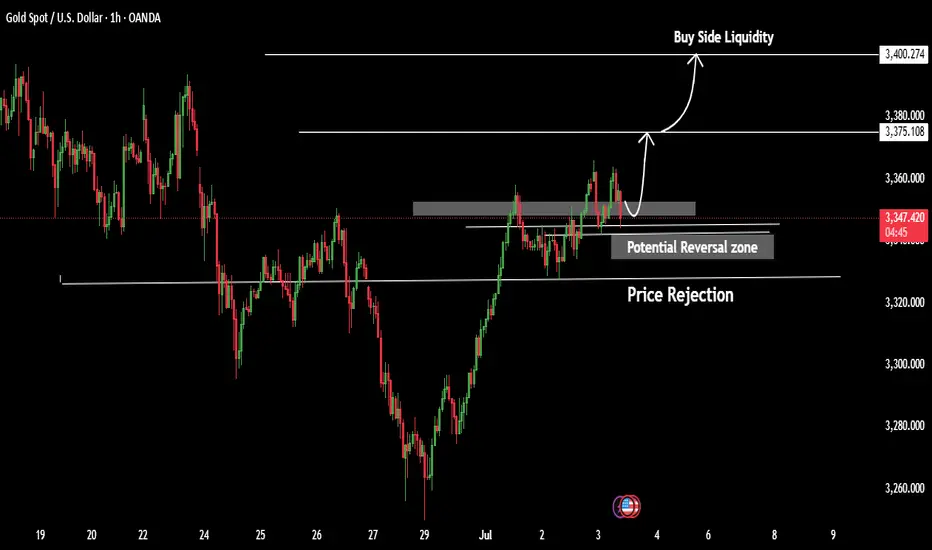
GOLD Price Accept Very Highly Bullish Pattern.XAUUSD GOLD Price Accept Very Highly Bullish Pattern.
Gold Attacked the Resistance lines 3350 / 3328 as price pulling back to this zone,
Gold futures rise as investors await crucial U.S economic data The previous metal has ticked higher ahead of U.S Nonfarm payroll data due later Thursday the data will be closed analysed for fresh signals on the Economic outlooks for more reasons,
i Expect Gold have a chance to have rise back top resistance 3375 / 3400 we will see today these target in NFP Data Biggest news of month we will expect Big changes and also big highly movement in NFP now we are focus on US Data price could breakout.
You may look details in chart Ps Support with like and comments for more analysis.
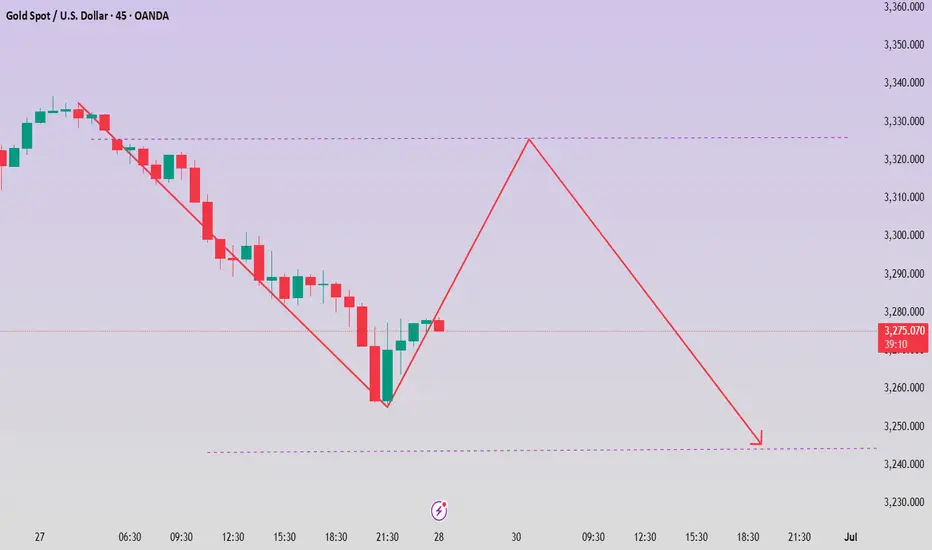
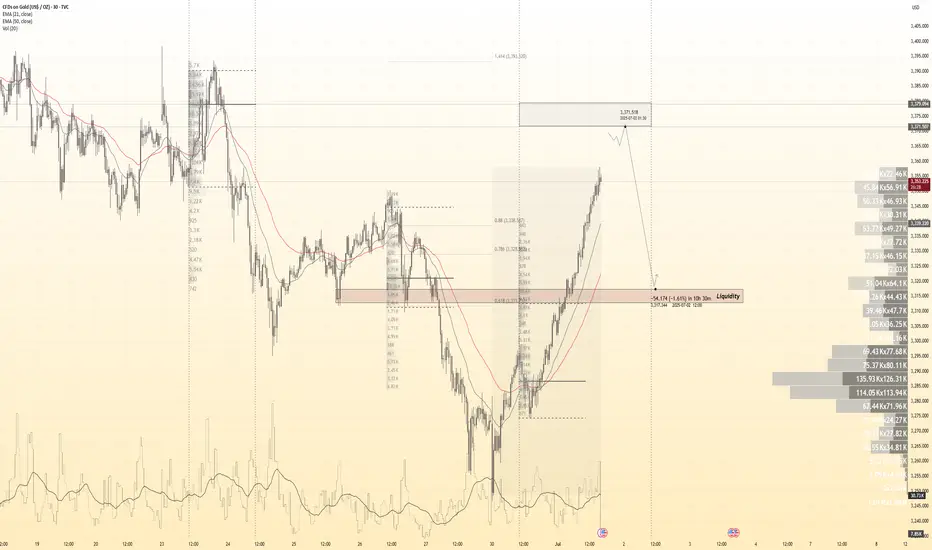
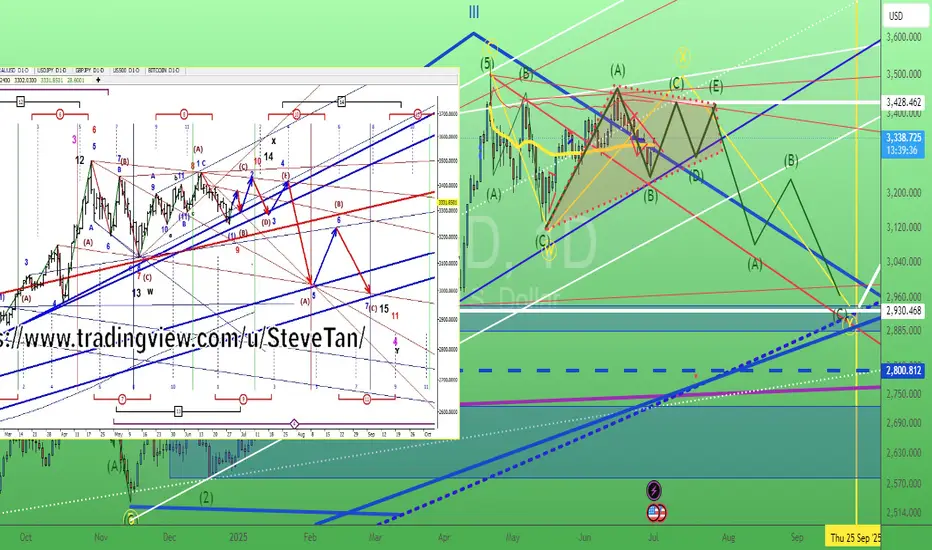
Gold. Path toward <3000. 1/July/2025XAUUSD, will gold reach ATH soon or below 3000 first?.. Based on cycle analysis and wave structure 50-50, make your own trading decision...
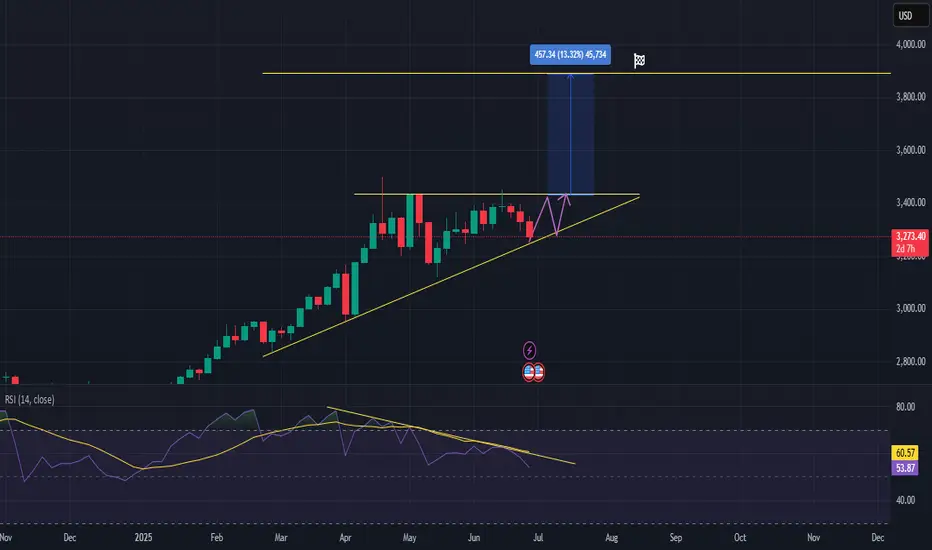
XAUUSD Forming Bullish Continuation Patternhi traders,
let's have a look at Gold on 3D time frame.
✅ Technical Outlook:
Uptrend Still Intact
Price action remains firmly within a higher high, higher low structure, confirming that Gold is still in an active uptrend.
* We can observe the Ascending Triangle Formation.
An ascending triangle has formed, with the price consistently finding support on a rising trendline while pressing against the horizontal resistance around $3,430.
This pattern typically acts as a bullish continuation, especially within strong trends.
Potential Breakout Target
If XAUUSD breaks above the horizontal resistance, the measured move (height of the triangle) points to a potential upside of ~13.32%, targeting the $3,880–3,900 zone.
RSI Observations
The RSI is consolidating just above 50 and remains in bullish territory. A breakout above the RSI trendline would further support bullish momentum.
📌 Trade Scenario (Plan A – Bullish Breakout):
Entry: Upon breakout and daily close above ~$3,430
Target: ~$3,880
Support Trendline: Acting as dynamic support
📌 Alternate Scenario (Plan B – Retest):
Price may retest the ascending trendline support before attempting a breakout. This would offer a lower-risk entry opportunity with tighter invalidation.
🧠 Summary:
Gold remains in a strong uptrend, and the formation of an ascending triangle suggests a likely continuation to the upside. Watch for a breakout confirmation above the horizontal resistance for a potential high-probability long setup.