Gold price rises by more than $100, will the bull run continue?📰 News information:
1. Geopolitical situation
2. PMI data
3. Global Central Bank Governors Meeting
📈 Technical Analysis:
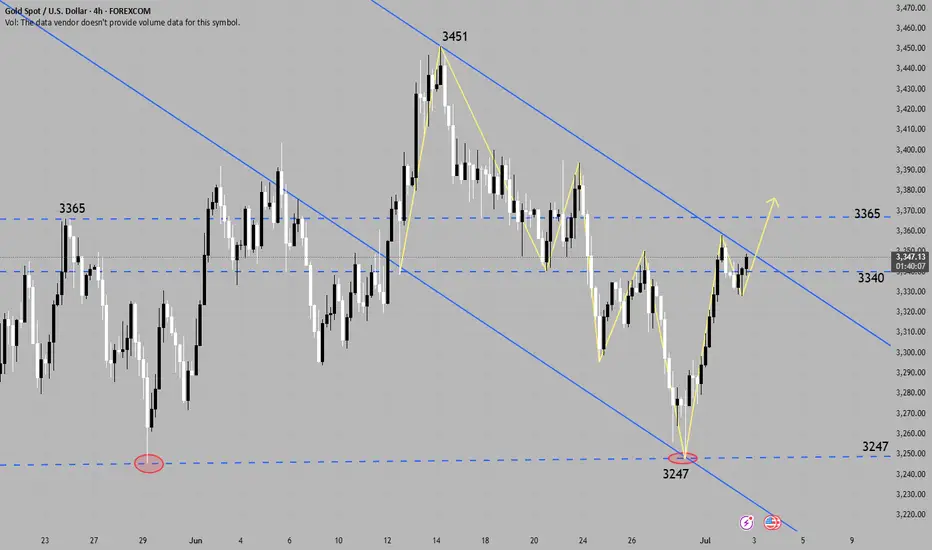
The NY session is about to begin, and there are two things we need to pay attention to. First, the PMI data, and second, the talks between global central bank governors. If Powell again hints that the inflation outlook is weaker than expected, this will increase the Fed's easing bets and trigger a new round of decline in the US dollar. The dovish tone may help gold prices to further rebound. On the contrary, if Powell makes some hawkish or cautious remarks, this may exacerbate the recent downward trend in gold prices. The key point at present is the 3350 mark. If the 4H closing line of the NY session remains below 3350, then in the short term we are expected to continue to retreat to the 3330-3320 range. If the 4H closing line is above 3350 and stabilizes, gold may rebound to the 61.8% position, which is around 3372.
🎯 Trading Points:
SELL 3340-3350-3355
TP 3330-3325-3320
BUY 3330-3320
TP 3340-3350-3372
In addition to investment, life also includes poetry, distant places, and Allen. Facing the market is actually facing yourself, correcting your shortcomings, confronting your mistakes, and strictly disciplining yourself. I hope my analysis can help you🌐.
FX:XAUUSD FXOPEN:XAUUSD PEPPERSTONE:XAUUSD FOREXCOM:XAUUSD FX:XAUUSD OANDA:XAUUSD TVC:GOLD
XAUUSD.F trade ideas
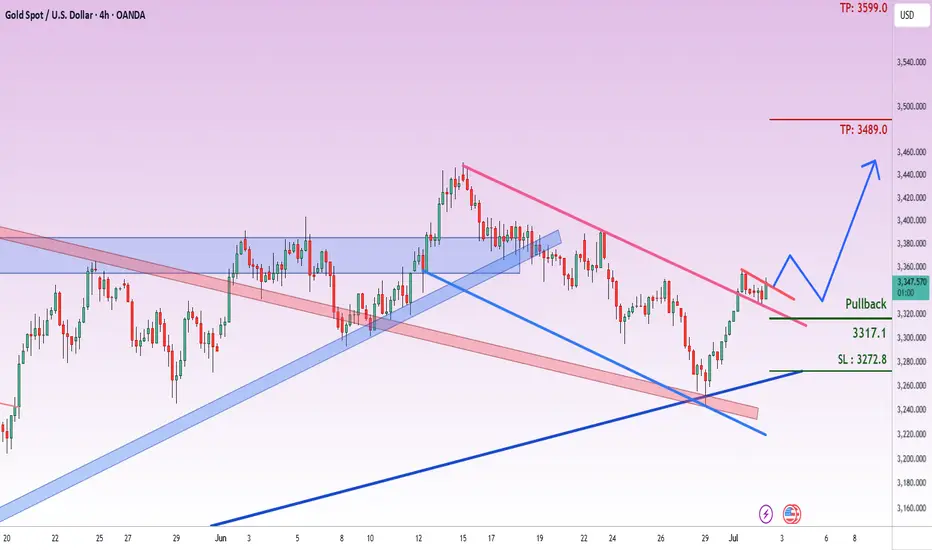
Repurchase position with a less risky strategyNow the price has managed to break the dynamic resistance line
So we can re-enter the buy position with a less risky strategy
Trading Setup:
There is a Trading Signal to Buy in Gold XAUUSD (4h)
Traders can open their Buy Trades NOW
⬆️ Buy now or Buy on 3317.1
⭕️SL @ 3272.8
🔵TP1 @ 3489.0
🔵TP2 @ 3599.0
#Signal #forexsignal
What are these signals based on?
Classical Technical Analysis
Price Action Candlesticks Fibonacci
RSI, Moving Average , Ichimoku , Bollinger Bands
GOLD ROUTE MAP UPDATEHey Everyone,
A PIPTASTIC day on the markets with our analysis playing out in true level to level fashion.
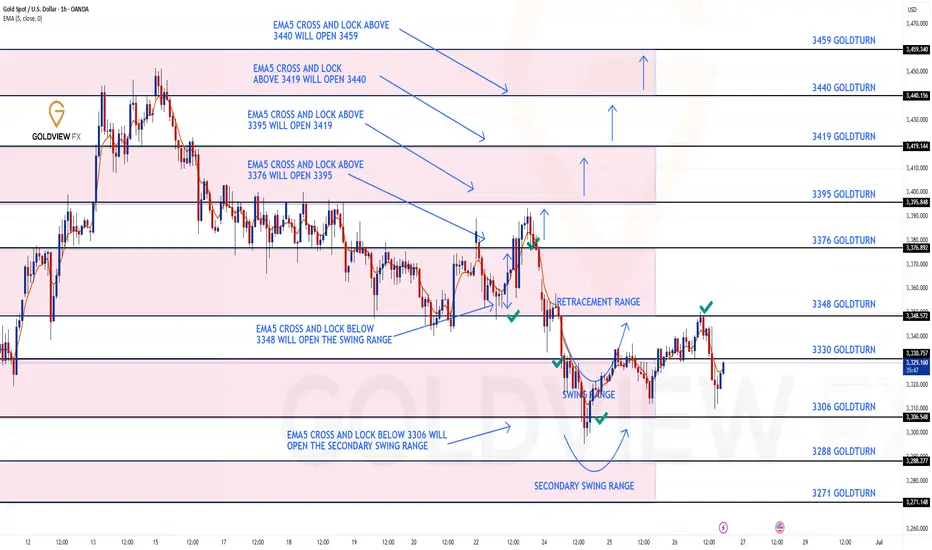
Yesterday we stated that that we had the cross and lock below 3348 opening the swing range, which was hit perfectly and gave the bounce and that we will now wait to see if the full swing is completed to 3348.
- This was played out to perfection with the full swing completed into 3348. No further lock above confirmed the rejection back into the swing range.
We will continue to buy dips using our support levels taking 20 to 40 pips. As stated before each of our level structures give 20 to 40 pip bounces, which is enough for a nice entry and exit. If you back test the levels we shared every week for the past 24 months, you can see how effectively they were used to trade with or against short/mid term swings and trends.
The swing range give bigger bounces then our weighted levels that's the difference between weighted levels and swing ranges.
BULLISH TARGET
3376 - DONE
EMA5 CROSS AND LOCK ABOVE 3376 WILL OPEN THE FOLLOWING BULLISH TARGETS
3395
EMA5 CROSS AND LOCK ABOVE 3395 WILL OPEN THE FOLLOWING BULLISH TARGET
3419
EMA5 CROSS AND LOCK ABOVE 3419 WILL OPEN THE FOLLOWING BULLISH TARGET
3440
BEARISH TARGETS
3348 - DONE
EMA5 CROSS AND LOCK BELOW 3348 WILL OPEN THE SWING RANGE
3330 - DONE
3306 - DONE
EMA5 CROSS AND LOCK BELOW 3306 WILL OPEN THE SECONDARY SWING RANGE
3288
3271
As always, we will keep you all updated with regular updates throughout the week and how we manage the active ideas and setups. Thank you all for your likes, comments and follows, we really appreciate it!
Mr Gold
GoldViewFX
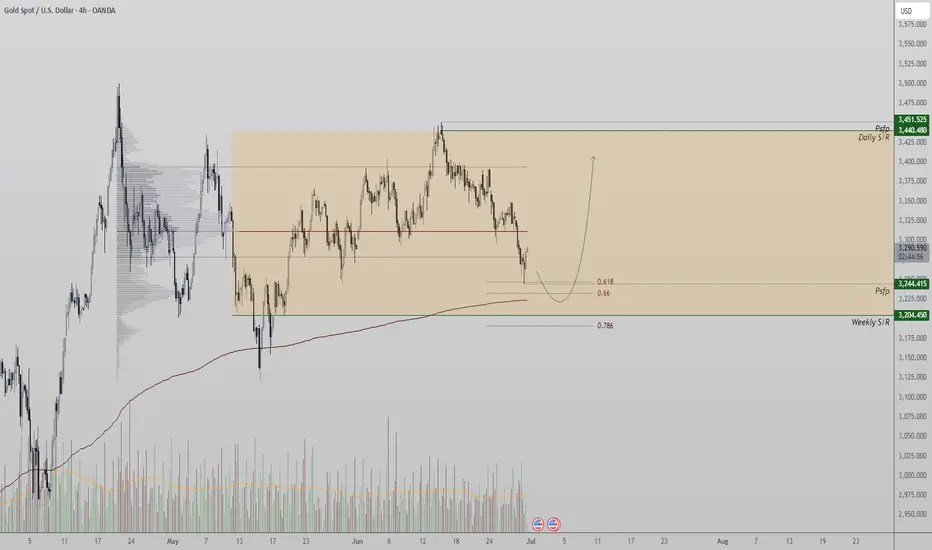
Gold Approaching Key Support – Reversal Zone at $3,200 in SightGold has entered a corrective phase after topping out around the $3,450 region. Price action is steadily pulling back, but it’s now approaching a critical support level near $3,200 — a zone we’ve highlighted in recent updates as a potential area for bullish interest.
From a technical standpoint, the $3,200 level is a confluence zone:
- 0.618 Fibonacci retracement from the recent swing
- VWAP support anchored from the prior impulse move
- This cluster of technical factors strengthens the probability of a reaction here.
The broader context shows gold trading within a high time frame range, oscillating between resistance near $3,450 and support around $3,200. These two boundaries define a clear trading range, where rotations between key levels have been consistently respected.
For the next leg higher to materialize, we need to see signs of accumulation or bullish structure forming on the lower time frames. Without this confirmation, the risk of further downside remains. However, if price can find a foothold here, a rotation back toward resistance is the likely outcome — continuing the established range dynamics.
Watch me make $125 liveafter a brutal night in the markets looking to recoup from the losses I took and regain my momentum before we close the trading week tomorrow.

GOLD (XAU/USD) Breakdown Imminent: SK System Signals Further DowThe 4-hour chart for GOLD (XAU/USD) shows the price is currently testing a critical support zone around $3,224.18, which aligns with previous swing lows and a confluence of technical factors. The SK System, which combines price action, support/resistance levels, and momentum indicators, highlights the following key observations:
Support Zone: The price has reached a strong historical support level near $3,224.18, where buyers have previously stepped in. This zone is further reinforced by the nearby psychological level of $3,200.00.
Prediction:
Bearish Scenario: A decisive close below $3,224.18 with increasing volume may extend the downtrend toward $3,150.00 or lower.
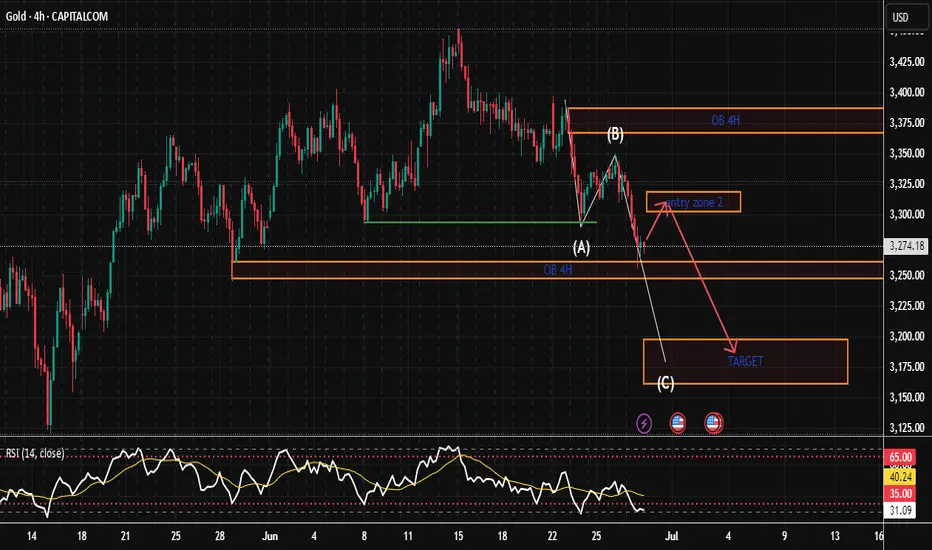
Bearish Setup for GoldGold is currently in a retracement phase after breaking below the mid Keltner channel zone. The small upward arrow marks this temporary relief rally, which I anticipate will be short-lived.
Price is testing the lower band of the inner Keltner channel after rejecting from the upper zones. The structure suggests a classic lower high formation before a potential major sell-off, targeting the deeper liquidity zones around $3,218 – $3,160 and possibly $3,080 if momentum accelerates.
📉 Bias: Bearish
📌 Invalidation: A clean break and close above the red resistance block (~$3,320+)
📌 Target Zones: $3,218 → $3,160 → $3,080
🔔 Look for volume drop and wick exhaustion confirming the next leg down.
This retracement may offer one final short entry opportunity before a deeper correction unfolds.
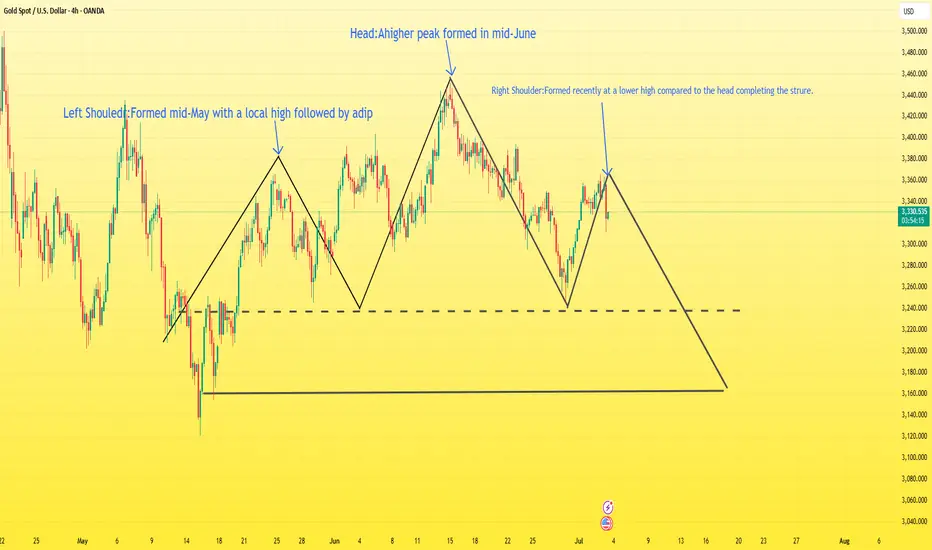
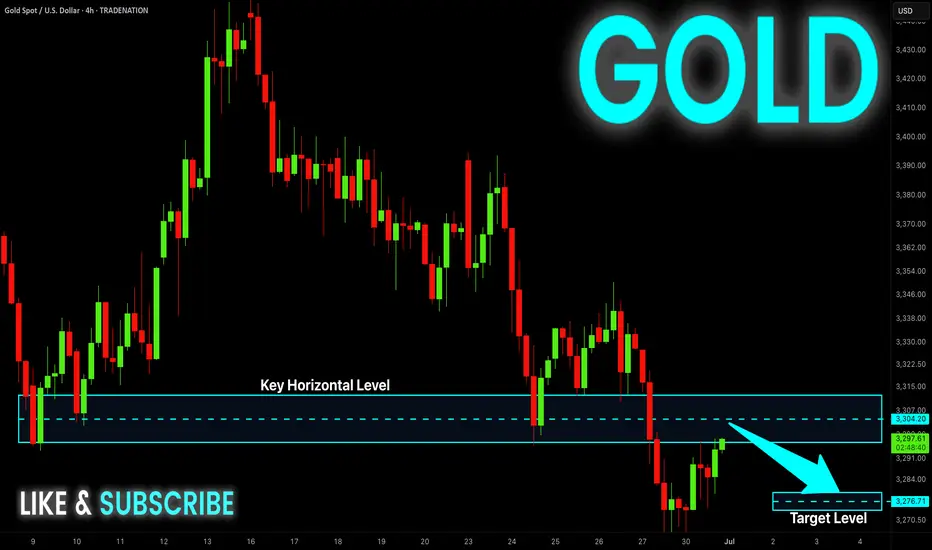
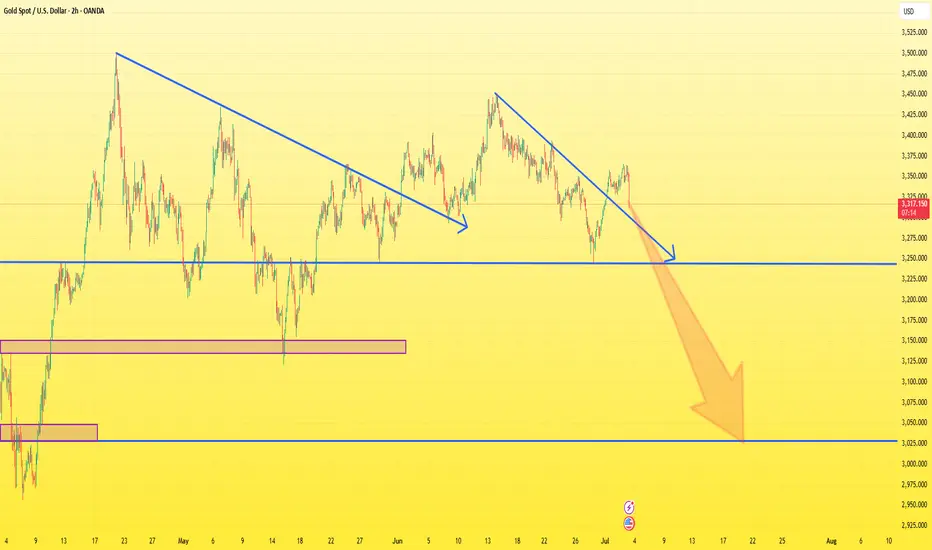
Will gold return to 3500?XAU/USD Head and Shoulders Breakdown Analysis
The chart shows a classic Head and Shoulders pattern forming on the 4H timeframe, indicating a potential bearish reversal setup.
Left Shoulder: Formed mid-May with a local high followed by a dip.
Head: A higher peak formed in mid-June.
Right Shoulder: Formed recently at a lower high compared to the head, completing the structure.
The neckline has been clearly defined, and price is currently hovering just above it. If the price breaks and closes below the neckline with strong bearish momentum, it would confirm the pattern.
Target: The projected target from the breakdown is around 3163, calculated by measuring the height from the head to the neckline and projecting it downward.
Outlook:
A confirmed break below the neckline would open the door for further downside toward the target zone.
Bears will be in control if price sustains below the neckline with increasing volume.
Wait for confirmation on the neckline break before considering short entries.
If you are a newbie or your account is burning, don't trust any advice easily. Contact me. I will give you free advice.
Gold Setup for July 3th: Don’t Get Caught in the Liquidity Net🌙 Good evening, sniper — lock in, load up, and let’s dance with Thursday’s chaos 💣
🌍 Macro & Geopolitical Pulse
Thursday’s setup is not for amateurs:
🔸 Non-Farm Employment Change
🔸 Unemployment Rate
🔸 Initial Jobless Claims
🔸 ISM Services PMI
🔸 Factory Orders
Add to that:
• A Fed still talking tough on rates
• Geopolitical flare-ups in the Black Sea and Middle East
• Gold trading deep into premium…
💡 This is where markets hunt weak hands, then flip direction without mercy.
We don’t chase candles. We wait for exhaustion. Then we execute.
🎯 Bias Snapshot (D1 → H4 → H1)
• Daily closed bullish but deep into old CHoCH + OB
• H4 printed HHs, but structure now presses into stacked supply
• H1 shows momentum fading — RSI divergence + weakening push
📌 Core bias: Still bullish — but every pip above 3360 is loaded with risk.
If 3380 fails to break cleanly, expect rejection.
If it breaks — the market likely wants full liquidity above 3400.
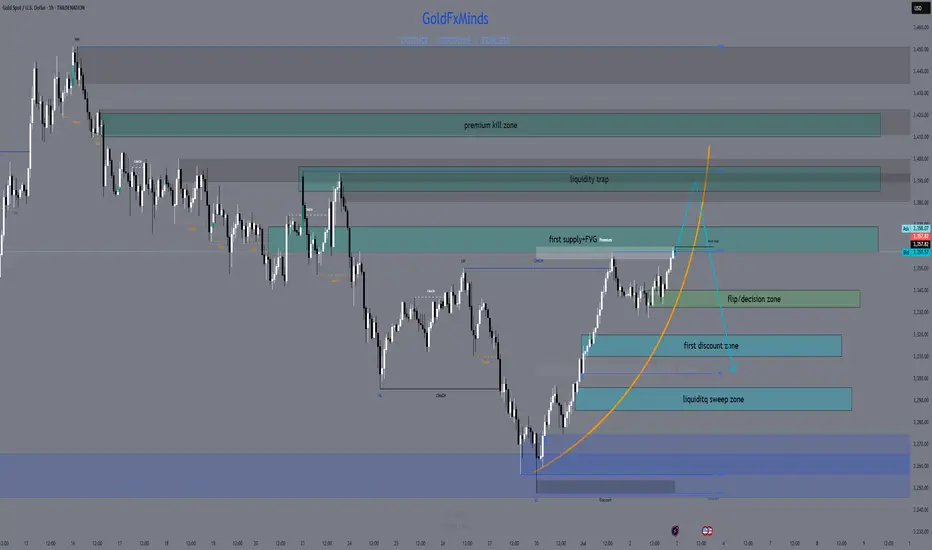
🗺️ Battlefield Zones
🟢 Buy Zone #1 – 3310 to 3320
The sniper’s discount pullback: Fibo 38.2%, M30 OB, EMA 50, and clean imbalance.
Wait for news spike + bullish confirmation to go long.
🟢 Buy Zone #2 – 3285 to 3295
The deep reaction zone.
Fibo 61.8% + OB + gap. Enter only on violent wick and rejection — but RR is exceptional.
🟡 Flip Zone – 3334 to 3340
This is where momentum flips:
• Hold above = continuation toward premium
• Break below = bearish reversal unlocked
No entries here — this is your compass, not your trigger.
🔴 Sell Zone #1 – 3357 to 3366
Classic CHoCH retest. H1/H4 OB with layered liquidity.
If price rejects here on post-news spike — short it back toward the flip.
🔴 Sell Zone #2 – 3387 to 3395
Top-of-range sweep.
If gold blows through zone 1, this becomes liquidity trap central.
Wait for rejection wick + bearish PA confirmation.
🔴 Sell Zone #3 – 3410 to 3420
The final premium kill zone.
This is where the market finishes stop-hunting every breakout buyer.
Fibo extension 1.272–1.618 hits here. If we wick this zone and stall — sniper short back to 3380–3366.
⚔️ Execution Blueprint
Wait for news to trigger the chaos — early entries are a donation.
Short 3357–3366 on exhaustion → target flip zone.
If price overextends into 3387–3395, get ready for the reversal play.
Extreme spike to 3410–3420? That’s your killshot short — ride it back down.
If price retraces into 3310–3320, it’s your safe sniper long.
Panic into 3285–3295? Deep long entry, only with confirmation.
Watch the flip zone (3334–3340) — above = bullish bias holds; below = bears back in control.
🎯 No guesswork. No hope. Just precision. Wait, confirm, and strike.
💬 Let’s stay sharp tomorrow — market will offer clean setups, but patience and clarity are key.
If this plan helped, drop a comment or share your thoughts below.
👉 Follow GoldFxMinds for daily sniper-entry plans crafted with precision.
Smash that🚀🚀🚀 if this plan sharpened your edge.
📝 You already know — we don’t guess, we execute. 🦅
Good night, snipers 💛
⚠️ Disclosure
I’m part of TradeNation’s Influencer Program and use their TradingView charts for analysis & educational content.
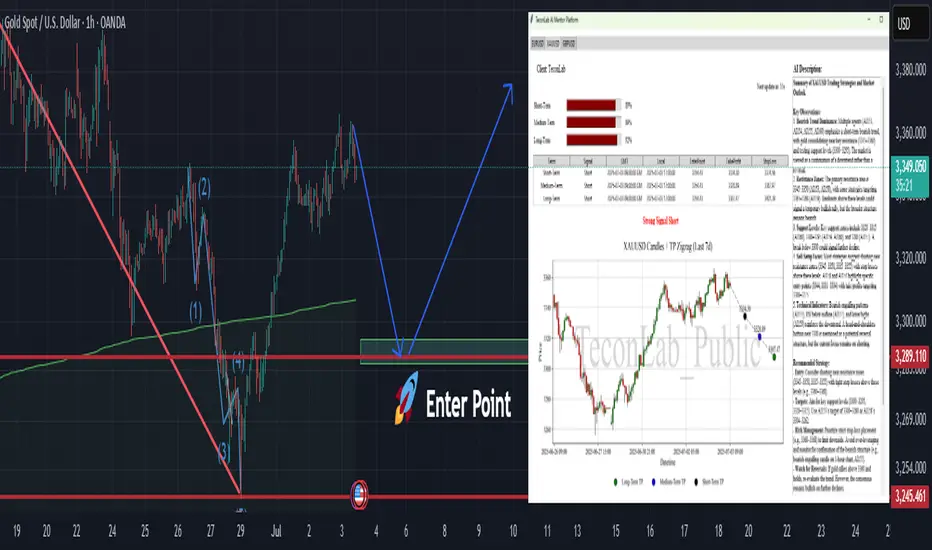
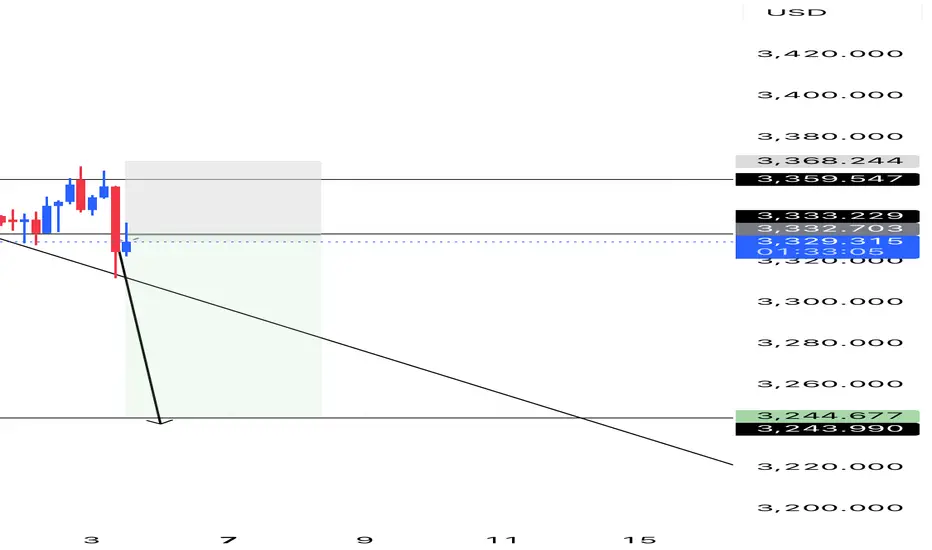
First Drop to 3307–3289, Then Buy for the Next UptrendOur system has identified a strong short signal across short-term, medium-term, and long-term timeframes as of July 3, 2025, with confidence levels above 89%. All durations are aligned, indicating a synchronized momentum shift.
Entry Point : 3354.43
Short-Term TP : 3334.30
Medium-Term TP : 3320.89
Long-Term TP : 3307.47~ 3289
📉 Based on the current market structure and signal convergence, TeconLab expects XAUUSD to drop into the 3307–3289 range, where a potential reversal zone is likely to form.
🛡️ Safest Entry for Buy: The 3289 level is considered the most favorable area for entering long positions after the expected correction completes.
📈 After reaching this zone, our system anticipates a new uptrend to begin, offering a fresh opportunity for upside movement.
The TP Zigzag path displayed on the chart outlines the projected decline with target steps, preparing for a potential bullish reversal afterward.
GOLD Short From Resistance! Sell!
Hello,Traders!
GOLD made a bullish
Rebound from the support
Below just as we predicted in
Our previous analysis but
Gold is still trading in the
Downtrend as the lower lows
And higher highs are intact
And the structure is healthy
So after the price retested the
Horizontal resistance above
Around 3,310$ we are
Likely to see a further
Bearish move down
Sell!
Comment and subscribe to help us grow!
Check out other forecasts below too!
Disclosure: I am part of Trade Nation's Influencer program and receive a monthly fee for using their TradingView charts in my analysis.
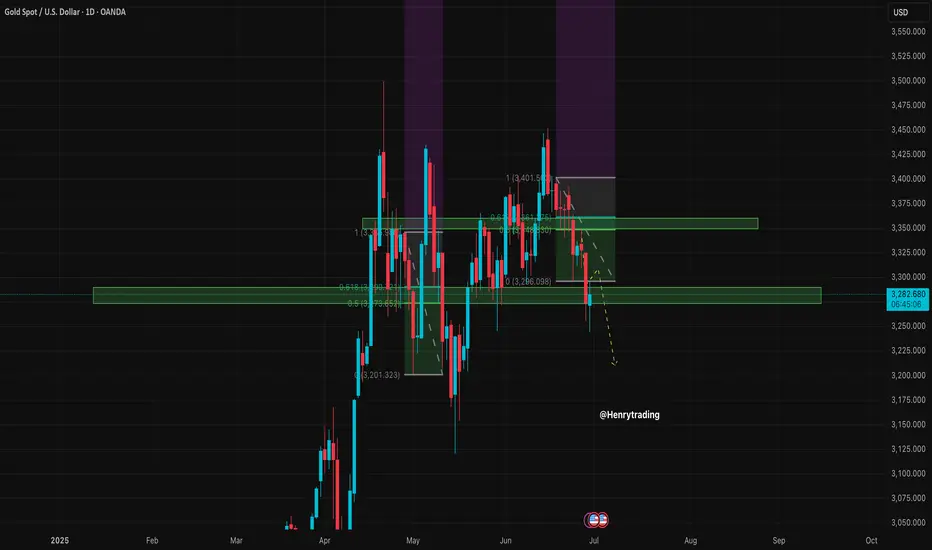
XAUUSD Analysis – July 2–3, 2025: Resistance Holds Gold is currently trading around 3,337 USD, having tested the 3,350 USD resistance zone without a successful breakout. The price remains under pressure from key macroeconomic factors:
- The Dollar Index (DXY) is stable above 106 – a sign of continued demand for the greenback, which weakens gold.
- U.S. 10-year Treasury yields hold around 4.35%, reinforcing the view that the Fed will keep interest rates high.
- The Core PCE report for June remains above the Fed’s 2% inflation target, decreasing expectations of a rate cut in Q3.
- Safe-haven demand is weak, as geopolitical tension in the Middle East and Eastern Europe remains subdued.
➡ Overall, these factors confirm that XAUUSD remains under bearish pressure in both the short and medium term, especially while key resistance remains intact.
1. Technical Analysis – XAUUSD on D1 Chart
- Price recently tested the 3,340 – 3,350 USD resistance zone, a confluence of:
Previous supply zone
- Fibonacci retracement 0.5–0.618 from 3,399 USD
- Key Change of Character (CHoCH) level
- RSI is forming a mild bearish divergence, signaling weakening bullish momentum.
- EMA20 and EMA50 are both sloping downward – confirming the prevailing bearish trend.
This setup is typical of a Sell on Rally pattern, with each retracement being rejected at strong resistance.
2. Key Technical Zones to Watch
Technical Role
- 3,350 – 3,340 Major resistance (Fibo 0.5–0.618 + supply + CHoCH)
- 3,294 – 3,285 Nearest support – previously a resistance-turned-support
- 3,255 – 3,235 Short-term target zone – June low
- 3,223 – 3,205 Strong medium-term support – April low + extended Fibo
3. Suggested Trade Setup
Preferred Scenario: SELL below 3,350
Entry: 3,345 – 3,347
Stop Loss: 3,351
Take Profit 1: 3,335
Take Profit 2: 3,330
Take Profit 3: 3,320
Ps : XAUUSD is retesting a major resistance zone without macro or technical catalysts for a sustained breakout. The best approach remains to sell at resistance and take profit near support, in alignment with the ongoing bearish trend.
The strategy will be updated regularly – don’t forget to save and follow to stay ahead of market opportunities.
The analysis was provided by @Henrybillion
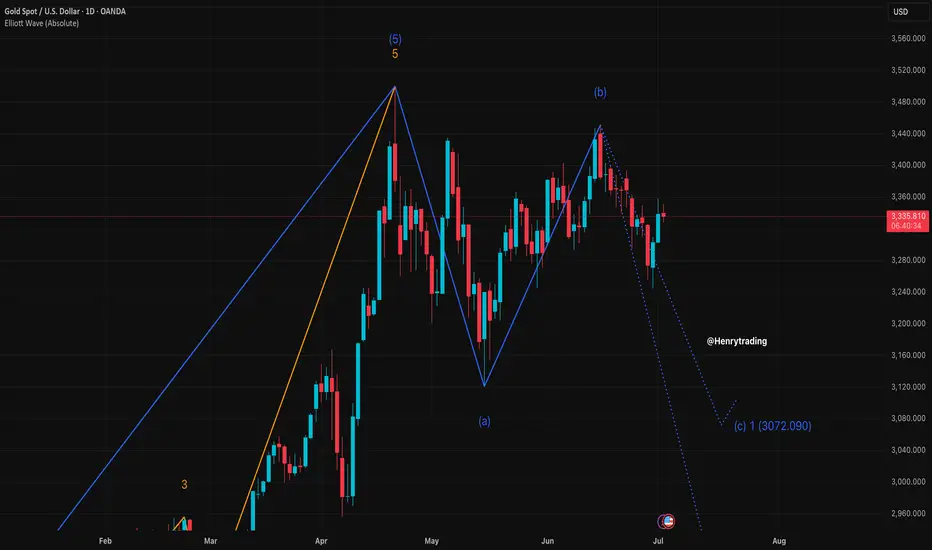
Gold will crash1. What happened yesterday
As expected, Gold started to rise after finding support at 3250. The move up played out perfectly, reaching the resistance area highlighted in yesterday’s analysis — around 3320–3340.
________________________________________
2. The key question today
Is this just a correction in a bearish trend, or the start of reversal?
________________________________________
3. Why I remain bearish
• On the weekly chart, structure still leans bearish
• On lower time frames, the bounce looks corrective — not impulsive
• No breakout above 3360 yet, which would be needed to shift the bias
• A move back below 3320 would likely trigger renewed selling
• If that happens, 3250 could be tested again quickly
We need to respect the bounce — but not overreact to it.
________________________________________
4. Trading plan
My bias remains bearish as long as price stays under 3360.
However, if we get a daily close above 3360, I’ll pause and re-evaluate the short bias. The market would then be signaling a potential trend shift.
________________________________________
5. Final thoughts 🚀
This is a key moment for gold. We’re at resistance zone but not broken above yet.
Until proven otherwise, the trend remains down — and rallies into 3340 zone should be considered selling opportunities.
Comments If you are new here, or your account is getting burned, please contact me. I will help you.
XAUUSD – June 30, 2025: Trade Strategy Right Now – Focus on SellGold OANDA:XAUUSD has been recovering slightly toward the 3,282 USD zone, but macroeconomic headwinds remain strong:
- The U.S. Dollar Index (DXY) TVC:DXY remains above 106.3 – the highest level in a month – making gold less attractive due to increased opportunity cost.
- U.S. 10-year Treasury yields remain firm around 4.35%, reflecting market expectations that the Fed will maintain tight monetary policy.
- Core PCE data for June remains elevated, far from the Fed's 2% target – lowering the likelihood of a rate cut anytime soon.
- Geopolitical tensions are cooling off, reducing demand for safe-haven assets like gold.
➡ These macro factors suggest that the current rebound in gold is more technical than fundamental, and unlikely to signal a major trend reversal.
1. Technical Analysis – XAUUSD OANDA:XAUUSD on D1 Timeframe
- After bouncing from 3,255 USD, price is now testing the 3,285 – 3,295 USD resistance zone.
- This is a Fibonacci retracement zone (0.5 – 0.618) from the previous bearish leg 3,314 → 3,255.
- EMA20 and EMA50 remain downward-sloping, signaling that the dominant trend is still bearish.
- RSI is hovering around 52, suggesting mild momentum but not enough for a confirmed bullish reversal.
➡ The current price behavior aligns with a pullback within a downtrend, with potential for continuation to the downside.
2. Trade Setup – Short-Term Sell Strategy
Primary Setup: Sell the Rally
Entry: Sell near 3,294 – 3,295
Stop Loss: 3,300
Take Profit 1: 3,260
Take Profit 2: 3,244
Take Profit 3: 3,225
Ps: Gold OANDA:XAUUSD is showing signs of a technical bounce, but fundamentals and structure still support the downtrend. Selling at resistance remains the preferred strategy as long as macro pressure persists.
The strategy will be updated continuously – don't forget to save and follow to avoid missing key opportunities.
Analysis by @Henrybillion
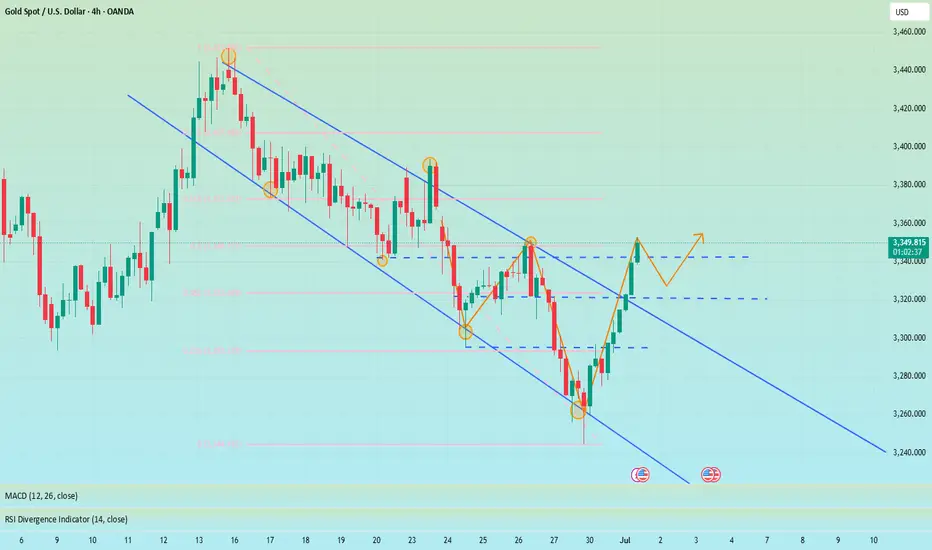
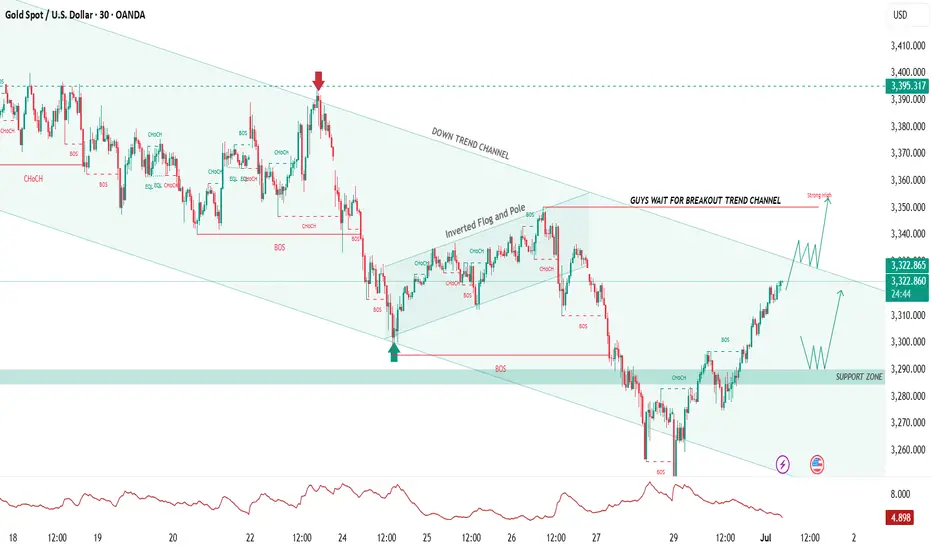
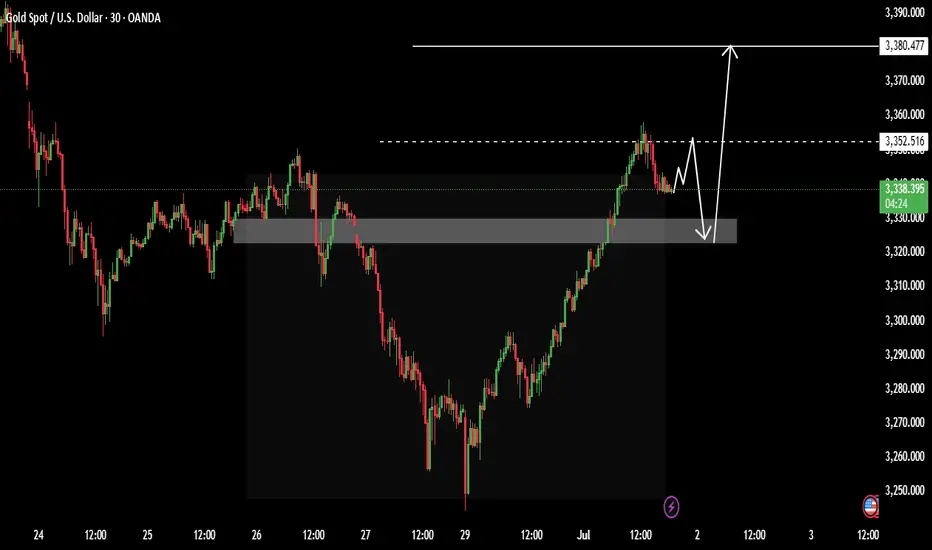
GOLD – Waiting for Breakout Above Downtrend Channel Toward 3395Gold is trading within a well-defined downtrend channel on the 30-minute chart.
Price has consistently respected the channel resistance, making lower highs and lows.
Recent bullish momentum is pushing against the upper boundary of the channel.
No confirmed breakout yet – price remains capped by the trendline resistance.
We’re seeing an inverted flag and pole formation that suggests pressure is building.
A clean break and close above the channel would confirm bullish intent.
Plan:
1.Wait patiently for a confirmed breakout before entering buys.
2.Avoid early entries while price is still inside the channel.
3.Watch for retest and hold above the broken channel as ideal confirmation.
4.Target move toward 3395 if breakout is successful.
Bias:
1.Bullish only on confirmed breakout and retest.
2.Bearish continuation possible if price fails to break the channel.
3.Discipline and patience are key – let the market confirm direction.
Like, comment, share, and follow for more trade ideas.
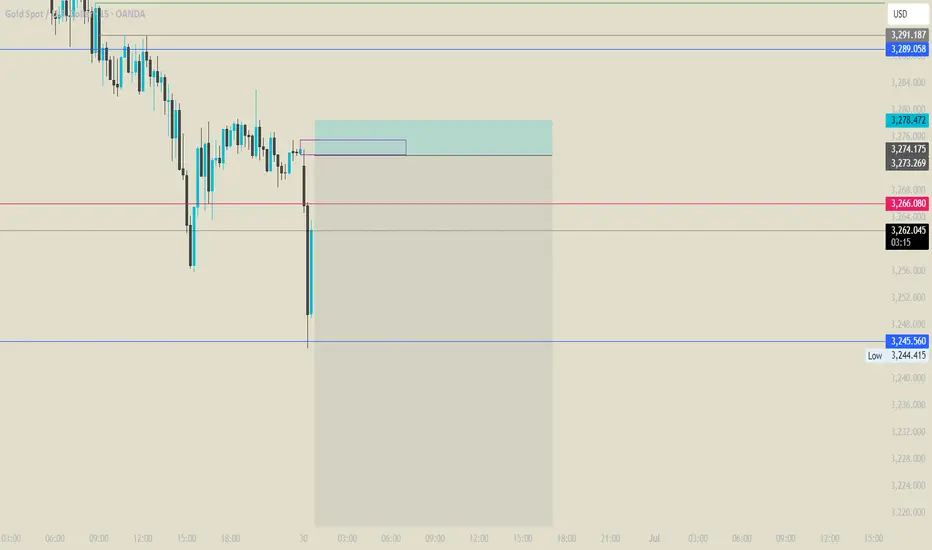
Gold short from ltf3270 is a nice area for a short.
A very nice setup with a great risk reward ratio.
Let us see what this week brings on.
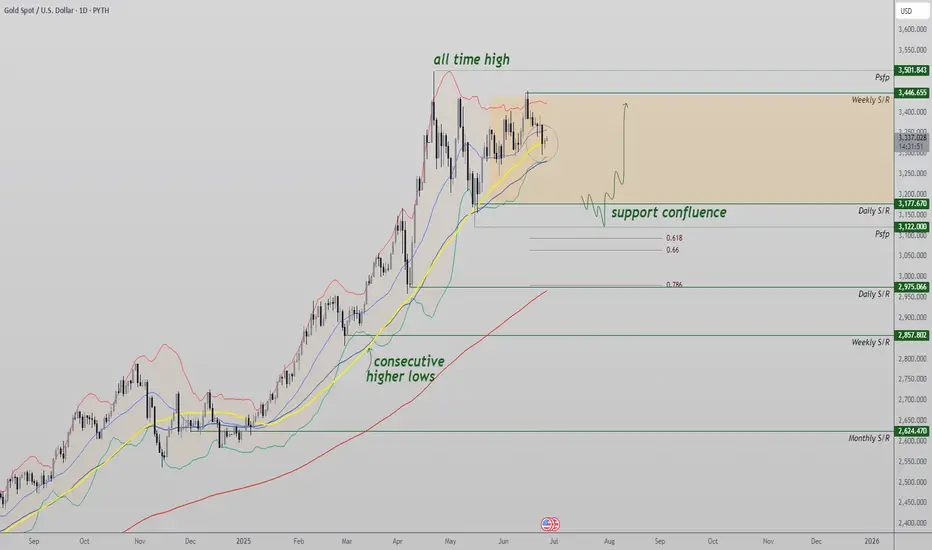
Gold Remains Bullish, But Market Needs Correction Before New ATHGold continues to trend upward with consecutive higher highs and higher lows, but a deeper correction may be necessary before the next major bullish leg can begin with conviction.
Price action on gold remains firmly in a bullish structure. The market has consistently produced strong impulses followed by shallow pullbacks, signaling aggressive buyer interest. However, from a technical trading perspective, current levels may not offer ideal long entries without a corrective move first. A deeper pullback toward support would reset momentum and offer higher probability setups for trend continuation.
Key Technical Points:
- Support Zone at $3,177: Daily support with swing low and 0.618 Fibonacci confluence
- 50 MA + 51 EMA Support: Dynamic moving averages guiding the higher low structure
- Potential Liquidity Sweep: A dip below daily support could trap bears before continuation
Gold’s current uptrend is well-defined, with a clear structure of higher highs and higher lows. Each dip has been aggressively bought, and the market has continued climbing with little resistance. However, this type of trend often leads to overextension, and traders are beginning to look for a corrective pullback to create a more sustainable setup.
The $3,177 support level is the key zone to watch. Not only does this level represent a daily horizontal support, but just below it sits a key swing low and the 0.618 Fibonacci retracement of the most recent leg higher. This area could serve as a prime candidate for a liquidity sweep—where price briefly dips to trap breakout sellers before reversing back upward.
Adding to this, the 50-day moving average and the 51-day exponential moving average are both supporting the trend and aligning with the higher low formation. These moving averages have been providing dynamic support throughout this rally, acting as a technical guide for buyers.
While there is always the possibility that gold continues higher from current levels, a pullback toward the $3,177 area would provide a healthier setup. It would allow the market to reset, rebalance, and potentially attract sidelined buyers who missed the initial move. Such a correction would preserve the higher low structure while maintaining bullish integrity.
What to Expect in the Coming Price Action:
If gold holds above the $3,177 support zone, the bullish trend may resume without deeper retracement. However, a brief dip below that level to sweep liquidity could offer the best long opportunity. Until a corrective move confirms, traders should remain cautious of chasing highs without a valid structure reset. Long bias remains intact as long as the higher low structure holds.
Gold continues to look strong amid ongoing correctionsGold continues to look strong amid ongoing corrections in U.S. interest rate expectations. The falling U.S. dollar is also supporting gold prices, as the greenback remains under pressure due to political uncertainty, budget concerns, and rising trade risks.
From a technical perspective, gold is showing signs of consolidation after a strong bullish run. The price is expected to test support near $2,330 (assuming "3330" was a typo), which could serve as a key level before any further upward momentum resumes.
If support at 3330 holds, gold may resume its uptrend, especially if macroeconomic headwinds for the dollar persist.
You may find more details in the chart Ps Support with like and comments for more analysis.
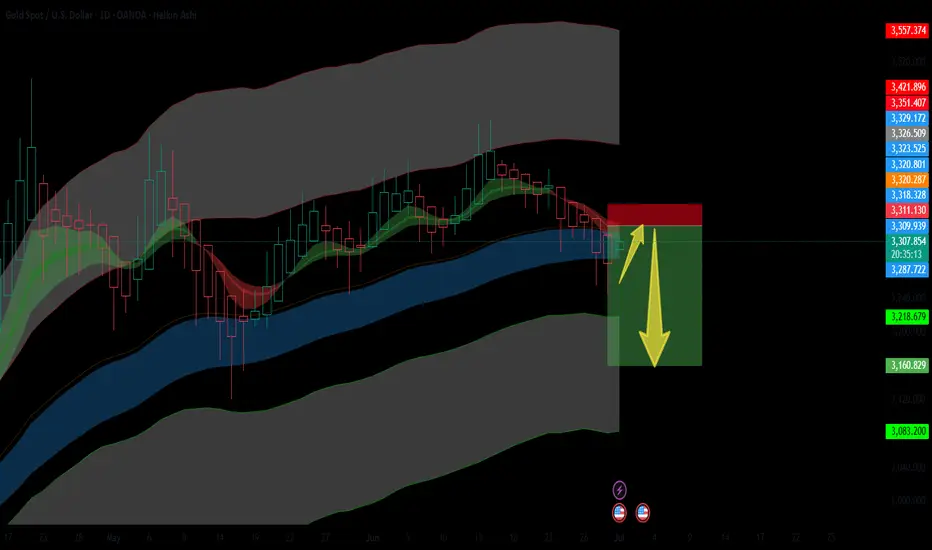
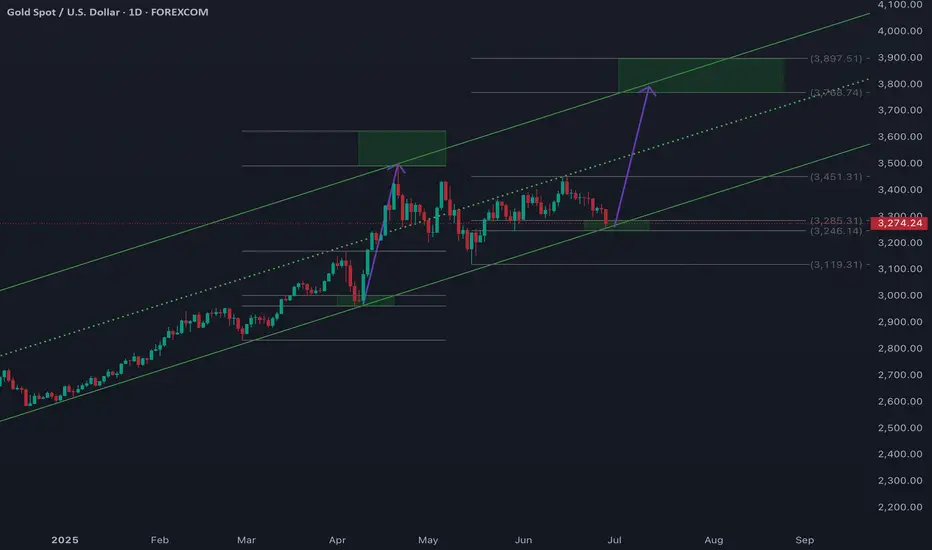
XAUUSD/ 1D LONGCombining the channel pattern analysis and Sk System, will we see such a move in GOLD? Will the history repeat itself?
Good Luck
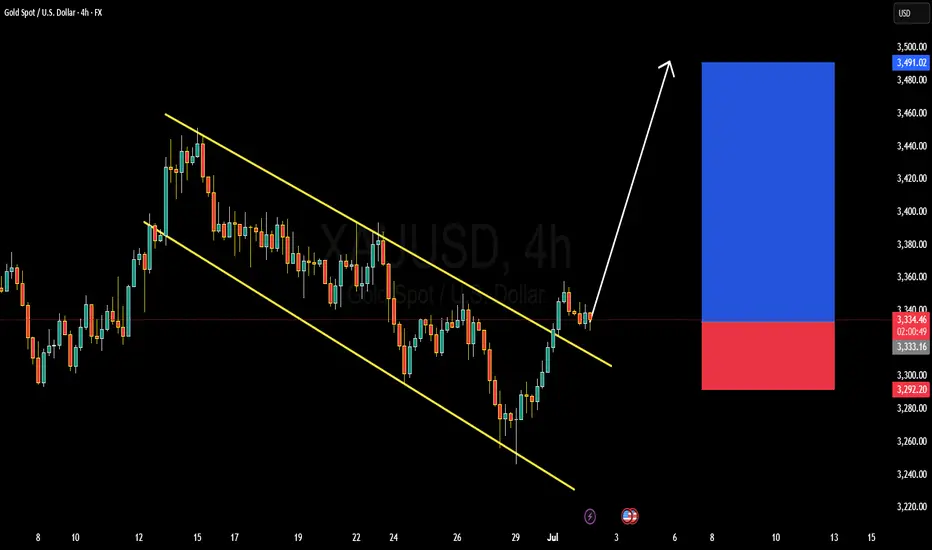
XAUUSD BULLISH OR BEARISH DETAILED ANALYSISXAUUSD has officially broken out of a well-structured descending channel on the 4H timeframe, suggesting a potential shift in market sentiment from bearish to bullish. After multiple rejections from the lower boundary and consistent pressure on the upper trendline, the breakout above the channel confirms a strong upside bias. Price is currently holding near 3330, and I’m now eyeing 3450 as the next key resistance level. This setup aligns perfectly with a textbook channel breakout, offering a solid risk-to-reward scenario for bullish continuation.
The breakout comes at a time when macro fundamentals are supportive of gold strength. With rising uncertainty surrounding global inflation trends and mixed economic signals from the US, investors are leaning back into gold as a defensive hedge. The US dollar has shown signs of softening amid increasing speculation that the Fed could pivot to a more neutral stance in the coming months. This gives gold more breathing room to the upside, especially as real yields begin to flatten out.
Geopolitical tensions, especially renewed volatility around global trade and Middle East developments, are further fueling demand for safe-haven assets like XAUUSD. The recent breakout is backed by rising volume and momentum indicators turning bullish, making this move more sustainable than a short-term spike. Gold typically thrives during periods of uncertainty and shifting rate expectations, and that’s exactly the phase we are entering now.
From a technical and macroeconomic perspective, gold is showing strength just as the broader markets begin to wobble. This breakout isn’t just about structure—it’s supported by real macro catalysts and seasonal demand strength. I'm bullish toward the 3450 zone, and any retest of the broken channel resistance now turned support would offer an attractive entry. Staying focused on gold as a top performer in Q3 could offer strong upside with controlled risk.
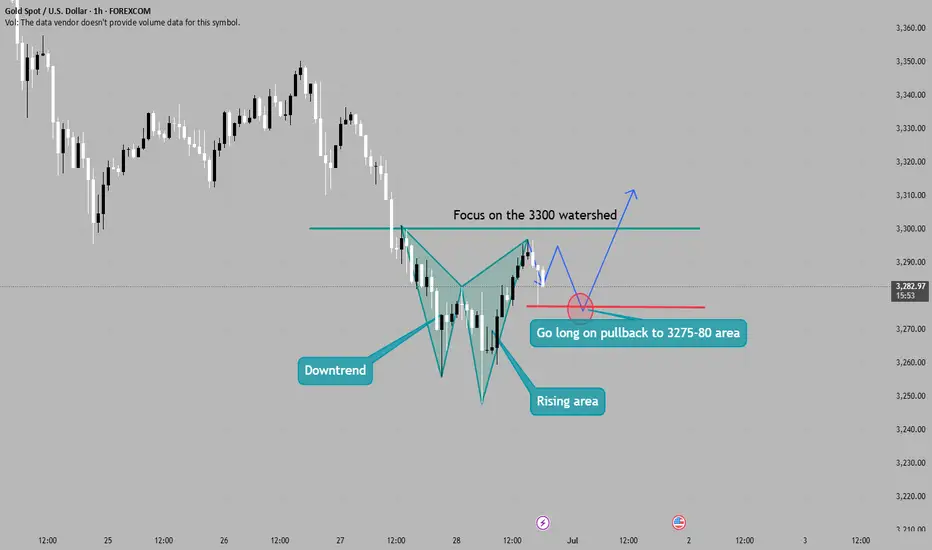
Non-agricultural week gold long and short game!From the 4-hour trend of gold, the key position of 3300 is the core basis for judging the short-term trend. The current 4-hour watershed is in the 3300 area. The gains and losses of this position will determine the direction of the short-term trend. Before it breaks through effectively, the short-term pressure judgment is maintained; if it breaks through, it is necessary to turn to the daily resistance level. The MACD indicator crosses and the short-term momentum column continues to increase, indicating that the price has further downward momentum. The price of the 4-hour cycle runs along the downward channel. Although the MACD indicator forms a cross below the zero axis, the short-term energy column shows a shrinking trend. There is a technical oversold rebound demand in the short term.
XAUUSD 4H SHORTPrice broke out of the bearish trend line and moved sideways in a range forming two tops or a double top.
Fundamentally, US jobs data came out positive keying into hawkish tone on interest rate and influenced CPI.
Price broke the neckline after 4H closure giving signal for bearish move to $3250 support.
Here’s my little idea on GOLD. Follow for more.
Tariff tensions heat up againGold, the price rebounded quickly after the parallel attack and defense at 3245 at the beginning of the week. The article emphasizes that the short-term strength will continue. The high point of the week may appear around Thursday's non-agricultural data. The medium-term top idea of 3500-3452 is still maintained; on Tuesday, it actually hit 3358, and the daily K-line combination showed a long arrangement. In the morning, it was emphasized that it was still possible to follow the trend and wait for the non-agricultural data to break through on Thursday night;
The actual retracement rebounded from 3327 and is now reported at 3343, which is in line with expectations; the short-term support in the evening is 3340-3336, and the strong support is 3330; the short-term resistance is 3348, and the strong resistance is 3352-3358. If it breaks, it will look at 3365-3400;