Weekly Outlook | XAUUSD June 30 – July 4, 2025Welcome to a new trading week. Let’s break down the gold chart from a clean, high-timeframe perspective. No setups, no noise – just structure, momentum, and zones that matter.
🌐 Macro Overview
This week concentrates all key USD events into one tight window:
Tuesday: ISM Manufacturing + Fed Chair Powell speech
Wednesday: ADP Employment
Thursday: NFP, Unemployment Rate, ISM Services PMI
Friday: US holiday – markets closed
📌 This means liquidity and momentum will peak by Thursday, then fade into the weekend.
Expect gold to stay in range until macro data breaks direction.
🧠 Weekly Structure & Momentum
Gold remains in a bullish macro structure, but price is hesitating below 3300.
Last two weekly candles printed long upper wicks with no body follow-through – clear sign of distribution, not continuation.
We’re still trading above the 21EMA Weekly, which maintains the uptrend’s integrity.
RSI (14): sitting at ~59 → no real momentum breakout, just consolidation.
📌 The chart is not reversing, but it’s also not trending anymore. We’re in a decision zone.
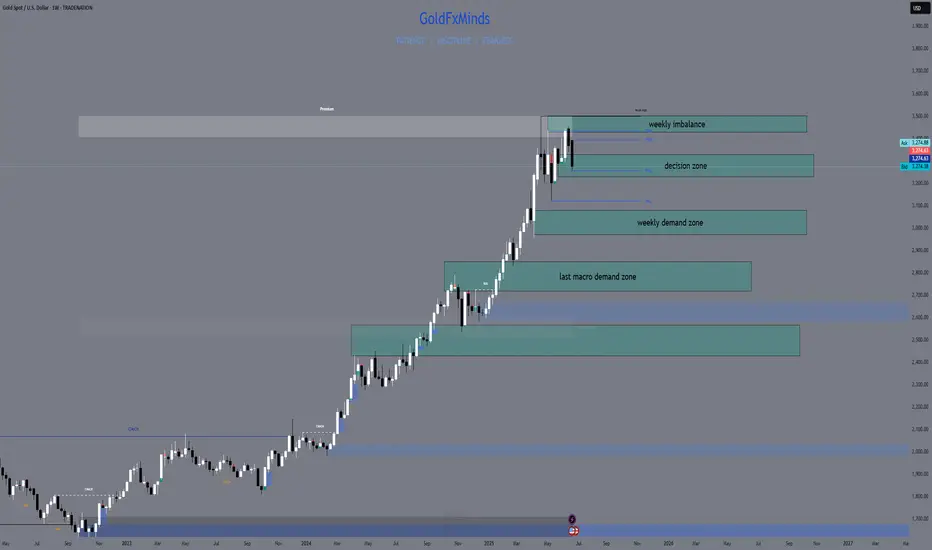
📍 Key Weekly Areas of Interest
3430 – 3500 → W1 Imbalance + March High Sweep
This is a wide weekly imbalance left unfilled since March, paired with the prior 2024 swing high. 3500 is also a psychological round number. If price pushes into this area, it becomes a liquidity target, not an entry – unless a clear rejection forms.
3330 – 3230 → Weekly Decision Block
This is the current consolidation range. It includes multiple W1 candle bodies, wick highs/lows, and volume cluster.
– Weekly close above 3330 = likely bullish continuation toward 3430+
– Weekly close below 3230 = confirms weakness and opens path to the next major support
3080 – 2970 → Weekly Demand + Fib 38%
Clean block of accumulation from April–May, aligned with the 38.2% retracement of the 2024 rally. This is where we’d expect institutional buying interest on a deeper pullback.
A weekly candle with a long wick into this zone + strong close would reset bullish structure.
2850 – 2720 → Last Macro Demand Zone
This zone includes the 50EMA weekly, a weekly FVG from late 2023, and unmitigated demand before the full 2024 breakout. If price ever gets here, we’re no longer in a healthy uptrend – we’re correcting structurally. But this zone will matter if that happens.
🧭 Summary & Expectations
Gold is still inside a large weekly range.
Until we break above 3330 or below 3230, it’s just consolidation on the HTF.
Thursday’s data will decide the candle.
Don’t predict direction — let the W1 close speak.
📌 Final Notes:
Above 3330 = room toward 3430–3500
Below 3230 = risk opens toward 3080–2970
Inside = no directional edge — stay reactive, not biased
🔥 If you enjoy this clean breakdown: hit that 🚀, follow & drop your thoughts below!
Stay sharp traders — we execute with precision.
— GoldFxMinds
XAUUSD.F trade ideas
Tariff tensions heat up againGold, the price rebounded quickly after the parallel attack and defense at 3245 at the beginning of the week. The article emphasizes that the short-term strength will continue. The high point of the week may appear around Thursday's non-agricultural data. The medium-term top idea of 3500-3452 is still maintained; on Tuesday, it actually hit 3358, and the daily K-line combination showed a long arrangement. In the morning, it was emphasized that it was still possible to follow the trend and wait for the non-agricultural data to break through on Thursday night;
The actual retracement rebounded from 3327 and is now reported at 3343, which is in line with expectations; the short-term support in the evening is 3340-3336, and the strong support is 3330; the short-term resistance is 3348, and the strong resistance is 3352-3358. If it breaks, it will look at 3365-3400;
GOLD - Price can continues rise to resistance level and break itHi guys, this is my overview for XAUUSD, feel free to check it and write your feedback in comments👊
Price made an upward impulse from the support line of the triangle and rose to the resistance line, breaking two levels.
Then the price dropped back, after which repeated impulse and exited from the triangle, reaching the resistance area.
After this movement, Gold started to trades inside a wedge, where it dropped from the resistance line to the support line.
Next, the price in a short time rose from this line to the resistance line again, breaking $3230 and $3400 levels.
But recently, it made a correction to the support line, breaking $3400 level again, and then started to grow.
Now, I expect that Gold can little decline and then continue to move up to $3470, breaking the resistance level.
If this post is useful to you, you can support me with like/boost and advice in comments❤️
Disclaimer: As part of ThinkMarkets’ Influencer Program, I am sponsored to share and publish their charts in my analysis.
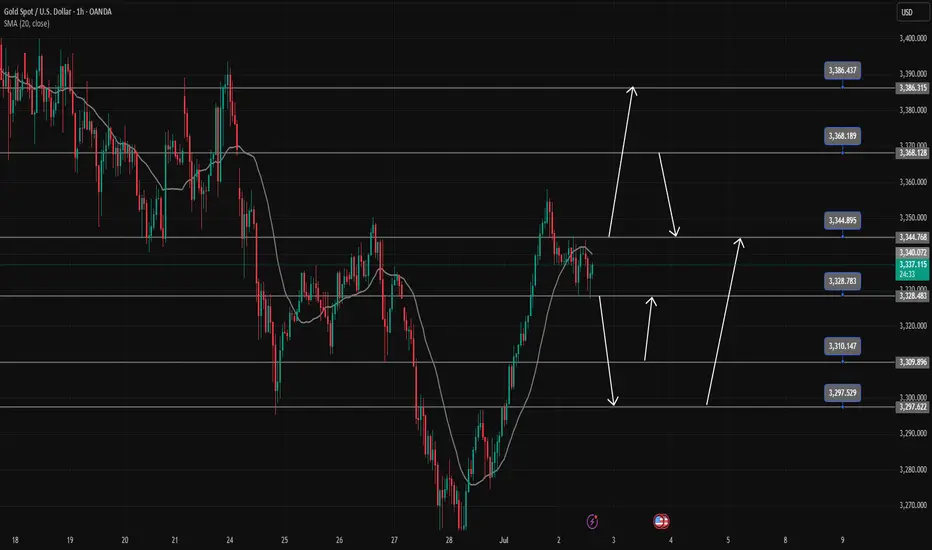
Gold Trading Strategy February 7✏️As expected from the analysis, after the D1 candle showed buying pressure again, the price continued its uptrend yesterday and reached 3357.
Currently, the price is consolidating within a relatively wide sideways range, extending from 3328 to 3344.
A trend-following trading strategy will be set up when the price breaks out of this range.
The BUY signal is expected to bring good profits if the price retests the support.
The SELL signal at resistance is considered to look for rebound points in an uptrend.
📈 Key Levels
Breakout Range: 3344-3328
Support: 3310-3298
Resistance: 3368-3386
📊 Recommended Trade Setups
BUY: 3310-3308 | SL: 3305
SELL: 3368-3370 | SL: 3373
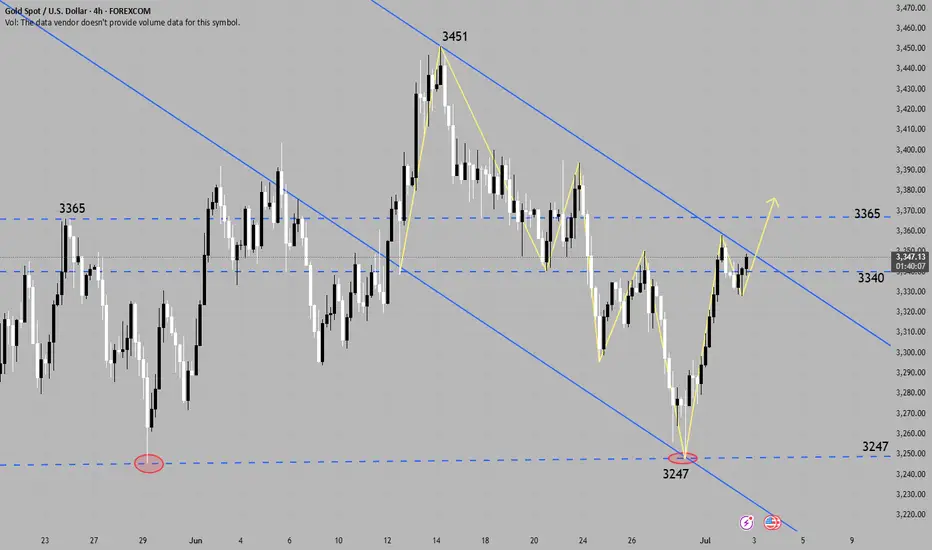
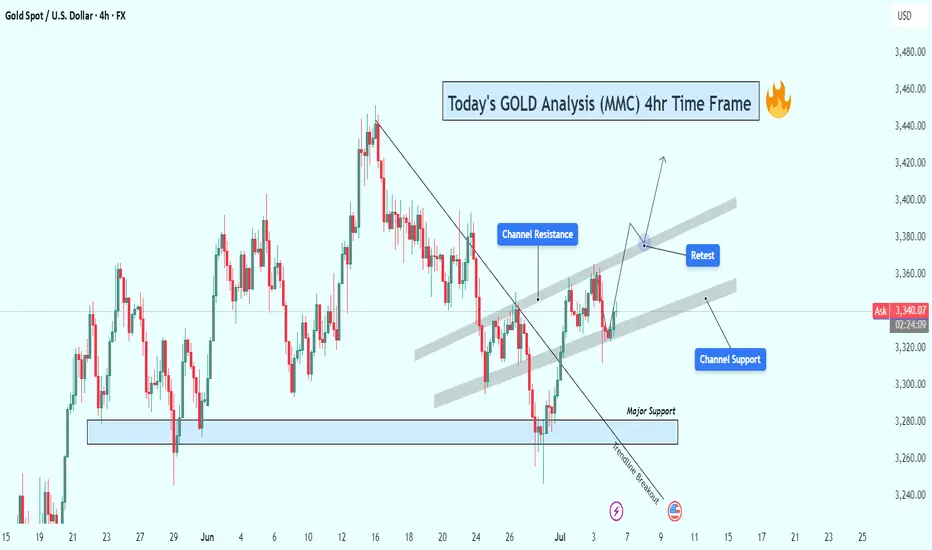
GOLD (XAUUSD) 4H Technical Analysis – Channel Breakout & Target🧠 Executive Summary:
The GOLD market has completed a key structural shift following a successful bearish trendline breakout, and is now trading within a well-formed ascending price channel. Price action has recently bounced from the channel support area, which aligns closely with a retested zone that was previously resistance. All signs now point to a potential continuation of the bullish leg—but only if the current structure holds.
This analysis outlines the technical foundation, key trading zones, price action psychology, and risk management factors that define this setup.
🔍 Technical Breakdown
🔸 1. Trendline Breakout – The Structural Shift
The bearish trendline, which previously capped multiple upside moves throughout June, has finally been broken.
The breakout was accompanied by higher volume and larger bullish candles, indicating momentum.
After the breakout, price pulled back near the trendline and respected the newly flipped support zone.
This forms a classic Breakout–Retest–Continuation pattern, one of the most reliable in trend reversal scenarios.
🔸 2. Formation of Ascending Channel – A New Bullish Structure
After the breakout, price action established a consistent pattern of higher highs and higher lows, confirming the birth of a new ascending channel.
The channel support (around 3,320–3,330) has been tested multiple times and held strong.
The channel resistance lies between 3,390–3,400, which is now the next short-term target if bulls maintain control.
The channel offers both trend direction and entry timing opportunities as price bounces between its boundaries.
🔸 3. Retest Zone – Buyer’s Territory
The price is currently bouncing off the mid-channel zone, where the previous downtrend resistance overlaps with current channel support.
This confluence area is where smart money often enters after institutional accumulation at the base (around 3,270).
The bullish wick rejections around this zone signal a likely continuation toward the upper channel.
📈 Price Behavior & Market Psychology
What’s happening here isn't just lines and candles—there’s a psychological story unfolding:
Fear drove the market lower, respecting the bearish trendline until late June.
Hope and buyer aggression surged once the breakout confirmed.
Now we’re in the "belief" phase, where traders await confirmation of the new trend.
Many are watching for entry confirmation at support zones, and as long as fear doesn’t return (i.e., price breaking below 3,320), the structure remains valid.
🧭 Key Technical Levels to Watch
Level Type Price Range Notes
Major Support Zone 3,270–3,285 Key buyer zone, invalidation of bullish case below this
Channel Support 3,320–3,330 Retest zone after breakout, current active level
Mid-Channel Area 3,350–3,360 Decision zone – price may build momentum here
Channel Resistance 3,390–3,400 First bullish target, potential breakout area
Breakout Target 3,420–3,440 If price breaks channel resistance with volume
🧮 Trade Setup Ideas (Educational – Not Financial Advice)
🟢 Long Setup Option 1:
Entry: Upon confirmation above 3,340–3,345 with bullish engulfing candle or breakout bar.
Stop-Loss: Below 3,320 or slightly below channel support.
Take Profit: Partial at 3,390 (channel top), full at 3,420–3,440 breakout zone.
R:R Ratio: 1:2.5+ (highly favorable)
🔴 Bearish Scenario (Risk Management)
If price closes below 3,320 with momentum, expect a revisit to the 3,270–3,285 support.
This invalidates the current bullish channel structure and might bring in short-term bearish pressure.
Avoid long positions until new structure is formed.
🧠 Educational Takeaway for Traders
This analysis highlights the importance of:
Structure-based entries: Instead of chasing candles, you wait for confluence and entry triggers.
Multiple timeframe confirmation: Higher timeframes also show bullish bias, giving confidence to 4H trades.
Risk management: The current setup allows tight stop losses relative to potential reward, making it attractive.
By combining trendline breakouts, channel formations, and support/resistance flips, you significantly increase the probability of a successful trade.
📌 Final Thoughts:
Gold is giving traders a clean and structured opportunity. The market has shown strength through structure, not just random price spikes. With the ascending channel intact and price respecting support zones, there is a solid foundation for a bullish continuation toward 3,400 and beyond.
But as always, confirmation is key. Wait for price action to validate your bias, and never ignore risk management.
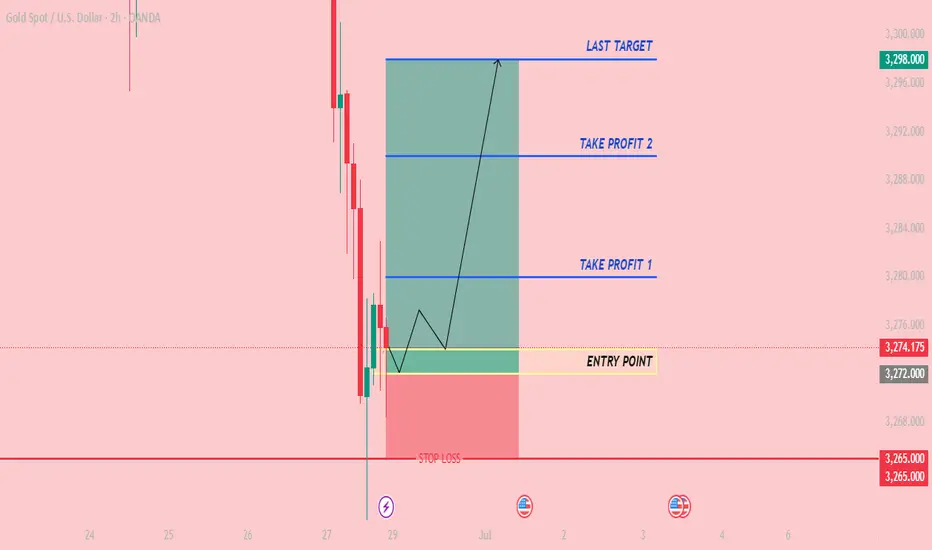
CGHECK XAUUSD SIGNAL READ CAPTAIN( XAUUSD ) BUY zone
( TRADE SATUP)
ENTRY POINT (3272) to (3274) 📊
FIRST TP (3280)📊
2ND TARGET (3290) 📊
LAST TARGET (3298) 📊
STOP LOOS (3265)❌
Tachincal analysis satup
Fallow risk management
gold shortHTF strong selling pressure.
15min supply zone.
If this area can hold, then short till the very bottom
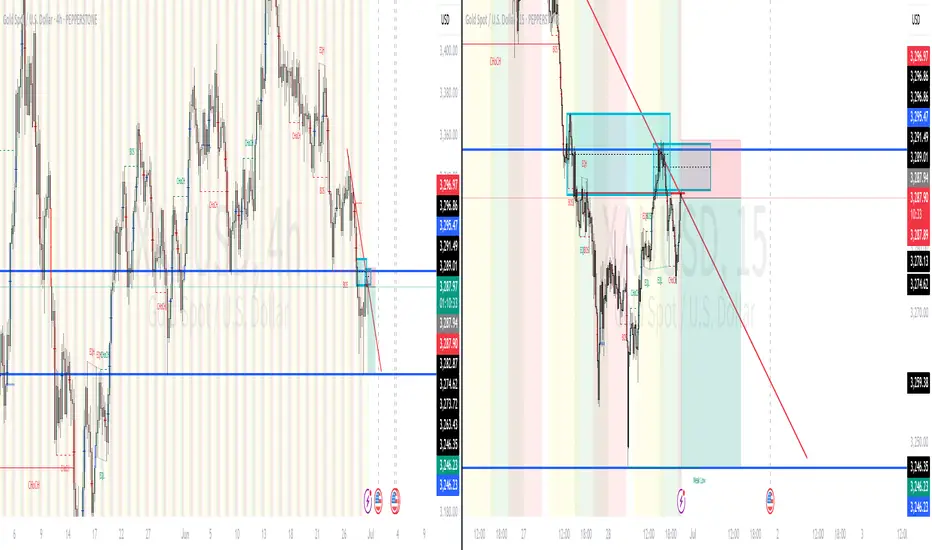
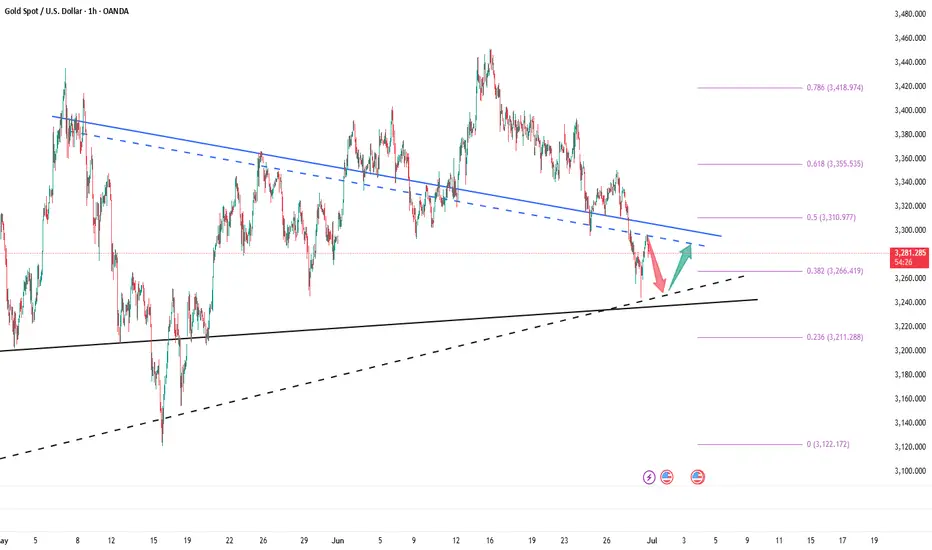
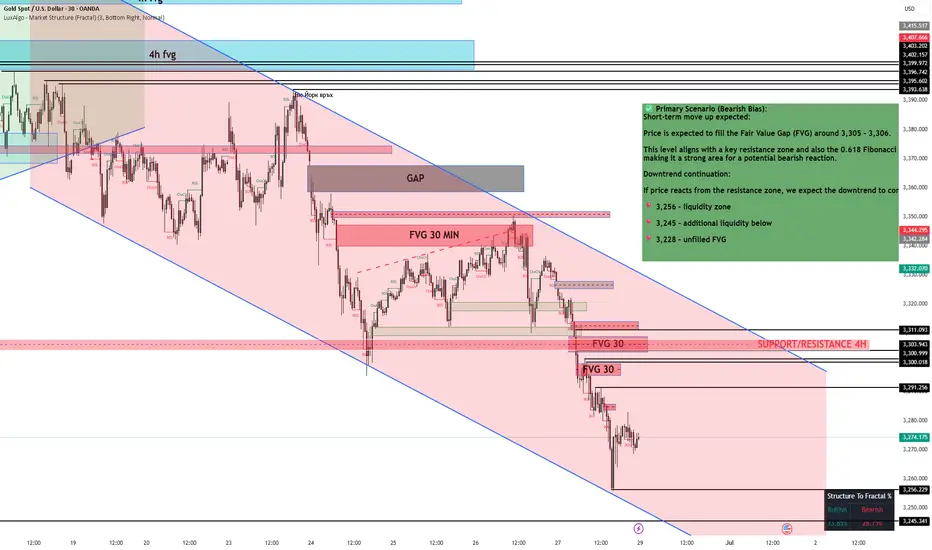
XAU/USD Analysis – June 30, 2025✅ Primary Scenario (Bearish Bias):
Short-term move up expected:
Price is expected to fill the Fair Value Gap (FVG) around 3,305 – 3,306.
This level aligns with a key resistance zone and also the 0.618 Fibonacci retracement, making it a strong area for a potential bearish reaction.
Downtrend continuation:
If price reacts from the resistance zone, we expect the downtrend to continue, targeting:
📍 3,256 – liquidity zone
📍 3,245 – additional liquidity below
📍 3,228 – unfilled FVG
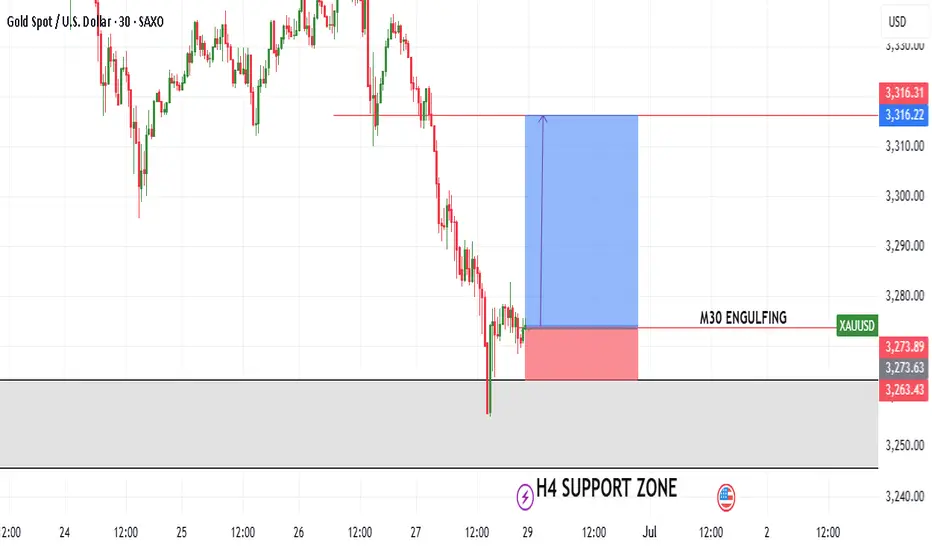
GOLD ANALYSIS FOR MONDAY MARKET OPEN, 30TH JUNE, 2025Gold looks bearish heading into the new week. We had the formation of a weekly engulfing candle last week. I expect a pullback buy at market open from the current level to a take-profit level of 3316.
After that, I expect a sell-off from the 3318 level down to the 3000 level for the rest of the week.
I will be posting daily updates here, cheers!
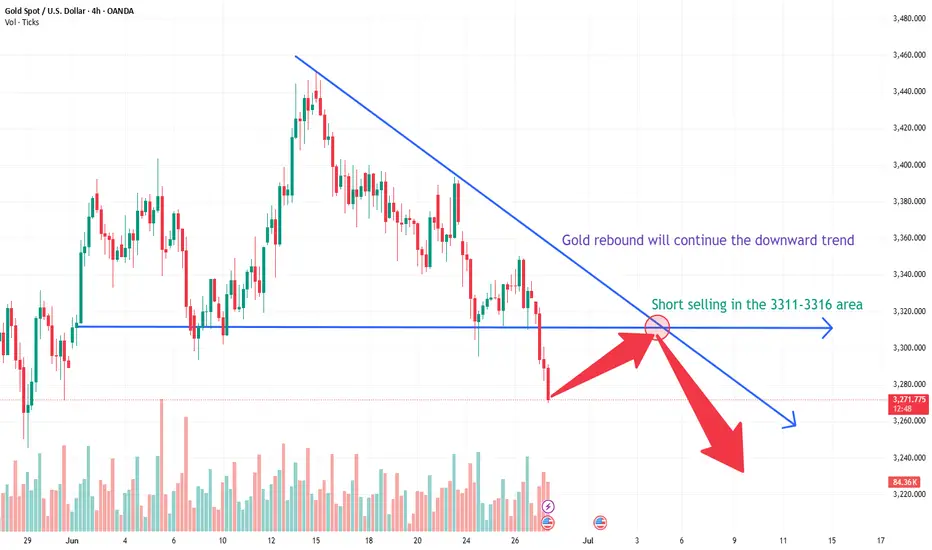
PCE data week gold under pressure! Rebound high altitude strategFrom the analysis of the 4-hour trend of gold, the price of gold continued to decline after opening today. In view of the particularity of the closing stage of the weekly line, it is recommended that you avoid blindly chasing shorts and should adhere to the idea of swinging short trading. The technical level shows that the Bollinger Bands in the 4-hour cycle show a clear closing trend, and the price is constrained by the operation below the middle track, and the short-term weak pattern is established. In terms of operation strategy, it is recommended to adopt a rebound short-selling-dominated strategy, focusing on the key pressure range of 3311-3316. It is necessary to arrange short orders in batches according to the strength of the rebound, and the lower target is to look at the support area of 3265-3260. Based on the comprehensive technical indicators, gold currently maintains a short trend, and it is recommended to use a rebound short-selling strategy as the main operation.
Operation strategy:
Gold is recommended to rebound in the 3311-3316 area to short, stop loss at 3324, target 3300-3280
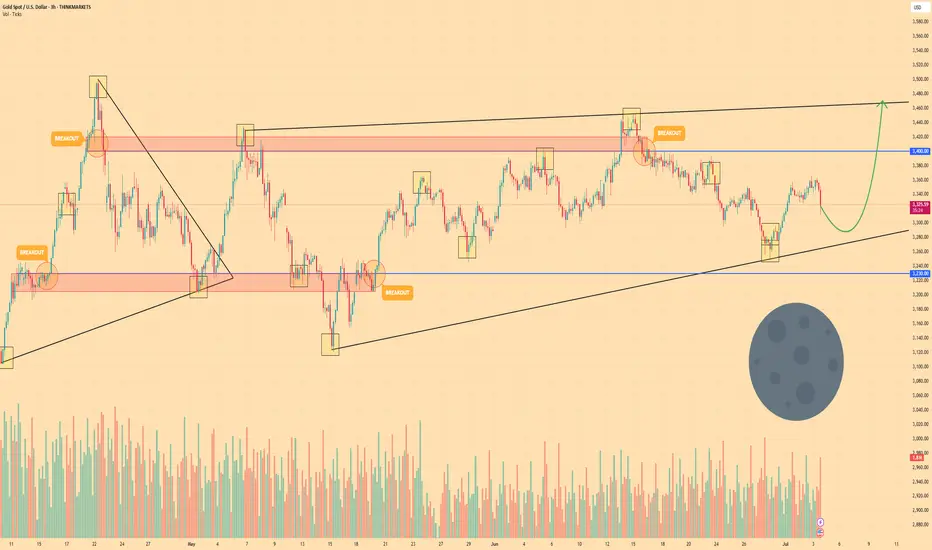
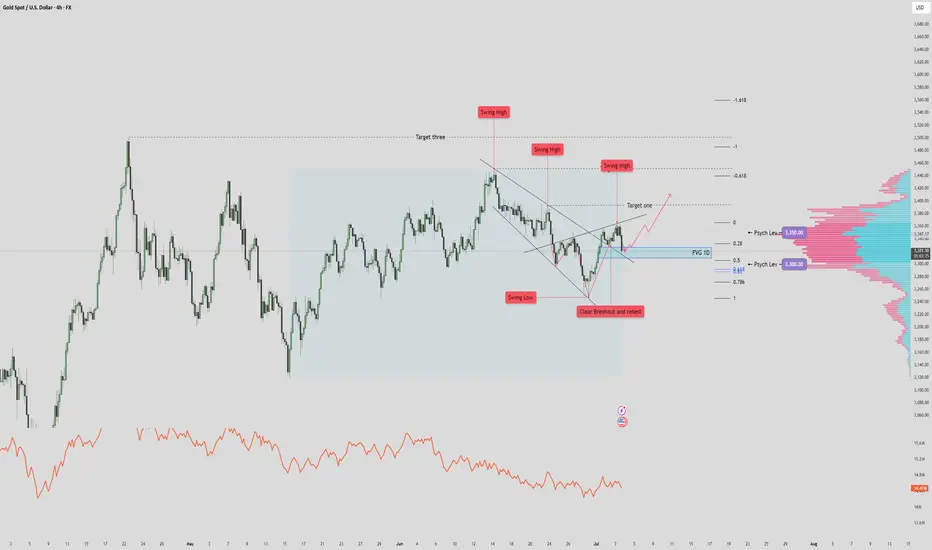
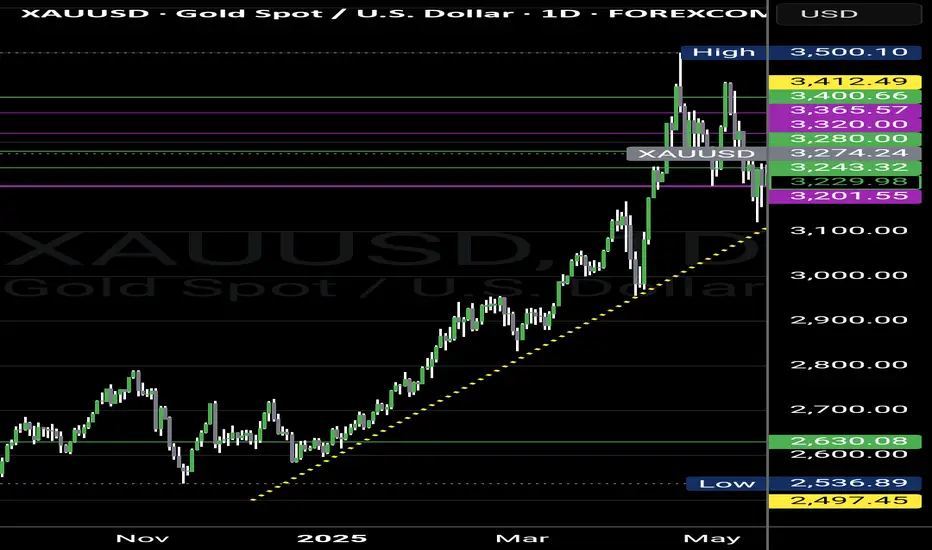
XAUUSD $3500 Recovery? Reverse Heads and Shoulders? 🔎 STRUCTURE & TECHNICAL ELEMENTS
1. Pattern:
A falling wedge was formed and broken cleanly to the upside → bullish reversal structure.
Breakout was followed by a successful retest at prior structure lows (marked “Clear Breakout and Retest”).
2. Fair Value Gap (FVG 1D) Zone:
Currently being tested. This zone coincides with:
Minor support from prior consolidation
Fib retracement (0.5 level)
Potential demand area (watch for bullish reaction/candle structure here)
3. Volume Profile:
3,350 = POC (Point of Control) → heavy resistance.
3,300 = Secondary HVN → strong support below current price.
Low-volume nodes just under current price → if broken, price likely accelerates into the GP zone.
4. Fibonacci & Liquidity Confluence:
Golden Pocket (3287) just below 3,300 = ideal liquidity draw if FVG fails.
Target 1 / 2 / 3 above are Fibonacci-based projections + historical swing zones.
✅ SCENARIO 1: Bullish Case – FVG Holds
If price respects the FVG 1D zone, expect:
Continuation up toward Target One (~3,430)
Extension to Target Two (~3,470) and even Target Three (~3,540+) possible
Confirmation: Bullish engulfing / high-volume bounce / sweep of intraday lows without close below FVG
Bias: Bullish continuation as long as price holds above FVG/0.5 Fib
🚨 SCENARIO 2: Bearish Case – FVG Breaks Down
If price closes below FVG zone, particularly below 3,312:
High probability drop toward 3,300 (psych level)
Liquidity sweep and deeper correction into Golden Pocket (~3,287) likely
This area can act as a high-probability long re-entry zone
Bias: Short-term bearish if close below FVG + swing structure invalidation
⚖️ REFINED SUMMARY
Price rejects off FVG - we can expect target 1 and 2 tagged.
Price breaks & closes below FVG zone - we can expect it to drop/wick to 3,300
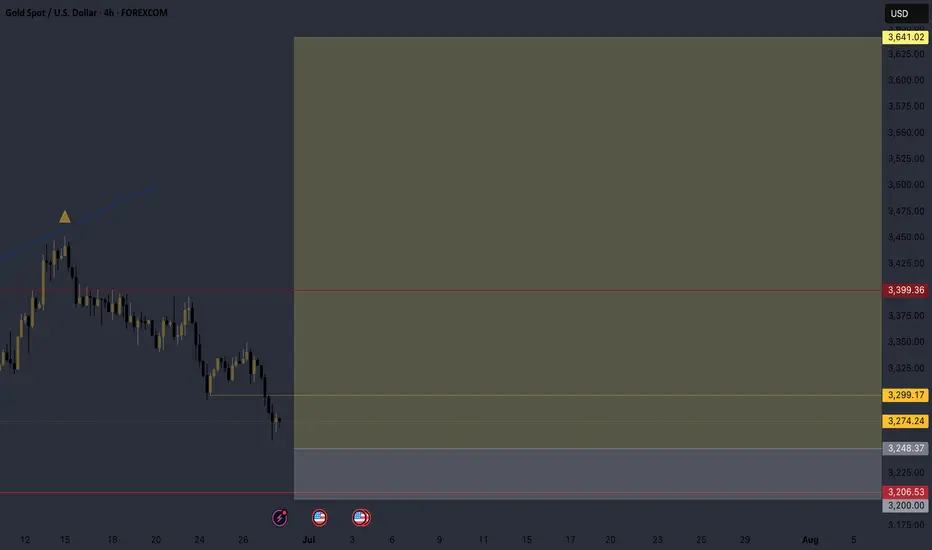
Overall Trajectory BullishEntering long positions on XAU/USD based on a confirmed 3-Drive pattern on the H4 timeframe, aligning with confluence from the 61.8% Fibonacci retracement zone.
As long as price stays and holds above 3200 I will remain bullish, if there is a close below 3200 then my analysis will be subject to change. Strong resistance will be at 3400 if it holds then the target is 3641 with a minor pullback at 3548.
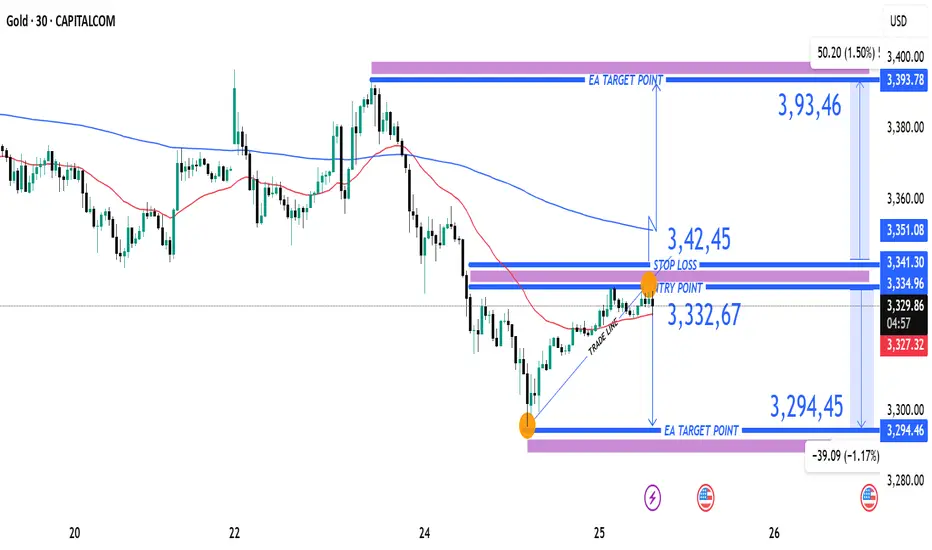
XAUUAD Reversal Setup Short Trade Opportunity Below Resistance Current Price: 3,327.56 USD
Entry Point: 3,332.67 USD
Stop Loss: 3,342.45 USD
Take Profit Levels:
Target 1 (Downside): 3,294.45 USD (-1.17%)
Target 2 (Upside): 3,393.78 USD (+1.50%)
🔧 Technical Indicators & Tools
Trade Line: Upward sloping trendline connecting higher lows, supporting recent bullish structure.
Moving Averages:
Red: Short-term (likely 50-period EMA)
Blue: Long-term (likely 200-period EMA)
Price is still trading below the long-term MA, suggesting broader bearish pressure.
Resistance Zone: 3,334.96–3,341.30 — a key supply area marked in purple.
Support Zone: 3,294.45 — identified as a previous demand level.
⚖️ Risk-Reward Analysis
Short Setup:
Entry: 3,332.67
Stop Loss: 3,342.45 (Risk ~10 USD)
Target: 3,294.45 (Reward ~38 USD)
R:R Ratio ≈ 1:3.8, which is favorable for a short trade.
📌 Summary
Bias: Bearish intraday
Setup Type: Short-sell at resistance zone
Confirmation: Price rejection or bearish candle near 3,334–3,342 zone
Invalidation: Break and close above 3,351.06 (upper resistance)
30/06 WILL WE SEE A RECOVERY ON THE LAST DAY OF THE MONTH? ↗️GOLD PLAN – 30/06: WILL WE SEE A RECOVERY ON THE LAST DAY OF THE MONTH? ☄️
✅ Macro Context – Focus on USD Debt and Political Pressure
Today marks the final trading day of June, and the U.S. faces a $6 trillion debt maturity from Covid-era borrowings, which may impact USD liquidity and market sentiment.
During the Asian session, gold experienced a sharp drop to the 32xx area before bouncing back and is now hovering near last week's close.
While the medium-term structure remains bearish, short-term signals suggest a potential reversal and recovery.
✅Political Catalyst:
→ Trump is pressuring the Federal Reserve to cut interest rates to 1%-2%, stating he won’t appoint anyone unwilling to ease policy.
→ This raises expectations of future rate cuts, which could support gold prices in the near term.
✅ Technical Outlook – Multi-timeframe Structure
On the higher timeframes, gold continues to correct lower.
However, short-term candles are showing recovery momentum, with buyers absorbing around the 327x zone.
Today’s strategy: prioritize short-term BUY setups aligned with the recovery wave.
✔️Key Resistance & Support Levels
🔺Resistance: 3283 – 3291 – 3301 – 3322
🔻Support: 3277 – 3271 – 3259 – 3247
🔖Trade Scenarios
✅Buy Scalping
🔺Entry: 3272 – 3274
🔹SL: 3268
✔️TP: 3282 – 3288 – 3298
✅Buy Zone
🔺Entry: 3249 – 3251
🔹SL: 3244
✔️TP: 3265 – 3282 – 3295 – 3310
💠Sell Scalping
🔺Entry: 3298 – 3300
🔹SL: 3304
✔️TP: 3292 – 3282 – 3270
💠Sell Zone
🔺Entry: 3327 – 3329
🔹SL: 3333
✔️TP: 3322 – 3310 – 3298 – 3282
⚡️ Final Note
As this is the month-end session, expect possible volatility driven by USD flows and institutional rebalancing.
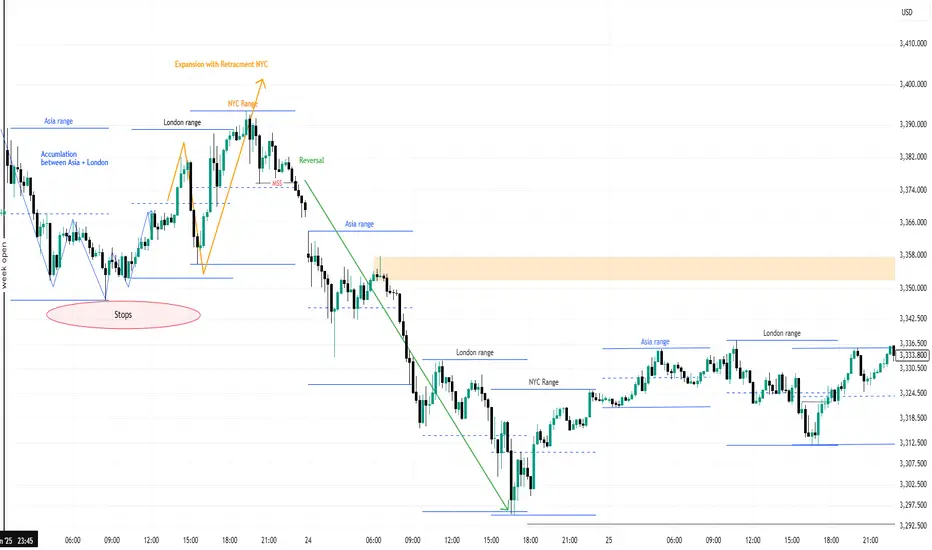
ICT Price Delivery Theory - 23-27 June ICT Price Delivery Theory Starting from first day of the week 23/06 with 3 session starting from Asia with half of London Accumulation (Blue Line) then NYC Start with Expansion and Retracement to hunt the stops for long and short positions (Orange Line)
Finally it goes to Reversal till 2nd NYC Session(Green line)
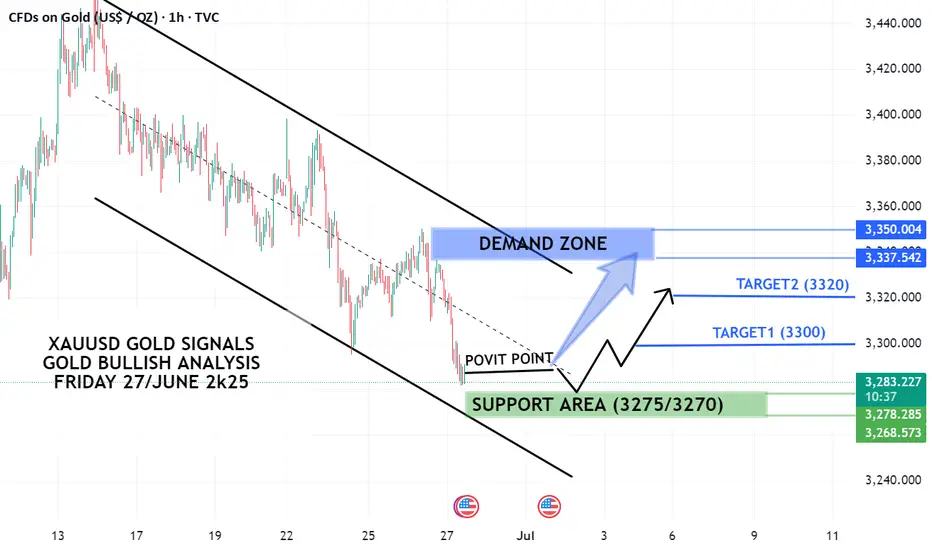
XAUUSD BULLISH ANALYSIS (READ CAPTION) GOLD READY FOR BIG FLYINGHi Traders! Here is my G0ld Analysis for today (Bullish Analysis) Chart 27 June 2k25 please read it and send the comment in the comments section
Gold pivot point is 3287 and market continually working bearish parallel and bears hit all sell targets. now Gold market ready for the Retracement. If Gold market going more down side then its jump our support area. our Bullish 1st Target is 3300 and then its show us some sell Retracement then again it jumps on buy and Easily hit our next Target 3320. If Market going Further up side then its hit our Demand zone.
Pivot Point: (3287)
Bullish Analysis:
Bullish Targets Are:
Target 1: (3300)
Target 2: (3320)
Demand Zone: (3350)
Disclaimer: This is not a Financial advice. Trade at your own risk
Please Dont Forget to Like, Comment and Subscribe
Stay tuned for further Analysis
XAUUSD Bearish Setup | OB & FVG Confluence | Targeting 3230Title: XAUUSD Bearish Setup | OB & FVG Confluence | Targeting 3230
📉 Analysis Overview (4H Timeframe)
Gold (XAUUSD) is currently in a clear downtrend, confirmed by lower highs and lower lows. Recent price action shows strong bearish momentum with confluences of key Bearish Order Blocks (OBs) and Fair Value Gaps (FVGs) forming ideal trade setups.
---
🔍 Key Technical Zones
🔴 Bearish OB: 3355–3370
🟧 FVG: 3340–3355
🔵 Sell Entry Zone: 3300–3310
❌ Stop Loss: Above 3330
🟢 Bullish OB (Buy Zone): 3255–3265
🟧 Lower FVG (Potential Reaction Area): 3285–3295
---
🎯 Take Profits
TP1: 3270
TP2: 3255
TP3: 3230
---
💡 Trade Idea
Entering short near the 3300–3310 area, which aligns with a previous FVG and resistance area. Strong OB and FVG confluence above make 3330 a logical SL. The downside has clean imbalances and OBs to support price delivery lower.
---
📌 Bias: Bearish
⏱️ Timeframe: 4H
📊 Risk-Reward: Favorable with minimal drawdown near OB rejection zone.
---
💬 Drop your thoughts below or agree if this aligns with your view!
#XAUUSD #Gold #SmartMoney #ICT #FVG #OrderBlock #PriceAction #TradingViewIdeas
Gold is bearishDue to fundamental aspect as well as technical. gold is going to its new low or new value area.
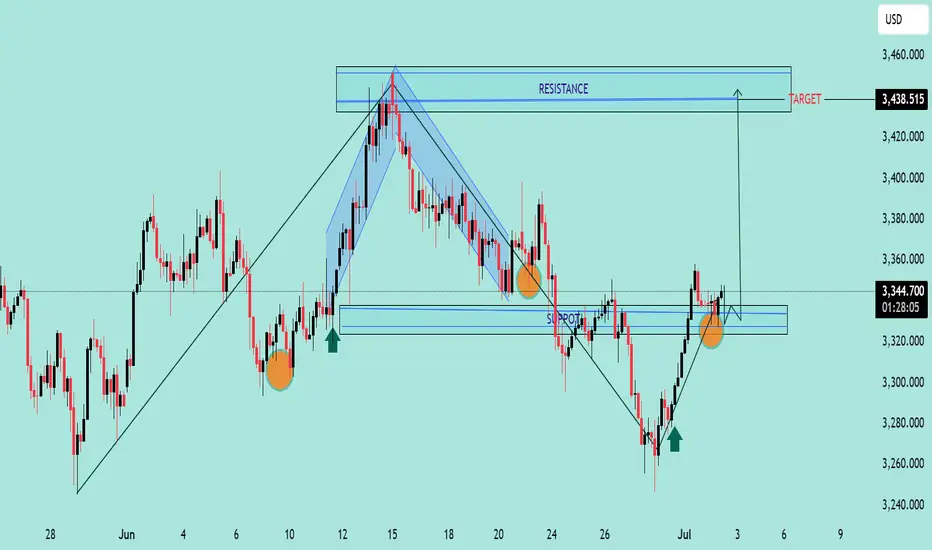
GOLD/USD Bullish Reversal and Breakout Target GOLD/USD Bullish Reversal and Breakout Target 🎯 ✨📈
🔍 Technical Analysis Overview:
The chart illustrates a clear bullish reversal pattern following a strong downtrend, with price reacting from a key support zone (highlighted in blue).
Multiple bullish rejection wicks and confirmation candles (green arrows) indicate buying interest at this support.
The recent higher low formation confirms shift in market structure towards bullish bias.
📌 Key Zones:
🟦 Support Zone: Around 3,280 – 3,320 USD
Price respected this zone multiple times (marked with orange circles), confirming its strength.
🟥 Resistance Zone / Target: 3,430 – 3,460 USD
This area aligns with previous swing highs and is the projected target for this bullish move.
📈 Chart Structure:
Break of descending trendline and bullish momentum above support suggests potential continuation towards the marked target.
Falling wedge breakout also aligns with reversal logic.
🎯 Price Target:
3,438.515 USD (resistance area), as labeled on chart with arrow and breakout projection.
🛑 Invalidation Level:
A sustained break below the support zone (3,280 USD) would invalidate this bullish outlook.
📌 Conclusion:
Gold is exhibiting strong bullish behavior with confirmation from price action and structure break. As long as price sustains above support, the path toward 3,438 remains
Gold to hit new ATH?GOLD/XAUUSD - recent 4th touch on this support trendline... the way stocks/mag7/S&P are at new ATH's could be a good time to make a move here and see Gold hit $3300+ again.
Just my opinions, not financial advise
ARE WE IN A BEAR MARKET, AT WHAT EXTENT?In this video, I attempt to explain the fractal similarities in the gold market five years apart and how we can use a best-fit model to predict the next stage of the current correction.
In the next video, I will investigate the results of our model.
Check back shortly

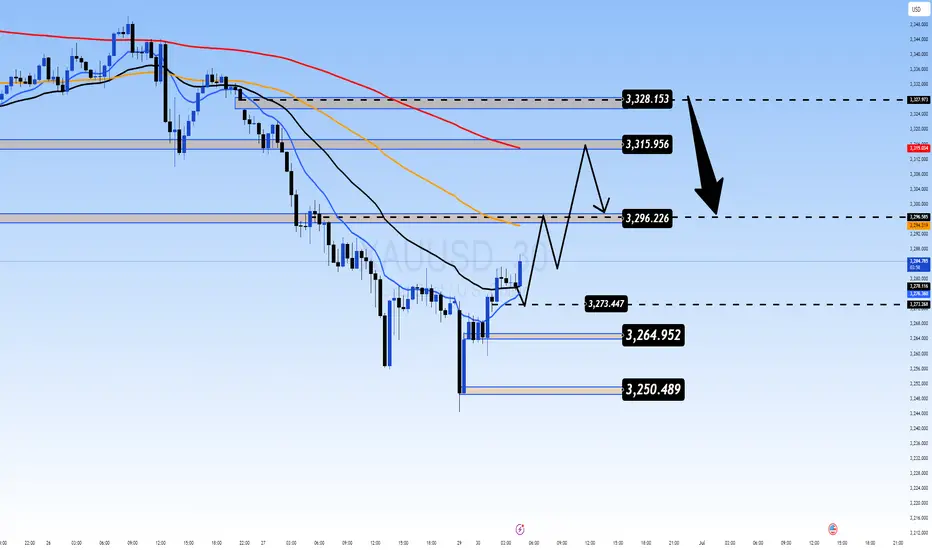
Short gold, it will fall again after reboundingToday, gold rebounded after hitting a low of around 3245, and rebounded all the way to a high of around 3296, with a rebound of more than $51. Although the strength of gold's rebound cannot be underestimated, since gold fell and broke through, the previous support has become a strong resistance under the top-bottom conversion effect. Under the influence of heavy resistance, the short trend of gold has become more obvious.
At present, gold faces resistance in the 3300-3310 area in the short term. Before breaking through this area upward, gold shorts still have an advantage, and it is possible to test the support of the 3260-3250 area again. Moreover, before the NFP market this week, gold may maintain a volatile trend, so after a sharp rebound in gold, the short force may be more expressive.
Therefore, in trading, we can appropriately consider shorting gold in the 3295-3305 area, and look at the target area: 3275-3265-3255
OANDA:XAUUSD TVC:DXY FOREXCOM:XAUUSD TVC:GOLD