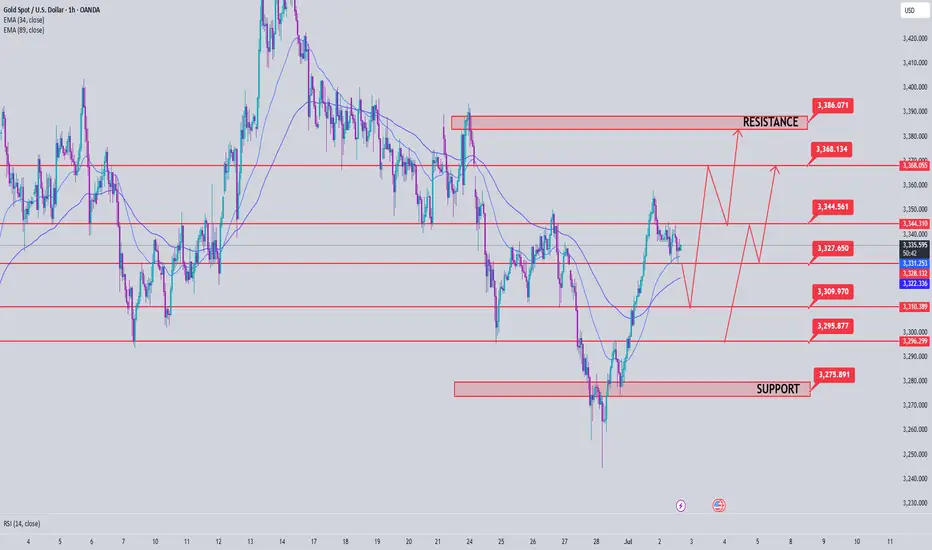
Gold price analysis July 2As expected, after the D1 candle showed the return of buying power, yesterday's trading session saw the price continue its upward trend and reach 3357.
Currently, the market is in an accumulation phase with a fairly wide range, fluctuating from 3328 to 3344. This is an important price zone, acting as a "sideway box" waiting for a breakout.
The priority strategy at this time is still trend trading - activated when the price breaks out of the above accumulation zone.
BUY orders will have a high probability of success if the price adjusts and retests the Support or Resistance zones that have just been broken, then forms a confirmation signal.
Meanwhile, SELL orders around resistance should only be considered a recovery strategy in an uptrend - requiring strict risk management and short-term profit expectations.
Breakout Range: 3328 – 3344
Support: 3310 – 3298
Resistance: 3368 – 3386
XAUUSD.F trade ideas
Gold prediction
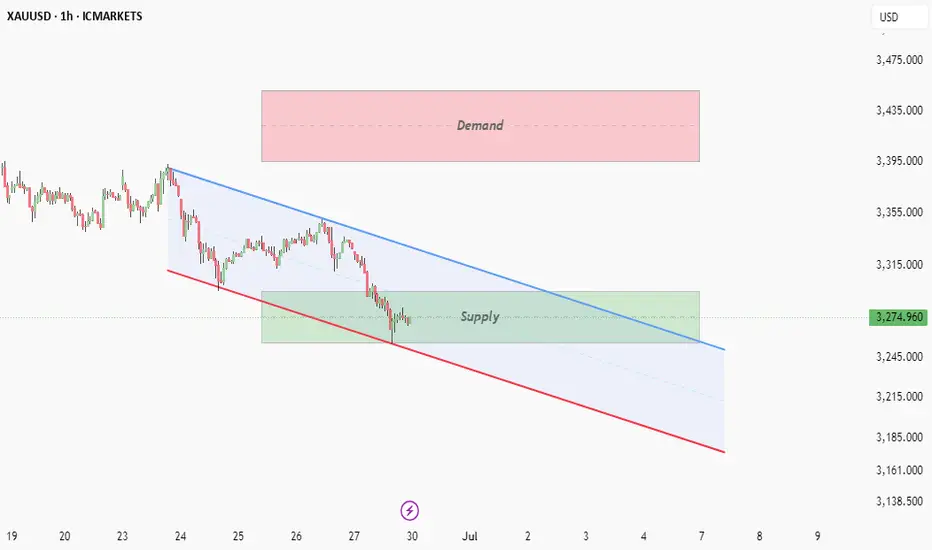
XAUUSD in a downtrend since the last week as managed to break and close bellow the the past low at 3295 level.
tested the support and seem to be respected at 3254 level.
XAUUSD Traders – The ONLY Timeframes That Matter🎓 XAUUSD Traders – The ONLY Timeframes That Matter
If you want to stop being a liquidity snack for the big players, you must know which timeframes actually reveal what the market makers are doing.
Here’s your complete educational guide for XAUUSD:
⸻
🔍 1️⃣ The 4-Hour (4H) – The Market Maker Blueprint
✅ Why Watch It?
This is where the real accumulation and distribution happens.
Market makers build and unwind positions over multiple sessions—London and New York.
If you want to see the big plan, this is your chart.
✅ What to Look For:
• Strong rejection candles near key resistance (3330–3350).
• Fake breakouts with no follow-through.
• EMA21 and SMA50 acting as dynamic resistance.
• High-volume candles marking where the big boys stepped in.
🎯 Tip: If the 4H chart is bearish, every bounce on smaller timeframes is suspect.
⸻
⏰ 2️⃣ The 1-Hour (1H) – Timing the Trap
✅ Why Watch It?
1H is perfect for seeing the moment the trap is set.
This is when price pumps into resistance or dumps below support—just enough to trigger stops.
✅ What to Look For:
• Quick rallies on low volume (pump phase).
• Reversal candles forming right after a breakout.
• Delta flipping negative as price pushes higher (hidden selling).
🎯 Tip: Combine 4H structure with 1H confirmation—this is where precision timing happens.
⸻
🎯 3️⃣ The 15-Minute (15M) – Entry Execution
✅ Why Watch It?
15M shows micro-structure and liquidity hunts.
This is where you confirm whether that big 1H candle was real—or just a head fake.
✅ What to Look For:
• Sharp wicks that stop out traders (liquidity flush).
• Tight consolidation after a failed breakout.
• Rejection patterns before price reverses.
🎯 Tip: Use the 15M to pull the trigger—not to overthink.
⸻
📅 4️⃣ The Daily – Bias Confirmation
✅ Why Watch It?
Daily sets the macro tone.
You must know whether you’re fighting the bigger wave.
✅ What to Look For:
• Where price closed relative to EMA21 and SMA50.
• Big bearish engulfing candles.
• Volatility expanding or contracting.
🎯 Tip: If daily is bearish, you have extra confirmation to fade pumps.
⸻
⚔️ How to Combine These Timeframes
Here’s the professional workflow:
1️⃣ Daily – Define bullish or bearish bias.
2️⃣ 4H – Spot the setup zone (accumulation or distribution).
3️⃣ 1H – Watch the trap unfold.
4️⃣ 15M – Execute your entry with surgical precision.
✅ This is how you stop chasing noise and start trading structure.
⸻
💡 Pro Wisdom:
“Retail traders react to price. Professionals react to price and context.”
— Technical Analysis and Stock Market Profits
⸻
🚀 Trade smart. Study structure. Outsmart the herd.
#XAUUSD #ForexEducation #PriceActionTrading #MarketMakerSecrets #LearnToTrade
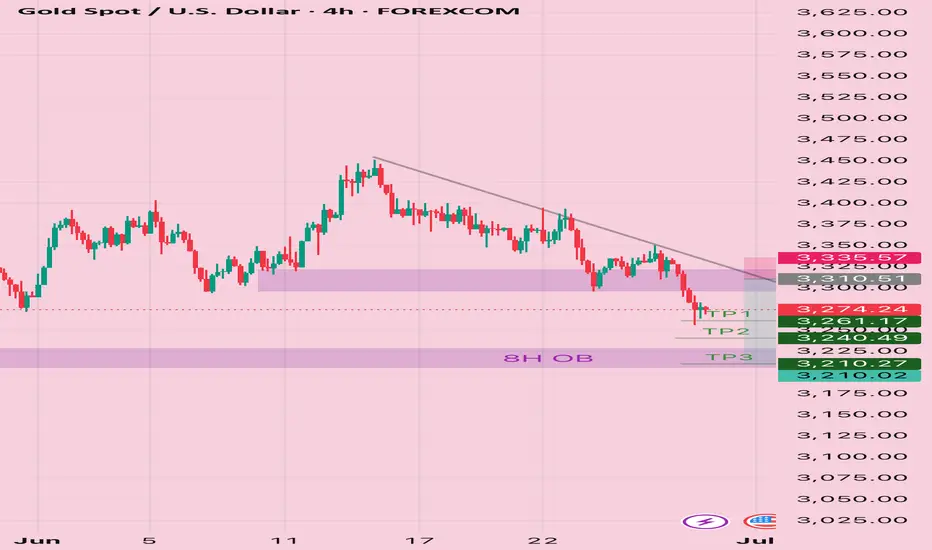
GOLD/USD 1H – Bullish Reversal SetupLiquidity Collected. Demand Activated. Gold Set to Fly.
🔽 Buy Zone (Demand Area)
Range: 3,235 – 3,245
Liquidity sweep below lows suggests smart money accumulation
Watch for bullish confirmation within this zone
Take-Profit Levels
TP1 ~3,260 Minor structure break
TP2 ~3,280 Liquidity retest zone
TP3 ~3,329 FVG fill & supply mitigation
🧠 Setup Highlights
FVG between 3,295 – 3,310
Smart Money Concepts in play
Ideal reversal timing after June 27 news event
✅ Trade Plan
Entry: Inside demand zone (on confirmation)
Stop Loss: Below 3,222.75
Targets: 3,260 → 3,280 → 3,329
R:R: Favorable if entered near demand base

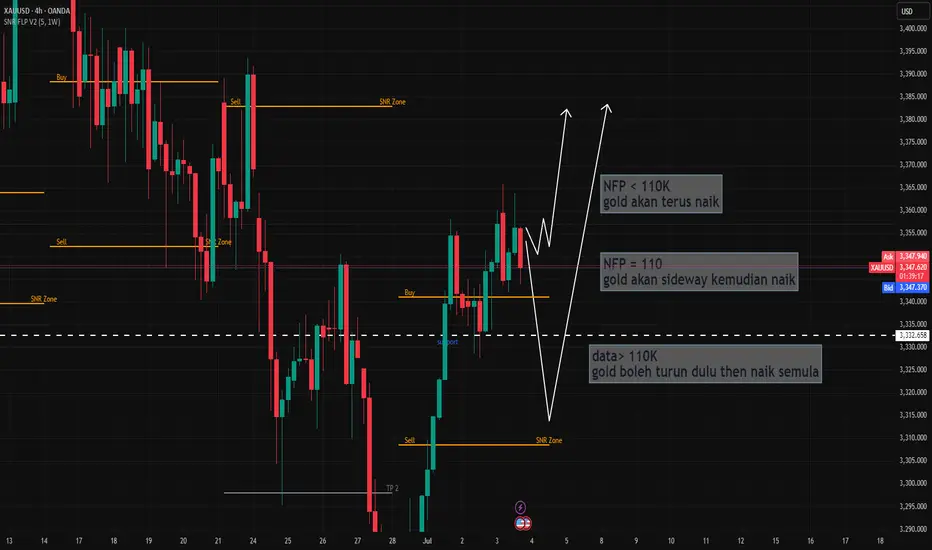
Potential NFP tonightThe markets are currently bracing for a softer-than-expected NFP print, driven by weak ADP data and U.S. demographic headwinds. If the numbers come in below consensus, it would open the door for USD‑short trades and entries into gold or equity indices. Conversely, a stronger release would warrant watching for a rebound in the dollar and Treasury yields. This report will also shape expectations around Fed policy and the likelihood of a rate cut in September.
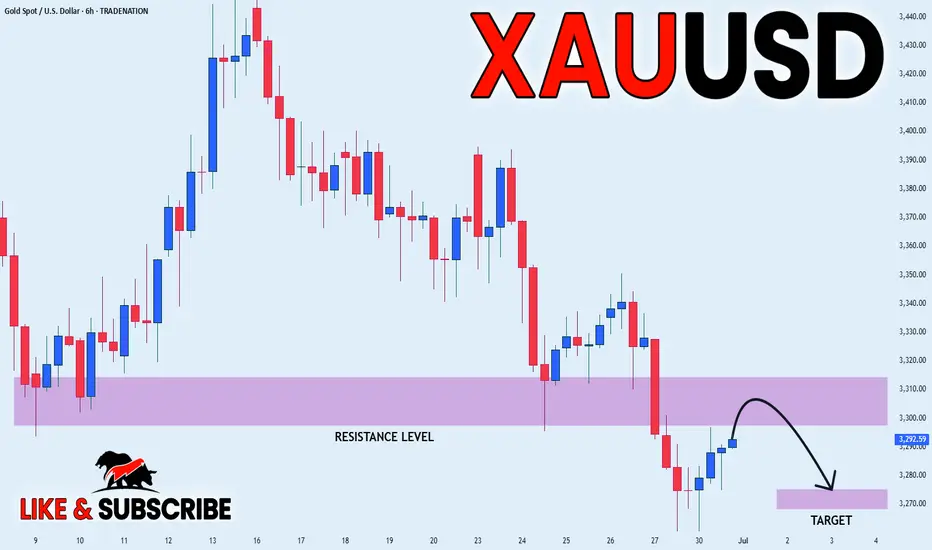
GOLD WILL FALL|SHORT|
✅GOLD is trading in a
Downtrend and the price is
Making a typical rebound but
After the horizontal resistance
Level above around 3,300$ is
Retested we will be expecting
A further bearish move down
SHORT🔥
✅Like and subscribe to never miss a new idea!✅
Disclosure: I am part of Trade Nation's Influencer program and receive a monthly fee for using their TradingView charts in my analysis.
XAUUSD:Sharing of the Latest Trading StrategyAll the trading signals this week have resulted in profits!!! Check it!!!👉👉👉
Early Session Dynamics:
Gold rebounded in today’s early trading after finding support at the prior low of 3245, aligning with our weekly forecast. The intraday strategy prioritizes a low-level rebound correction, with short positions to be initiated at resistance levels.
Key Technical Levels:
Resistance: 3295–3308
Support: 3250–3240
4-Hour Chart Perspective:
The market remains weak with high volatility. The double-bottom effect at 3245 is unconfirmed, and no bottoming pattern has emerged. Thus, the week’s initial outlook is for a range-bound oscillation between 3308 and 3240:
A rebound opportunity exists as long as 3240 holds.
A break above 3308 could trigger upward momentum.
Intraday Trading Strategy:
Lacking follow-through in the European session, the short-term trend is viewed as range-bound
Sell@3305-3295
TP:3285-3250
buy@3250-3260
TP:3285-3300
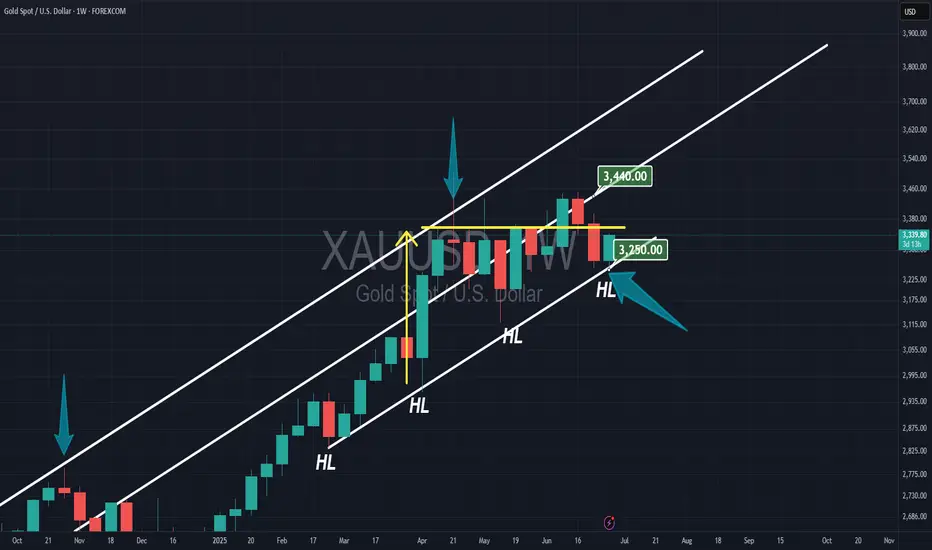
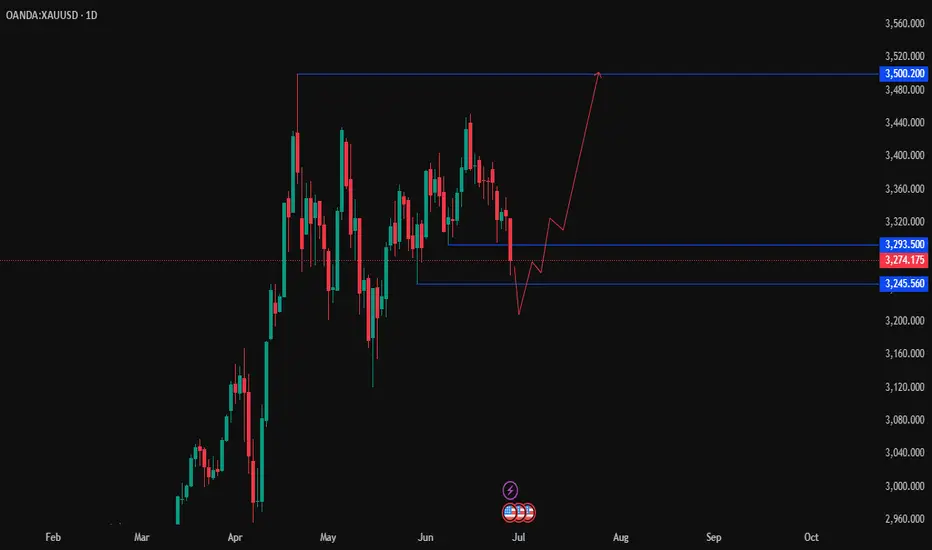
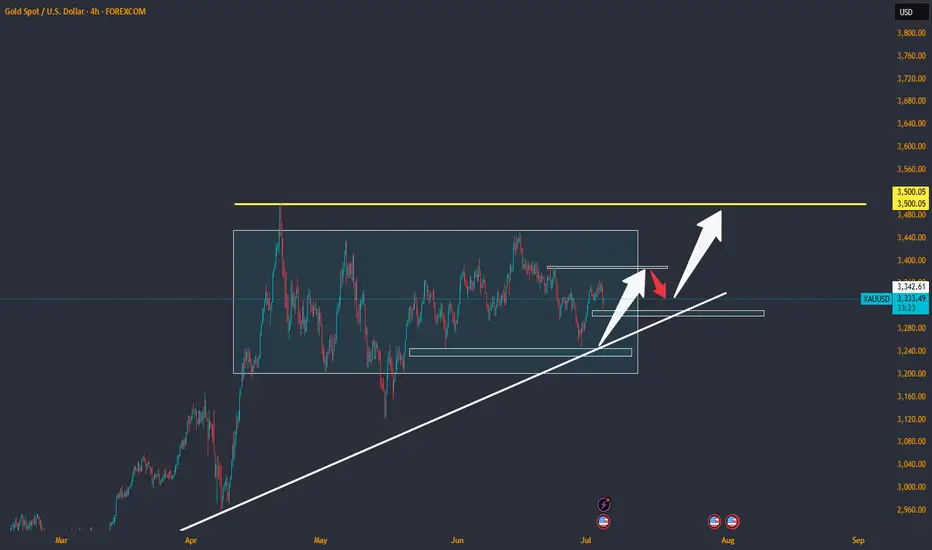
Gold in weekly and Jun Month ending analysis (Buy and forget)3250 to 3200 is key support are, look at Top trandline breakout, also take the benefit of every dip
so we tried buying last week so expecting longs this week it sweeps liquidity once more and gentlt wait for longs
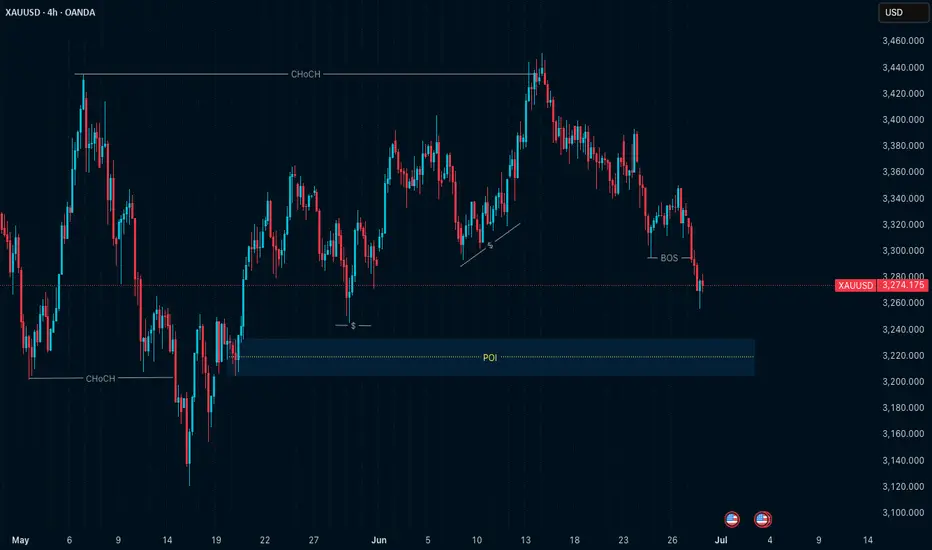
XAUUSD H4 Structure – Eyes on 3225 POI for Possible ContinuationXAUUSD has been in a structured 4H pullback, and price is now approaching a key high-timeframe zone around 3225 — marked by prior CHoCH and unmitigated price action. This level has the potential to act as a base for bullish continuation, but I will only act based on lower timeframe structure.
The trap for most traders is entering too early just because price hits a level.
My approach is different — I wait for the market to tell me when it’s ready.
🔍 The Flow I Follow (As Always):
HTF Context – Price is pulling back within a broader bullish range
POI Identified – 3225 zone = key area of interest
Wait for LTF Shift – I’ll only consider a trade if:
- M15 shows CHoCH (shift in internal structure)
- Followed by a BOS (momentum confirmation)
Then, and only then, I enter. Otherwise, I let it go.
🧠 Why This Matters:
This structure-first mindset keeps me out of random trades.
I don’t predict — I align.
No M15 shift?
No BOS?
No trade.
📊 Chart Context:
The chart attached shows:
Previous CHoCH levels
Recent BOS confirming internal structure break
Cleanly marked POI around 3225
Still no valid LTF shift — so it’s a “watch, not trade” phase
📖 From the Book Philosophy:
“The chart is the mirror. It reflects your level of patience, not your level of prediction.”
This setup reflects exactly what I teach in my book The Chart Is The Mirror — how to stop reacting to candles and start respecting structure.
No signals.
No indicators.
Just clean alignment of levels and psychology.
GOLD Setup- Bearish Bias!FOREXCOM:XAUUSD Price is forming a series of lower highs and lower lows on the 4‑hour timeframe, indicating a downtrend bias. Recent resistance at the 70 EMA / descending trendline is holding strong,hard to break above.
Based on recent candle pattern with long lower wicks at current price, it’s most likely A short term correctional swing might occur to zone 3295-3310.
Setup:
Entry: 3300-3310
Targets: 3260, 3240, 3210
Stop Loss: 3331
Risk: 1:2,3,5
Disclaimer: This is not financial advice.
.
Welcoming your thoughts in this setup. Let’s grow together<3
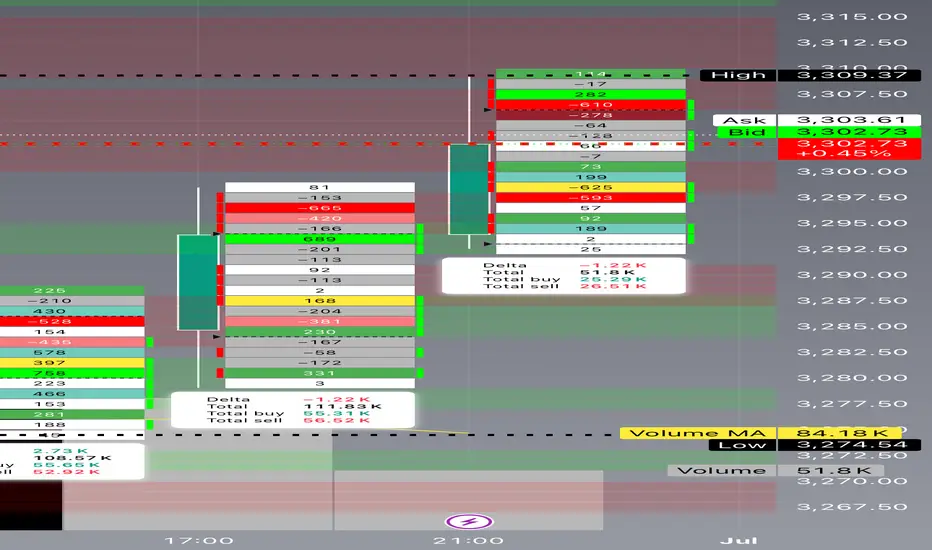
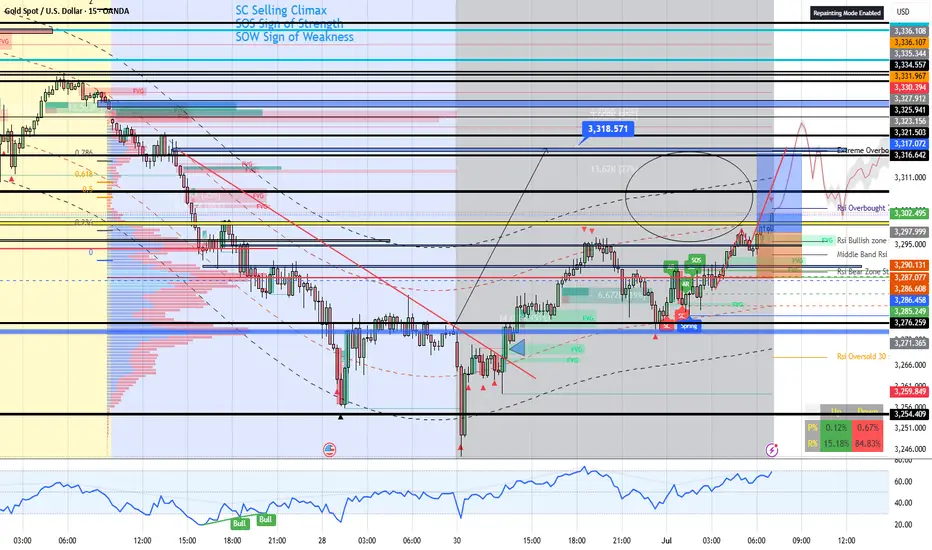
XAUUSD - BUY - Scalp
1. Market Structure & Trend
Recent Downtrend: The left side of the chart shows a sharp, persistent decline, with price breaking through multiple support levels.
Base Formation: After the selloff, gold found support (marked “Spring” and “SC”—Selling Climax) and began consolidating, forming a base.
Reversal Signs: The chart shows classic Wyckoff accumulation signals:
SC (Selling Climax): Panic selling exhausts sellers.
Spring: Final shakeout, trapping late shorts.
AR (Automatic Rally): First strong bounce.
SOS (Sign of Strength): Bullish breakout above resistance.
2. Key Levels & Zones
Support: Thick blue and black horizontal lines mark major support zones where price reversed.
Target: The blue label at 3,318.571 marks a major upside target, aligning with a prior high and a confluence of resistance.
3. Volume & Order Flow
Volume Profile: The red/blue histogram on the left shows heavy volume at lower prices, indicating accumulation. Lower volume above suggests less resistance if price rallies.
4. RSI & Momentum
Recently rebounded from oversold (below 30), supporting the bullish reversal.
Sign of Strength (SOS): Confirms buyers are in control for now.
Actionable Insights
Short-term: Bullish momentum is strong; price is likely to test the 3,318 resistance zone.
In summary:
If momentum holds, a breakout could trigger further upside; if not, a pullback or consolidation is likely.
XAUUSD Update after NFP July 2025After NFP of July 2025 data released, Gold has a minor drop and it seen to moving upside to continue the major trend.
Still watching a fundamental news such as a geopolitical, war, global economic to drive it move.
Technical support now is on 3310 level.
Good Luck !
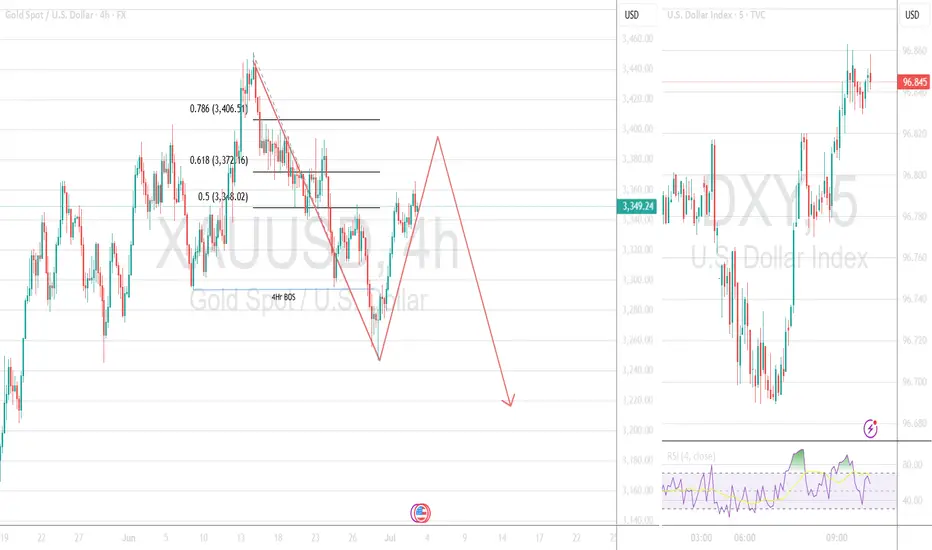
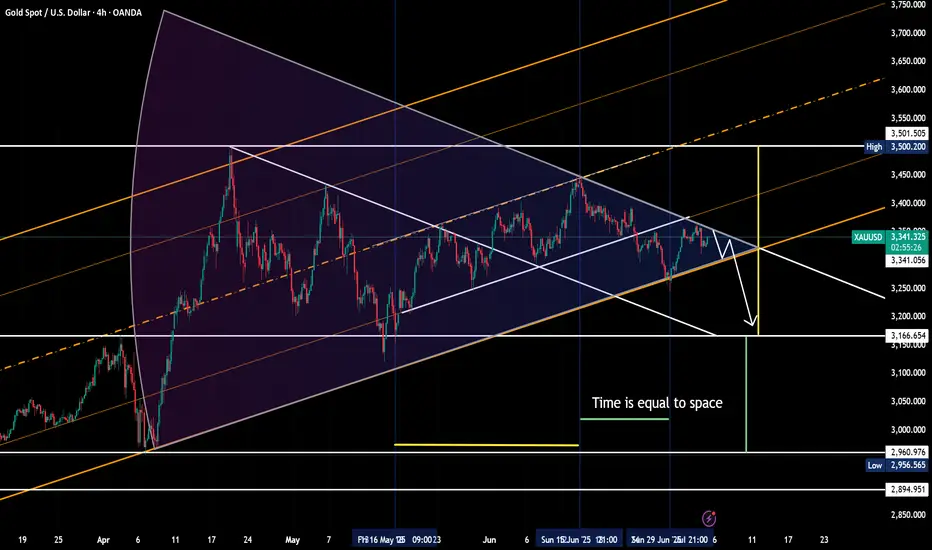
Gold 4Hr Set upGold having broken the 4Hr structure is now retracing. I am predicting the price to struggle to break 3400 mark and to fall down.
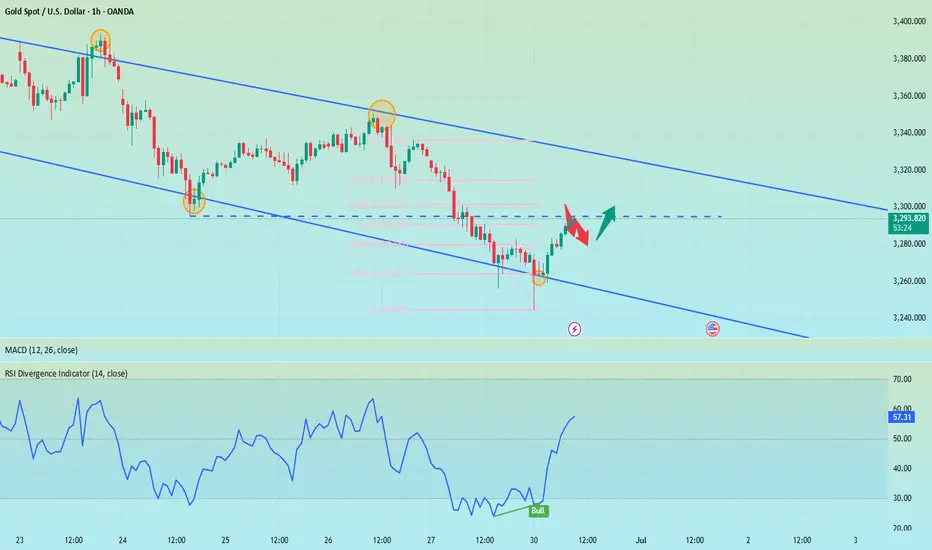
Analysis and layout of gold trend at the end of the month📰 News information:
1. Gold market liquidity at the end of the month
2. Impact of geopolitical situation
📈 Technical Analysis:
From the beginning of the decline of gold near 3338 on Friday to today's lowest point near 3244, gold has fallen by nearly $94. At present, gold has rebounded as expected. In the short term, I think we have two key areas to pay attention to. The first is the position of 3290-3295, which is a 50% rebound, and the second is the upper top range limit range of 3300-3320. Of course, if it breaks through 3280 and then retreats, it can also be long twice, but the current price rebounds, considering the position of the temporary low long position, there is not much trading opportunity. First look at the key areas given to find opportunities for shorting, and pay attention to the opportunity of retreating to 3280-3270 below.
🎯 Trading Points:
SELL 3290-3295
TP 3380-3370
SELL 3300-3310-3320
TP 3290-3280-3270
BUY 3270-3260
TP 3290-3300
In addition to investment, life also includes poetry, distant places, and Allen. Facing the market is actually facing yourself, correcting your shortcomings, confronting your mistakes, and strictly disciplining yourself. I hope my analysis can help you🌐.
OANDA:XAUUSD FOREXCOM:XAUUSD FX:XAUUSD PEPPERSTONE:XAUUSD FXOPEN:XAUUSD TVC:GOLD
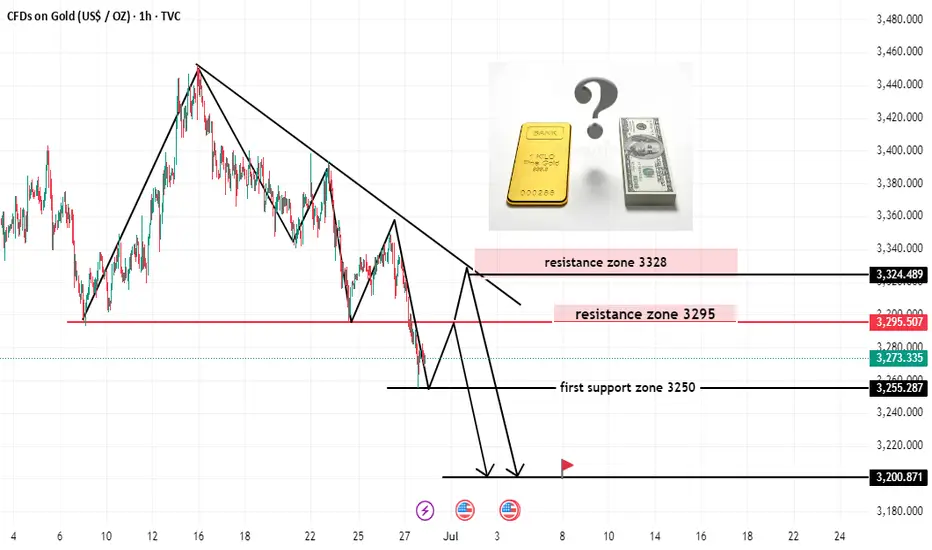
GOLD READY FOR SELL (READ CAPTION)Hello trader. what do you think about gold
current price; 3273
gold is breakout resistance zone in weekly candles i think gold retest upside and testing resistance then gold fall down
resistance zone : 3295_3325
support zone 3250
demand zone:3200
please like comment and follow thank you
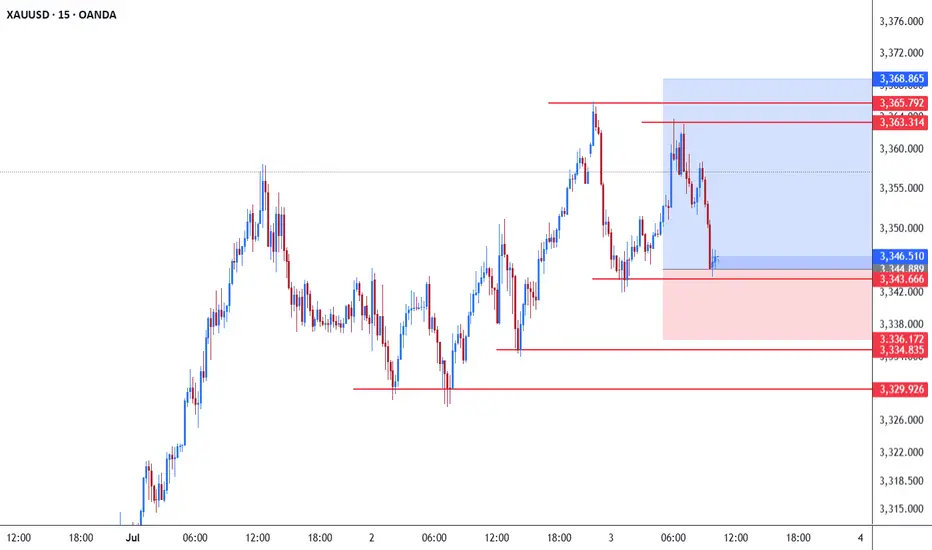
Gold (XAU/USD) Technical Analysis – July 3, 2025The chart of gold (XAU/USD) on the 15-minute timeframe shows that the price is moving within a corrective range after a strong bullish wave during which gold reached levels above $3,368 per ounce. Following a rejection from the resistance area near 3,365–3,368, the price began a downward correction and is currently stabilizing around the support zone at 3,344–3,343.
The price is now testing a key support area. If it holds above this zone, we may see a rebound toward the 3,363 and 3,365 resistance levels. A breakout above 3,368 could restore bullish momentum and open the way for new highs.
However, if the current support at 3,343 breaks, the bearish scenario would be favored, with potential targets at the next support levels around 3,336 and 3,329.
Likely Scenario: As long as gold holds above 3,343, the bullish bias remains valid. We will monitor price action at this area to confirm a possible rebound.
Key Levels to Watch:
Support: 3,343 – 3,336 – 3,329
Resistance: 3,363 – 3,365 – 3,368
This is a short-term analysis and depends on the price reaction at the current support zone.
GOLD: Strong Bearish Sentiment! Short!
My dear friends,
Today we will analyse GOLD together☺️
The in-trend continuation seems likely as the current long-term trend appears to be strong, and price is holding below a key level of 3,341.44 So a bearish continuation seems plausible, targeting the next low. We should enter on confirmation, and place a stop-loss beyond the recent swing level.
❤️Sending you lots of Love and Hugs❤️

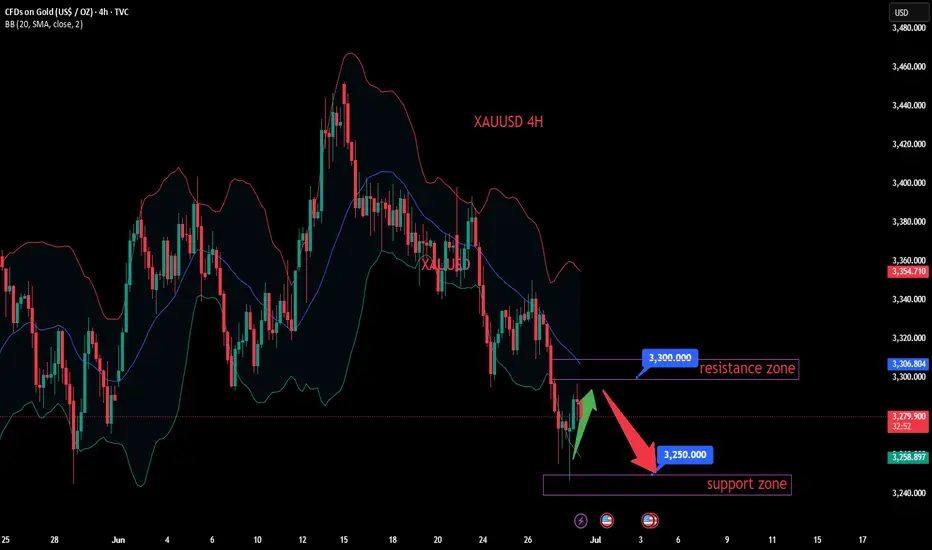
Gold price range: 3310-3360Gold price range: 3310-3360
Spot gold fell to $3311.65 during the session, but it is still fluctuating above the key support level of $3310, and the current price is around 3340.
As shown in the figure:
The latest triangle convergence range oscillation pattern has been shown to everyone
Key pressure area: 3355-3360
Key support area: 3310-3320
It is expected to enter a range oscillation pattern on Friday.
Due to the US Independence Day holiday, today's gold price trend is more affected by the performance of the Asian session.
According to analysis and observation, the gold price showed a pull-up or oscillating upward trend in the Asian session this week.
Most of the factors that led to the rise in gold prices this week can be attributed to the pull-up rhythm in the Asian session.
According to Chinese news reports: China has suspended holdings of gold, but Turkey and India are still buying.
In other words, the main factors for this week's rise are Turkey and India.
At present, the range of gold price fluctuations will become narrower and narrower, and it is unlikely that a new general direction will appear this week.
Then the corresponding strategy is:
In the oscillation range of 3310-3360, use oscillation thinking to trade
Short at high level, stop loss at 3365
Long at low price, stop loss at 3300
The author prefers the idea of short at high price
XAUUSD (GOLD): Sell setupXAUUSD (GOLD): Sell setup. It is ready for a sell, it will open in Asian session, and also market is complex now, but here is my plan.
Cheers
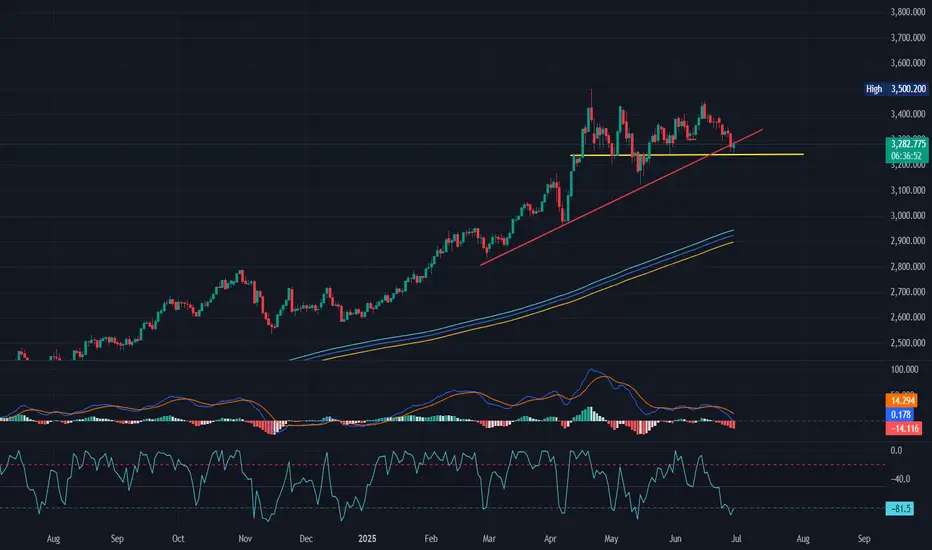
XAUUSDOn Daily tf XAU has reached the support level as marked with the yellow line, Williams%R is in oversold condition, also MACD it will turn bullish on daily close today.
my target is 3380-3420$
NFA
DYOR
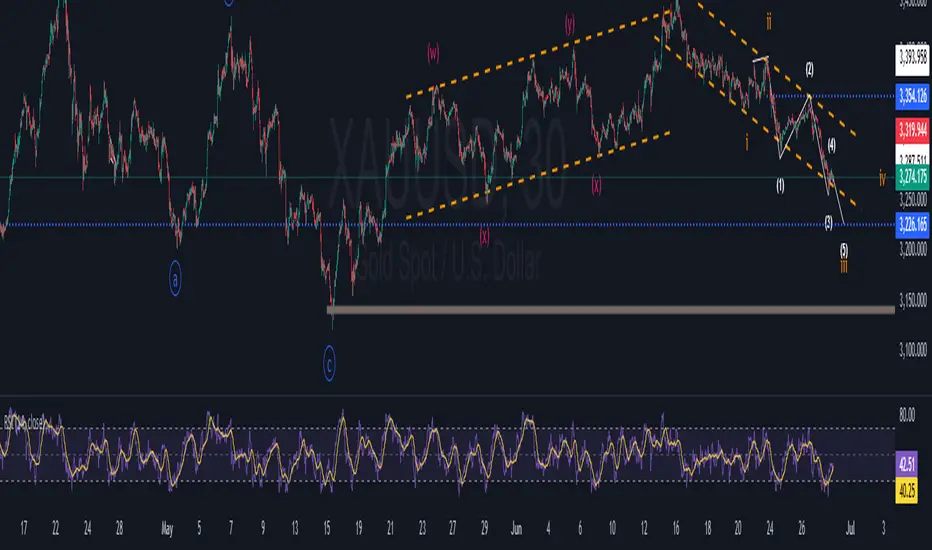
XAUUSD STILL GOING DOWN Look Gold now its start to move on wave 3, so the it going to break the channel and finish wave micro wave 3 (3226) and then and retest to form wave 4 (3254) and then continue down up to 3100 before to start to buy, so keep watching