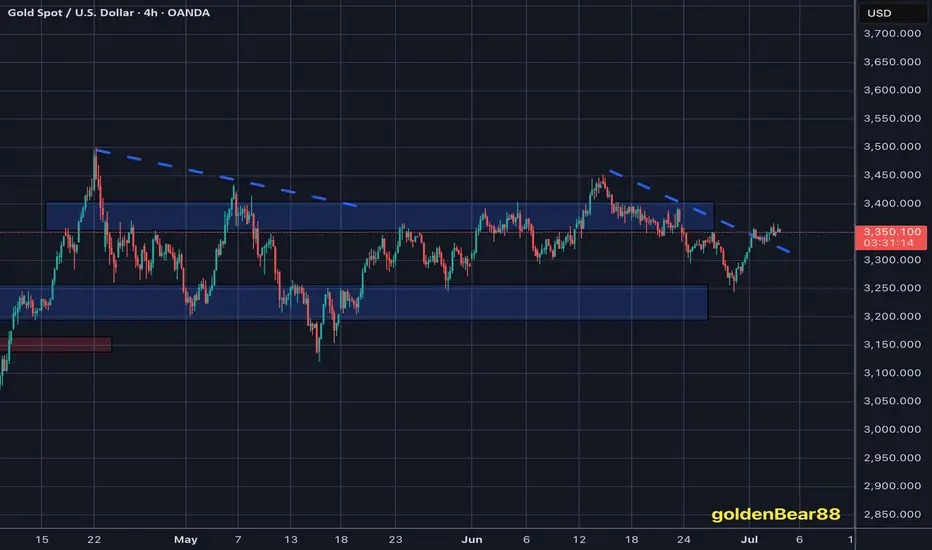
Gold Breakout and Potential RetraceHey Traders, in today's trading session we are monitoring XAUUSD for a selling opportunity around 3,350 zone, Gold was trading in an uptrend and successfully managed to break it out. Currently is in a correction phase in which it is approaching the retrace area at 3,350 support and resistance zone.
Trade safe, Joe.
XAUUSD.F trade ideas
XAUUSDTHE united state interest rate stands at 4.25%-4.5%
the US10Y open the day at 4.293% and closes 4.26% a significant drop from may high of 4.62%
the dollar index is heading to 96$ after open 97.611$ to close 97.313$.
Final GDP q/q
Actual: -0.5%
Forecast: -0.2%
Previous: -0.2%
The US economy contracted by 0.5% in the first quarter, worse than the expected 0.2% decline, indicating a sharper slowdown than anticipated.
2. Unemployment Claims
Initial Claims: 236,000
Forecast: 244,000
Previous: 245,000
Initial jobless claims fell by 10,000 to 236,000, lower than forecast and near historically low levels, suggesting that layoffs remain relatively subdued despite economic challenges.
3. Core Durable Goods Orders m/m
Actual: +0.5%
Forecast: +0.1%
Previous: +0.2%
Core durable goods orders, which exclude transportation, rose 0.5% month-over-month, beating expectations and signaling some resilience in business investment.
4. Durable Goods Orders m/m
Actual: +16.4%
Forecast: +8.6%
Previous: -6.3%
Total durable goods orders surged 16.4%, a strong rebound following a prior decline, indicating a pickup in demand for long-lasting manufactured goods.
5. Final GDP Price Index q/q
Actual: 3.7%
This measure of inflation in the GDP deflator remains elevated, reflecting persistent price pressures in the economy.
Summary of Market Implications:
The larger-than-expected GDP contraction signals economic weakness, which could increase expectations for accommodative Fed policy.
The drop in initial jobless claims supports the view that layoffs are limited, but rising continuing claims suggest some labor market softness ahead.
Strong durable goods orders point to underlying business investment strength, providing a mixed but cautiously optimistic outlook.
Elevated inflation as shown by the GDP price index keeps inflation concerns alive.
Overall, the data presents a complex picture of a slowing economy with pockets of resilience and ongoing inflationary pressures
the interest rate remains 4.24%-4.5% ,the bond market remain weak on fiscal policy challenges and pending rate outlook.
the 10 year bond yield is trading around 4.291% -4.26% and edge lower from fundamental outlook.
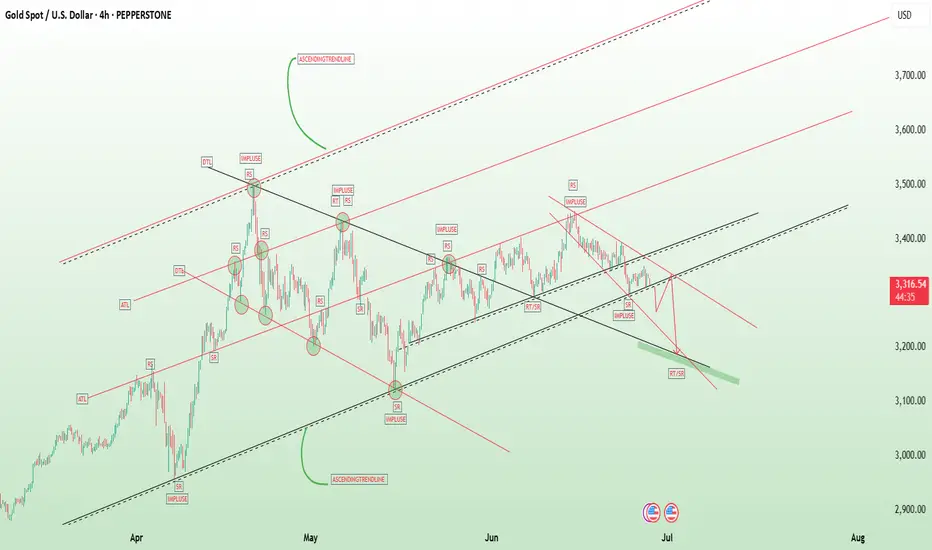
gold on ascending trendline connecting April till June and found support at 3312-3314.
buyers during newyork session will build momentum on technical to bridge 3350 supply .
break below 3311-3314 will heading to my demand floor .
XAU/USD) Bullish trand Read The captionSMC trading point update
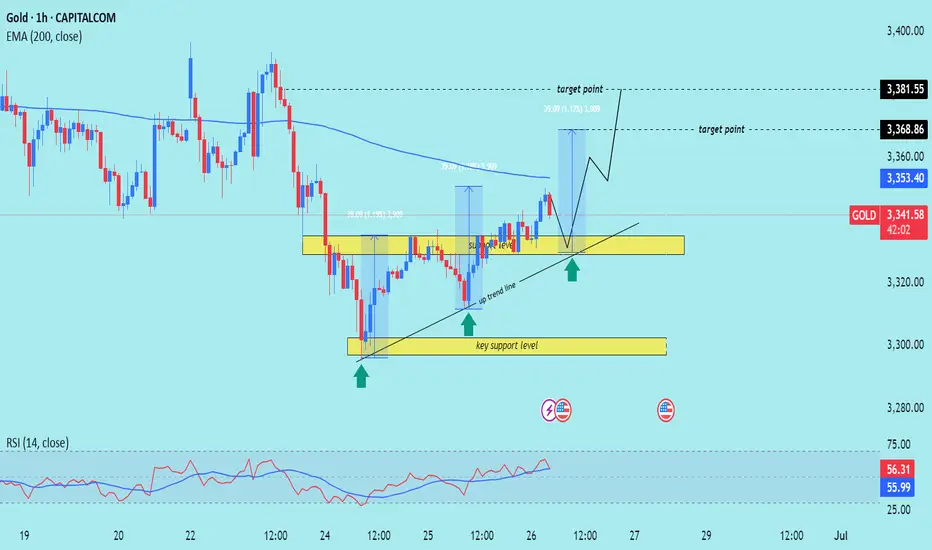
Technical analysis of Gold (XAU/USD) on the 1-hour timeframe, highlighting a breakout from consolidation supported by key levels and trend structure. Here’s the detailed analysis:
---
Technical Breakdown
1. Key Support Zone
Price has formed a strong base around 3,315–3,325, with multiple bullish rejections (green arrows).
This zone has acted as a demand level, reinforcing bullish structure.
2. Ascending Trendline Support
An uptrend line supports higher lows, showing momentum building to the upside.
3. EMA 200
Price is now challenging the 200 EMA (3,353.41) — a key dynamic resistance.
A successful breakout and retest above this EMA will likely fuel continued bullish movement.
4. Breakout & Measured Move Projections
The chart indicates a bullish breakout from a consolidation box (yellow zone).
Measured move targets based on the previous rally:
First target: 3,368.86 (1.17%)
Second target: 3,381.55 (1.75%)
5. RSI Confirmation
RSI (14) is around 57, showing bullish momentum but still below overbought—supporting further upside potential.
Mr SMC Trading point
---
Conclusion / Idea Summary
Bias: Bullish
Entry Zone: On pullback into 3,330–3,340 range or breakout retest above EMA 200
Targets:
3,368.86
3,381.55
Invalidation: Sustained close below 3,320 and break of the uptrend line
---
Please support boost 🚀 this analysis)
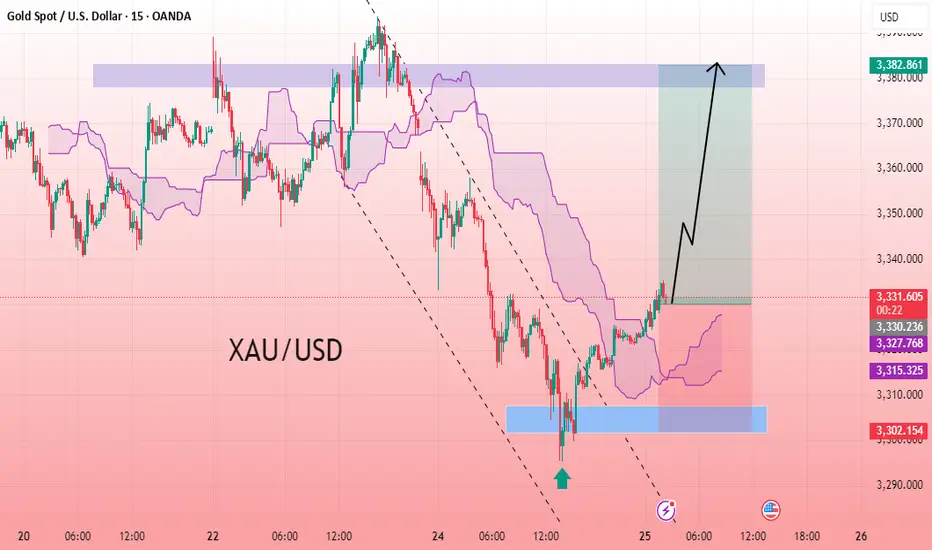
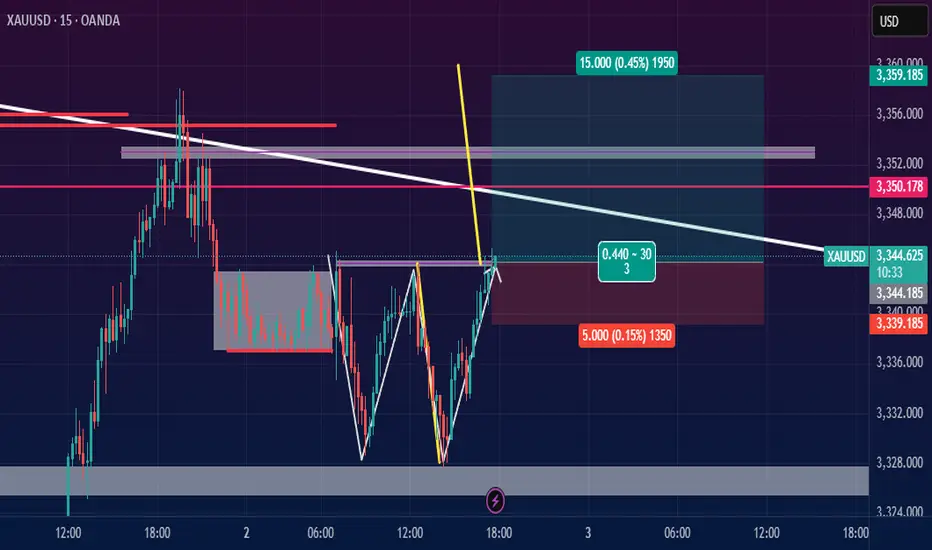
XAU/USD Reversal Signal Bullish Momentum: Targeting 3337The XAU/USD 15-minute chart indicates a strong bullish reversal after price action bounced from the key support zone near 3302. A clear breakout from the descending channel signals that bearish momentum has faded. Price is now trading above the Ichimoku cloud, reinforcing the shift in short-term sentiment. This move is supported by strong bullish candles and rising momentum, suggesting buyers have regained control. The price has also broken a key intraday resistance level, opening the door for further upside. The projected move targets the upper resistance zone around 3377, as marked on the chart. With favourable risk-to-reward and confirmation from technical indicators, this setup aligns well with a bullish intraday trade.
Entry Point: 3330
Target Point: 3377
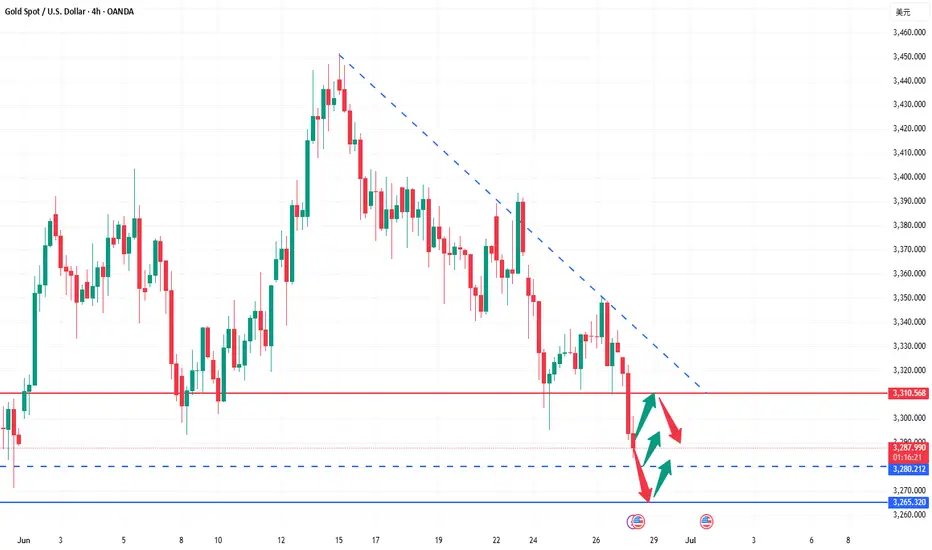
Where will gold go?In 4 hours, it has fallen below the previous low of 3295, and will continue to fall. There are two supports below, namely 3280 and 3265. Don't expect a big rebound before going short in a negative market. If the rebound is large, it will not fall. This kind of negative decline is generally judged by the 15- and 30-minute patterns. When resistance appears in the big cycle, the market has actually fallen a lot.
Today, I think the pressure is mainly in the 3300 and 3310 areas. 3310 can be considered as the pressure of the top and bottom conversion. Pay attention to 3280 and 3265 below. If you consider going long, these two positions are the main positions. For the time being, the general direction is mainly short.
Gold Holds Steady as Focus Shifts to Fed Policy Over GeopoliticaGold Holds Steady as Focus Shifts to Fed Policy Over Geopolitical Risk
- Gold prices remained resilient. The US Dollar Index slipped 0.23% to 97.74, while U.S. equities ended mixed as markets braced for Federal Reserve policy signals.
- The Israel-Iran ceasefire has eased geopolitical concerns, typically a bearish signal for gold. However, the metal’s continued strength, outperforming the weaker dollar, points to renewed institutional and retail accumulation. This highlights a key shift: investors are now prioritising monetary policy outlooks over crisis-driven moves.
- All eyes are on Fed Chair Jerome Powell’s congressional testimony, with particular focus on his comments regarding tariffs and interest rates. The CME’s FedWatch tool now shows a 24.8% probability of a July rate cut. Powell’s cautious tone—balancing inflation risks from potential tariffs against economic softness—has added uncertainty to the rate path, especially amid political pressure from the Trump administration.
- Gold’s recent price action suggests it’s evolving from a pure safe-haven asset into a hedge against broader monetary and economic instability. With geopolitical tensions easing, traders are now closely watching the Fed’s next steps and the dollar’s direction as key drivers of gold’s trajectory.
Bulls recover in new week, gold price returns to 3300⭐️GOLDEN INFORMATION:
Gold prices (XAU/USD) regained some lost ground during Monday’s Asian session, buoyed by growing expectations that the US Federal Reserve may implement more interest rate cuts this year—and potentially sooner than previously anticipated. Such prospects weigh on the US Dollar, making the dollar-denominated metal more attractive to overseas buyers.
However, the recent improvement in global risk sentiment—driven by the US-China trade accord and a ceasefire agreement between Israel and Iran—could reduce demand for Gold’s safe-haven appeal. Investors now turn their attention to upcoming comments from Federal Reserve officials, with speeches from Atlanta Fed President Raphael Bostic and Chicago Fed President Austan Goolsbee expected later in the day.
⭐️Personal comments NOVA:
Gold price recovered, accumulating at the beginning of the new week around the price range of 3300. Still in the main downtrend.
⭐️SET UP GOLD PRICE:
🔥SELL GOLD zone: 3316- 3318 SL 3323
TP1: $3305
TP2: $3290
TP3: $3277
🔥BUY GOLD zone: $3248-$3246 SL $3241
TP1: $3258
TP2: $3270
TP3: $3286
⭐️Technical analysis:
Based on technical indicators EMA 34, EMA89 and support resistance areas to set up a reasonable BUY order.
⭐️NOTE:
Note: Nova wishes traders to manage their capital well
- take the number of lots that match your capital
- Takeprofit equal to 4-6% of capital account
- Stoplose equal to 2-3% of capital account
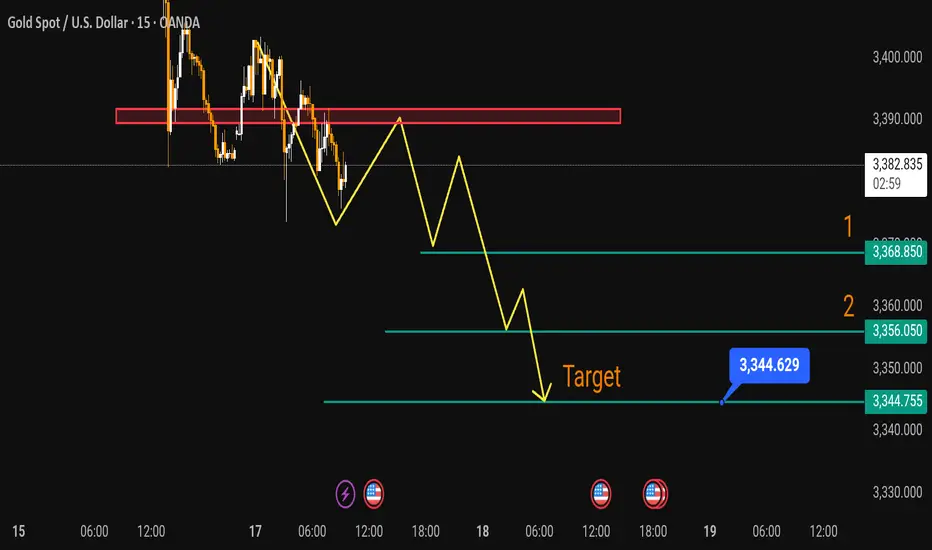
XAUUSD Expecting Selling movementPrice Level & Trend
Current price $3380
The market has been forming lower highs and lower lows, suggesting a bearish trend continuation
A yellow zigzag line projects a possible downward price movement path
Resistance Zone
A red rectangular zone marks a strong resistance area, previously tested multiple times and rejected
Price failed to break above this zone, reinforcing the bearish outlook
Support & Target Levels
Three significant horizontal support levels are marked
Level 1 $3,368
Level 2 $3,356
Final Target Zone Around $3344 $3344
The final target is emphasized with an orange Target label and arrow, indicating the expected destination for this bearish move
Projection
The chart anticipates short-term pullbacks retracements followed by further downside
This is visualized through the yellow zigzag pattern illustrating probable future price action
GOLD Price Analysis: Key Insights for Next Week Trading DecisionIn this video, I break down last week’s gold price action and give you a detailed outlook for the week ahead. With gold closing around $3,260 and major macroeconomic shifts unfolding—including the Israel-Iran ceasefire talks, rising US dollar strength, and concerns over the US Q1 GDP contraction, we are at a turning point.
📉 Will weakening economic data force the Fed to pivot?
📈 Could this create a fresh bullish wave for gold?
Or will stronger job numbers and inflation data drag gold lower?
✅ What you’ll learn in this video:
✅Key fundamental drivers affecting gold (XAU/USD)
✅Important economic events to watch (Fed Chair speech, NFP, ISM)
✅My technical analysis of gold price levels to watch
✅How to read the current market sentiment like a pro
✅Strategic trading zones for bulls and bears
🔔 Don’t forget to like the video in support of this work.
Disclaimer:
Based on experience and what I see on the charts, this is my take. It’s not financial advice—always do your research and consult a licensed advisor before trading.
#xauusd, #goldprice, #goldanalysis, #goldforecast, #goldtrading, #xauusdanalysis, #technicalanalysis, #fundamentalanalysis, #forextrading, #forexmentor, #nfpweek, #goldoutlook, #tradingstrategy, #chartanalysis, #julyforecast, #fedwatch, #priceaction, #traderinsights, #commoditytrading, #marketbreakdown, #xauusdforecast, #tradethefundamentals, #smartmoneytrading

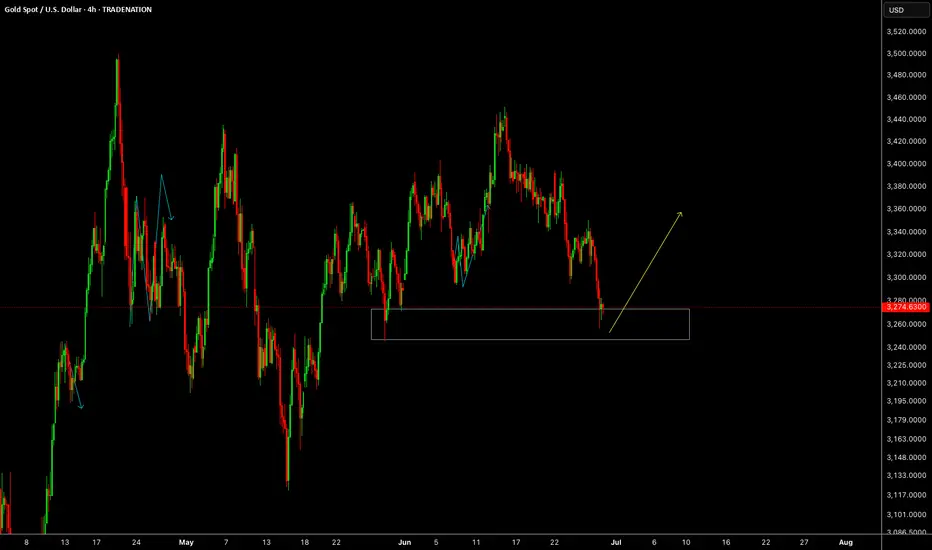
GOLDGOLD is about to get ready for a push up, keep an eye from the reaction zone for buy setups.
Disclosure: We are part of Trade Nation's Influencer program and receive a monthly fee for using their TradingView charts in our analysis.
Gold accumulates and moves above 3350⭐️GOLDEN INFORMATION:
Gold prices declined by 0.80% on Thursday after a robust US Nonfarm Payrolls (NFP) report boosted the US Dollar, dampening expectations for a Federal Reserve rate cut at the upcoming July meeting. At the time of writing, XAU/USD is trading at $3,332, after reaching an intraday high of $3,365.
June’s employment data significantly outperformed forecasts and even surpassed May’s figures, reinforcing the resilience of the US labor market. Notably, the Unemployment Rate edged closer to the 4% mark, underscoring continued labor market strength. The upbeat report casts doubt on Wednesday’s softer ADP private-sector jobs data, which had shown a 33,000 drop in hiring.
⭐️Personal comments NOVA:
Gold price accumulates and recovers around 3350. Friday has no important news and bank holiday in US session, short-term recovery
⭐️SET UP GOLD PRICE:
🔥SELL GOLD zone: 3365- 3367 SL 3372
TP1: $3355
TP2: $3342
TP3: $3330
🔥BUY GOLD zone: $3311-$3313 SL $3306
TP1: $3325
TP2: $3338
TP3: $3350
⭐️Technical analysis:
Based on technical indicators EMA 34, EMA89 and support resistance areas to set up a reasonable BUY order.
⭐️NOTE:
Note: Nova wishes traders to manage their capital well
- take the number of lots that match your capital
- Takeprofit equal to 4-6% of capital account
- Stoplose equal to 2-3% of capital account
Gold W PatternActually 50-50 there is potential for prices to go up or down, but by chance it is safer for us to take a buy because of the w pattern, so here I took a buy, for conservative entry wait for a breakout, but if later it looks like a fake breakout has broken out upwards but goes back down then we will stop and reverse to take a sell.
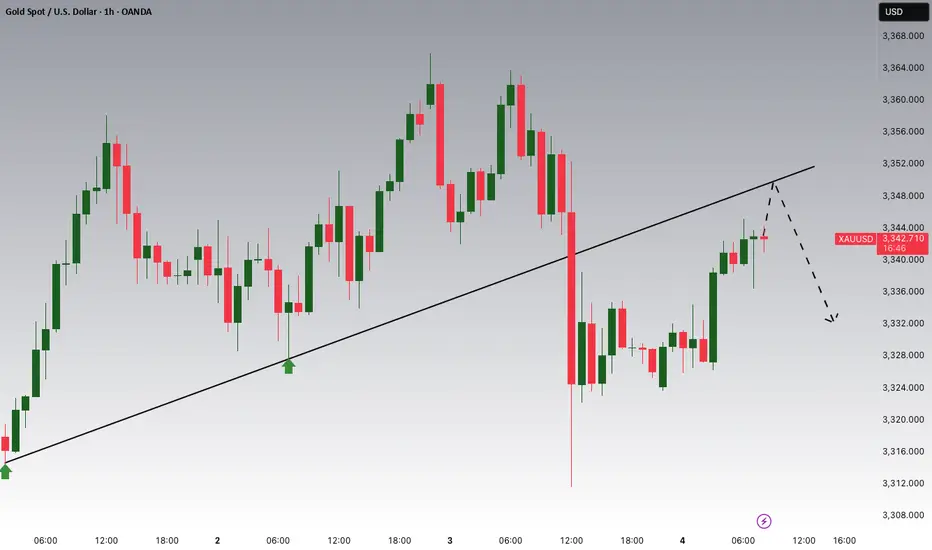
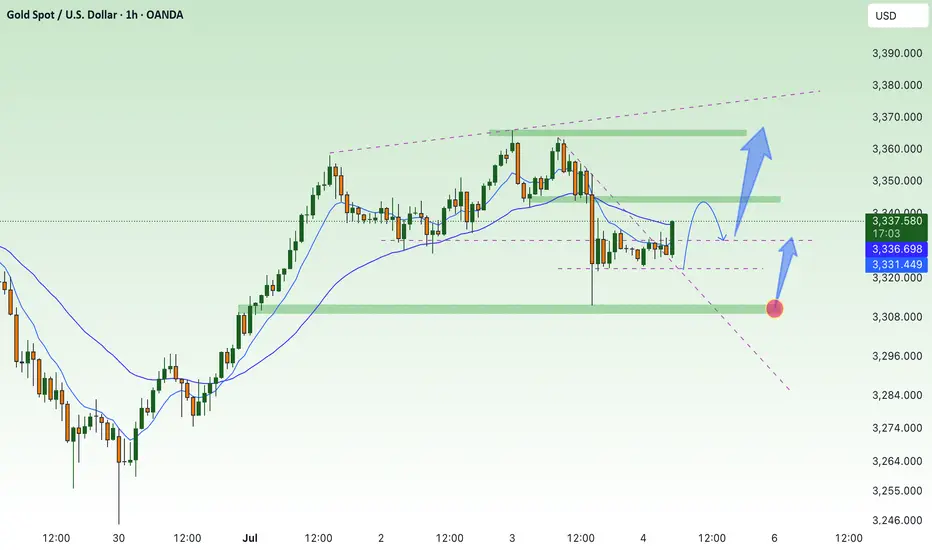
Gold on upswing as expectedAs discussed throughout my yesterday's session commentary: "My position: Since #3,337.80 was neckline for upside Bull structure, I was aware if it gets invalidated to the downside, it will open doors for #3,327.80 extension (which held twice throughout late U.S. and Asian session). I don't expect much Selling action today however Bulls need another Fundamental push to invalidate wall of Resistances at #3,340's and #3,350's. I will continue Scalping as opportunity arise / no Swing orders."
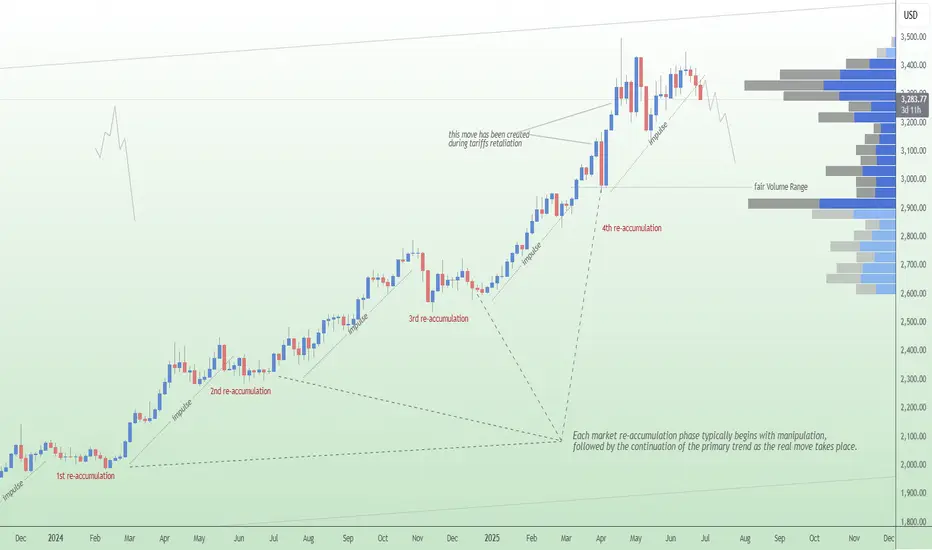
I have expected Gold to test upside extension where I Bought (Scalp of course) #3,342.80 twice towards #3,348.80 and re-Sold #3,357.80 - #3,362.80 belt many times (excellent returns). I will await area to be engulfed and only then make my move.
As I am getting many Fundamental inquiries lately: Gold's current almost #2-Year perma-Bull outlook is driven by more than Fundamentals - rising Global debt, Central bank Buying (especially by China), and general declining trust in fiat currencies all play key roles in Gold's perma-Bull stance. It's considered undervalued by some part of my analysis when adjusted for Inflation and Money supply expansion (like #M2 growth). Gold acts as a Long-term hedge against currency devaluation and systemic Risk, especially during Global conflicts or financial crises. Mining costs are also on the rise while new discoveries are declining, which supports Higher future Prices. With ongoing de-Dollarization and interest in Gold-backed digital assets, the Long-term future of Gold looks structurally strong.
My position: Gold is Trading within #3,350's belt which represents crossroads for the Short-term. Either #3,362.80 - #3,368.80 break-out to the upside towards #3,377.80 strong Resistance, or #3,342.80 - #3,352.80 break-out to the downside towards #3,327.80 Support. Current Price-action is ideal for Scalping since I don't expect major movement until tomorrow's NFP numbers.
MULTIPLE TIME FRAME ANALYSIS, gather data to make good decisionsAll the information you need to find a high probability trade are in front of you on the charts so build your trading decisions on 'the facts' of the chart NOT what you think or what you want to happen or even what you heard will happen. If you have enough facts telling you to trade in a certain direction and therefore enough confluence to take a trade, then this is how you will gain consistency in you trading and build confidence. Check out my trade idea!!
tradingview.sweetlogin.com

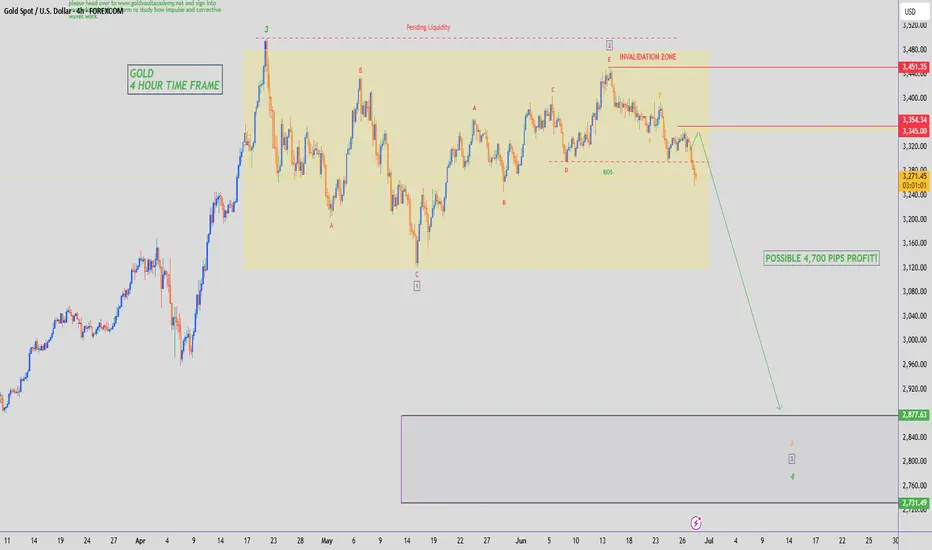
GOLD - SHORT TO $2,800 (UPDATE)Our original sell bias from $3,347 which I posted live for you all, is now running in deep profits! Market is now down & running 810 PIPS in profit in just 2 days.
We have broken structure to the downside, crossing below our previous 'Wave E' low, indicating & acting as stronger confluence that Gold will carry on down towards our $2,800 target. Huge profits en-route for us all in this free channel.
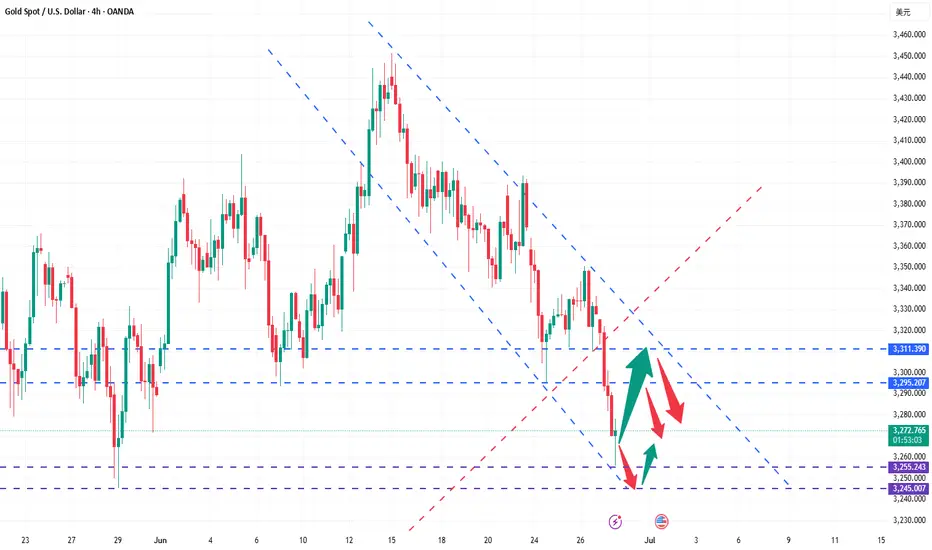
It’s the right time to make a golden layout!Gold opened at 3328 today and started the downward mode. After the European session, it continued to fall and broke the new low. The negative opening data of the US session also continued the downward mode. So far, it has reached the lowest point of 3255 and rebounded, but the strength is not very strong. After all, the upper pressure is still very strong. In the short term, we pay attention to the previous low point of 3295-3300, and focus on the upper 3305-3311. Today, the short-term operation of gold is mainly short-selling on rebounds, and long-selling on callbacks is supplemented.
From the 4-hour analysis, the upper short-term resistance is around 3295-3300, with focus on the important suppression at 3305-3311. The rebound will continue to be mainly short and look to fall back. The lower short-term support is around 3255-3245. Relying on this range as a whole, the main tone of high-altitude and low-multiple participation remains unchanged.
Gold operation strategy:
1. Short-selling in batches near the rebound of gold near 3295-3310, with a target of 3380-3370.
2. When gold falls back to around 3345-3455, go long in batches, with the target at 3370-3380.
Gold strategy analysis for next week, hope it helps youThe current gold price stands at $3,273, showing a significant decline from previous levels. Looking back at Friday's trading, the gold market was in a state of "unrelenting decline": during the early Asian session, gold attempted a rebound, edging up to around $3,328, but was quickly met with resistance and pulled back. The downward trend continued into the European session, and with the release of the U.S. May Personal Consumption Expenditures (PCE) price index data during the U.S. session, gold prices fell further, hitting a low of around $3,355. Although there was a small rebound in recovery afterward, it eventually closed near $3,274, forming a large阴线 with a long lower shadow on the daily chart.
**Factors Influencing the Trend**
Market sentiment has reacted strongly to the optimistic agreements reached on trade-related matters, which has significantly boosted risk appetite. Simply put, when people feel the market environment is safe and there are plenty of profit opportunities, they are less willing to park their money in safe-haven assets like gold, thus greatly reducing gold’s appeal as a safe haven.
**Technical Analysis**
- **Daily Chart**: Gold has broken below the 5-day moving average, and short-term moving averages have formed a "bearish alignment"—it’s like a group of friends who were originally running in the same direction suddenly all turned around and started running downward.
- **4-Hour Chart**: The Bollinger Bands have widened, and gold prices are like being pushed by a force, moving steadily downward along the lower band. The previous top-bottom conversion level at around $3,310 is crucial. If gold fails to reclaim this level next week, it will be like losing an important position in a battle, which will intensify short-term selling pressure and make it highly likely that the downward trend continues.
**Outlook for Next Week**
The market will be bustling next week:
- Major central bank governors worldwide will hold a panel discussion, like a gathering of "financial giants" to discuss important matters. Their remarks and consensus may have a significant impact on the market.
- The non-farm payroll data, long known as a "heavyweight bomb" in financial markets, will also be released. It reflects the state of the U.S. job market, which is closely linked to the economy and monetary policy, so its release often triggers sharp market fluctuations.
- Additionally, talks about whether Powell will resign may continue to ferment next week, stirring up the market.
Affected by these major events, gold prices are expected to fluctuate more violently around the lower Bollinger Band at $3,270 per ounce next week, and there is a need to be cautious of a second dip.
**Comprehensive Judgment**
The gold market faces high uncertainty next week, but the probability of an overall bearish trend is relatively high:
- **Upper Resistance**: Pay attention to the $3,310–$3,300 range in the short term, a key boundary between bulls and bears. A breakthrough here could bring a turnaround for gold.
- **Lower Support**: Focus on the $3,250 level in the short term. A break below this level may open up further downside space.
From the indicator signals:
- The MACD double line is running below the zero axis, forming a death cross, and the green energy column is continuing to expand—like a car stepping on the gas, accelerating downward.
- The RSI is operating in the oversold region around 39. Although there is a possibility of a short-term bottom, it also faces a pullback correction. However, the bearish momentum currently holds the upper hand.
Gold strategy analysis for next week, hope it helps you
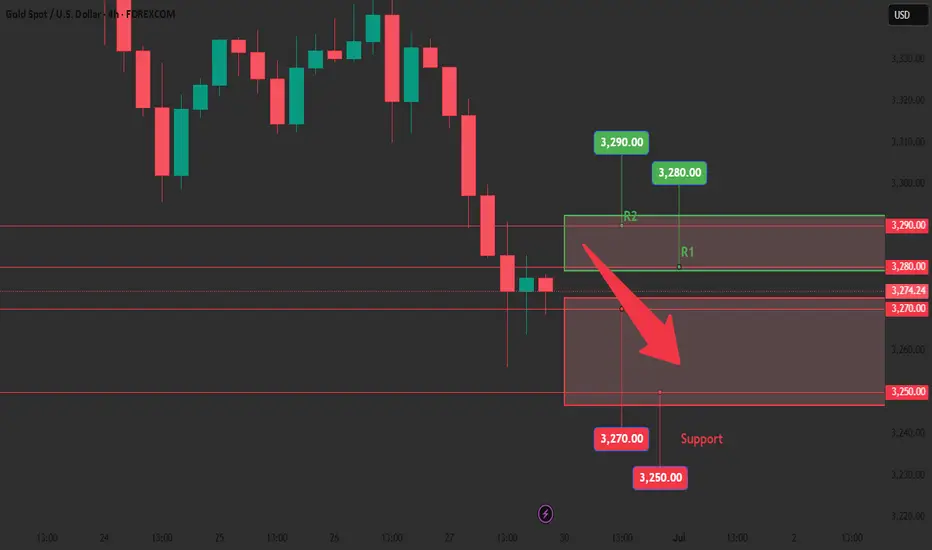
XAUUSD sell@3290~3280
SL:3310
TP:3370~3350
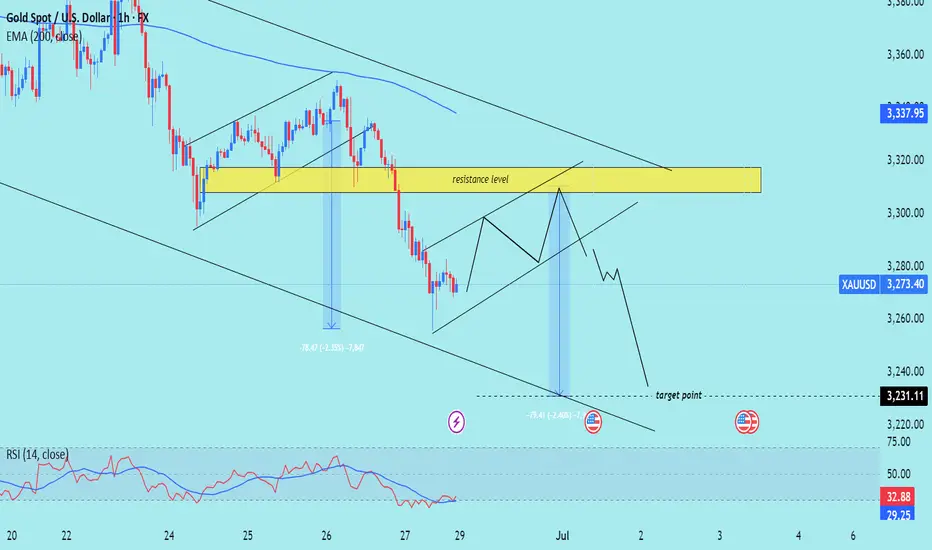
XAU/USD) bearish Trand analysis Read The captionSMC trading point update
Technical analysis of (XAU/USD) on a short-term timeframe, incorporating several key tools and concepts:
---
Overview of the Analysis
Price Level (Current): Around $3,273.40
EMA 200 (Blue Line): Around $3,337.95 (signaling broader trend)
Resistance Zone (Yellow Box): Between approximately $3,300–$3,320
Support/Target Zone: Around $3,231.11
RSI (Relative Strength Index): At 32.88, which is near oversold territory (below 30)
---
Interpretation of Chart Structure
1. Descending Channel:
Price is moving within a downward-sloping channel.
Suggests a bearish trend is in play.
2. Resistance Level (Yellow Box):
Price is expected to retest this area and face resistance.
Confluence of a supply zone and upper trendline, reinforcing its strength.
3. Projected Price Action:
Price may climb back up into the resistance zone.
A rejection is anticipated, leading to another leg down.
The target is around $3,231.11, which matches previous measured moves.
4. Measured Moves (Blue Arrows):
Highlights historical price drops of ~79 points.
Repeating this pattern suggests symmetry and continuation.
5. RSI Indicator:
Currently at 32.88: nearing oversold, but not quite.
No clear bullish divergence, so price could drop further.
---
Trade Idea Summary
Bias: Bearish
Entry Zone: Near $3,300–$3,320 (resistance)
Target: Around $3,231.11
Invalidation: If price breaks and holds above $3,337–$3,340 (EMA 200 and channel breakout)
Mr SMC Trading point
---
Caution/Considerations
Watch for false breakouts above the resistance zone.
Monitor RSI for potential bullish divergence that could invalidate the downside.
Be cautious around the U.S. economic news event icon, which might cause volatility.
plesse support boost 🚀 this analysis)
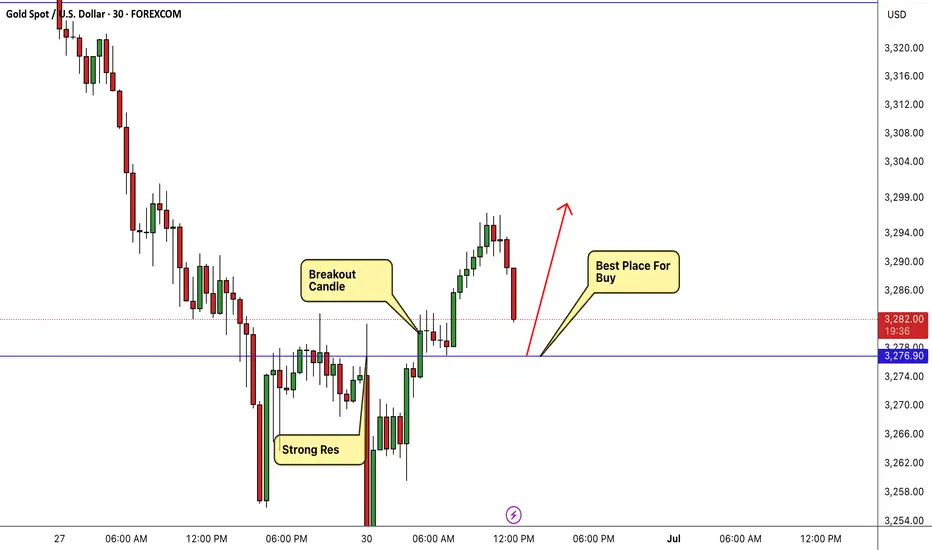
GOLD Breakout Done Let`s Buy It To Get Clear 200 Pips !Here is my opinion on 30 mins T.F , We have a very good bullish price action and we have a very good breakout with amazing bullish candle and now the price back to retest the breakout area , it`s my fav place to enter a buy trade and the price can move 200 Pips easy , i`m waiting for retest and good bullish price action to enter a buy trade .
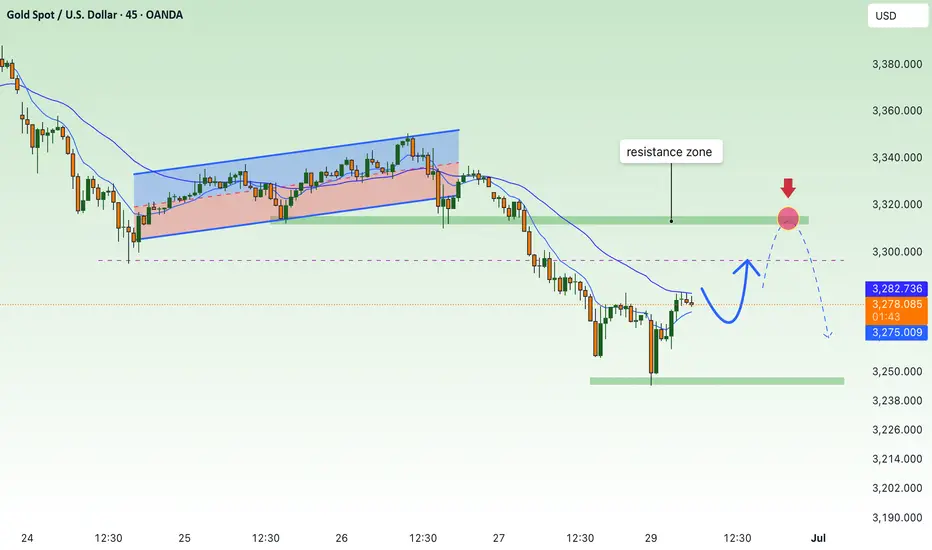
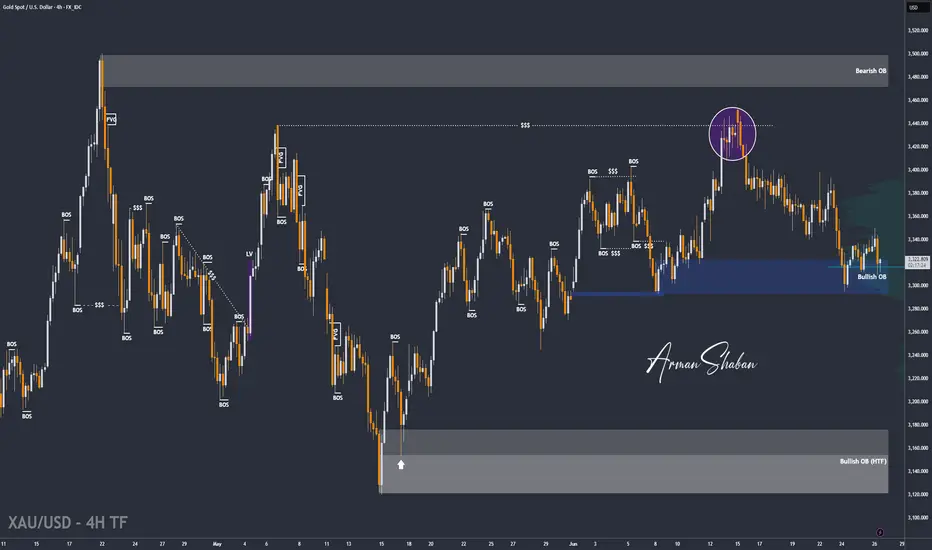
Gold Pullback Into Demand – Is Another Bullish Leg Coming?By analyzing the gold chart on the 4-hour timeframe, we can see that, as expected, price began to rise from the $3323 area and reached up to $3350. After this move, gold experienced a minor correction down to $3310, which aligns with a key demand zone.
Currently, gold is trading around $3322, and if price holds above $3313, we can expect another bullish move with $3333 as the first target and $3350 as the second.
This outlook will be invalidated if price closes below $3309.
Please support me with your likes and comments to motivate me to share more analysis with you and share your opinion about the possible trend of this chart with me !
Best Regards , Arman Shaban
GOLD GOLD is having RESISTANCE FROM EMA 4HR and the break of a demand floor retest at 3335-3337 zone made selling of gold possible at 3335-3337 .
and the demand floor floor remains 3311 -3314 another broken descending trend line that retested on Non-farm data at 3311 ,if this level is broken sell till 3300 and below .
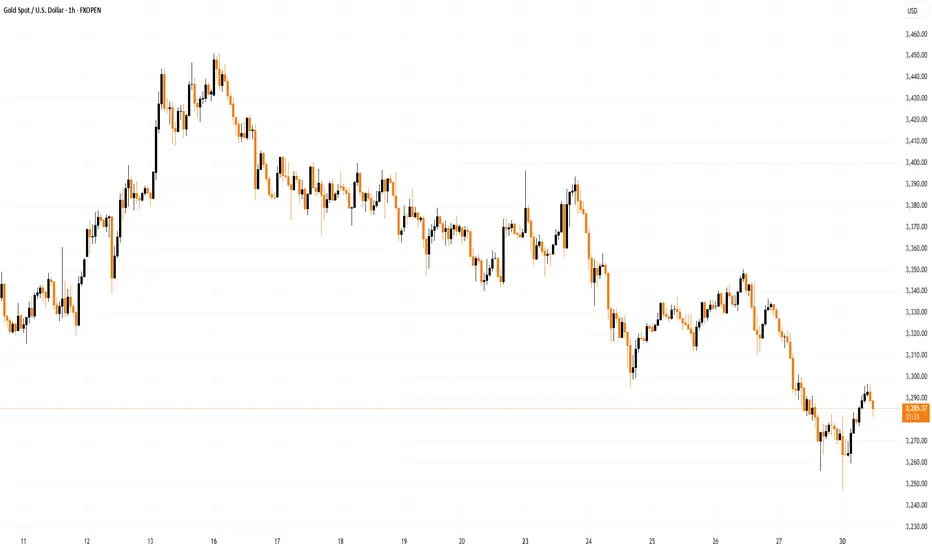
Market Analysis: Gold Drops — Traders Eye Macro TriggersMarket Analysis: Gold Drops — Traders Eye Macro Triggers
Gold price started a fresh decline below $3,320.
Important Takeaways for Gold Oil Price Analysis Today
- Gold price climbed higher toward the $3,400 zone before there was a sharp decline against the US Dollar.
- A key bearish trend line is forming with resistance near $3,300 on the hourly chart of gold at FXOpen.
Technical Analysis of Gold Price
On the hourly chart of Gold at FXOpen, the price climbed above the $3,320 resistance. The price even spiked above $3,350 before the bears appeared.
A high was formed near $3,395 before there was a fresh decline. There was a move below the $3,350 support level. The bears even pushed the price below the $3,300 support and the 50-hour simple moving average.
It tested the $3,245 zone. A low is formed near $3,247 and the price is now showing bearish signs. There was a minor recovery wave toward the 23.6% Fib retracement level of the downward move from the $3,393 swing high to the $3,247 low.
However, the bears are active below $3,300. Immediate resistance is near $3,280. The next major resistance is near the $3,300 zone. There is also a key bearish trend line forming with resistance near $3,300.
The main resistance could be $3,320 or the 50% Fib retracement level, above which the price could test the $3,350 resistance. The next major resistance is $3,395.
An upside break above the $3,395 resistance could send Gold price toward $3,420. Any more gains may perhaps set the pace for an increase toward the $3,450 level.
Initial support on the downside is near the $3,245 level. The first major support is near the $3,220 level. If there is a downside break below the $3,220 support, the price might decline further. In the stated case, the price might drop toward the $3,200 support.
This article represents the opinion of the Companies operating under the FXOpen brand only. It is not to be construed as an offer, solicitation, or recommendation with respect to products and services provided by the Companies operating under the FXOpen brand, nor is it to be considered financial advice.
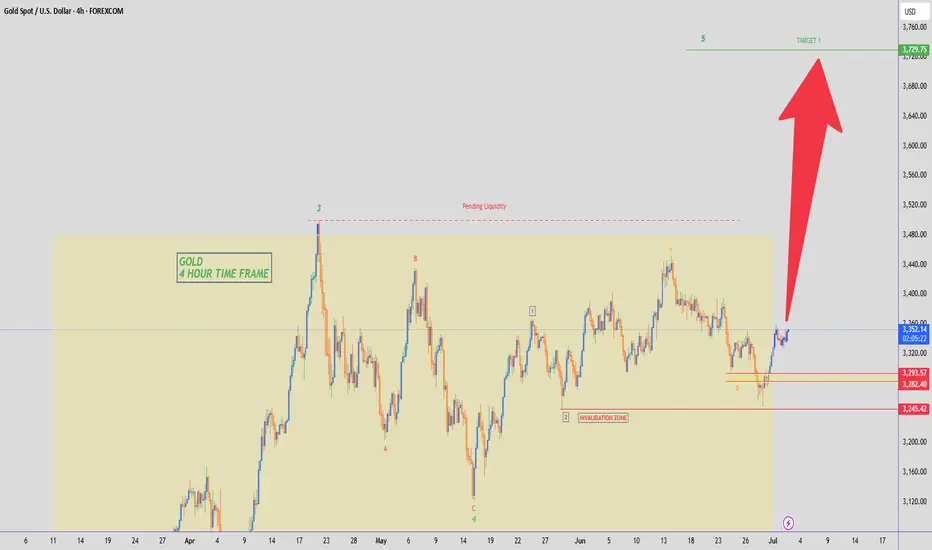
GOLD - WAVE 5 BULLISH TO $3,734 (UPDATE)While we currently hold a bearish bias, let's not forget what I said on this previous 'bullish bias' post. I said Gold bullish structure is only invalidated AFTER we see price go BELOW $3,245. Price came very close to our 'Wave 2 low' but did not surpass it.
Just keep an eye out & always be prepared.