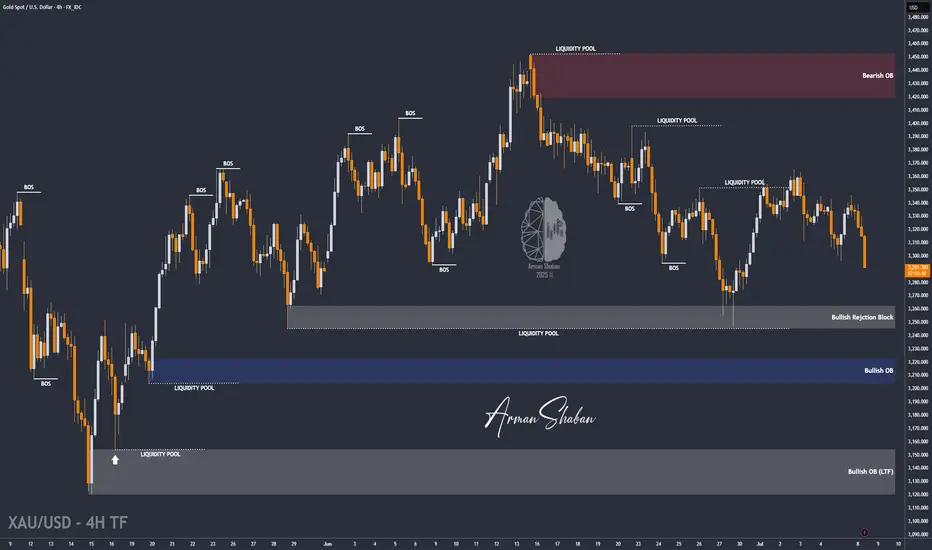
Lingrid | GOLD Weekly Analysis: Consolidation Within UptrendOANDA:XAUUSD market remain trapped in volatile sideways action within a broad consolidation range, following the recent strong rally. Despite the current noisy price behavior, the underlying longer-term bullish momentum remains intact.
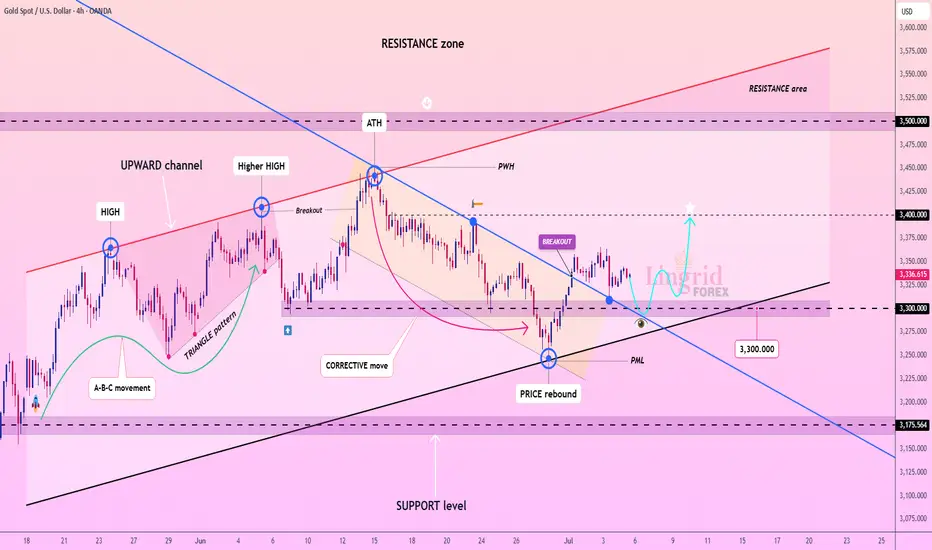
Higher timeframe reveals critical technical levels, with gold testing the resistance zone around after breaking above the upward channel. The triangle pattern breakout suggests potential for higher targets, though the market is currently experiencing a corrective pullback near the $3,300 support level. The presence of multiple resistance tests indicates strong institutional interest at these elevated levels.
The 4H chart provides broader context, showing the A-B-C corrective structure from the June highs. The market appears to be forming a potential ascending triangle pattern, with the June high serving as key resistance. The current consolidation between the June high and low suggests accumulation before the next directional move.
Key levels to watch include the $3,300 support zone and the $3,400 resistance area. A decisive break above resistance could trigger another leg higher toward $3,500, while failure to hold support might see a retest of the $3,200 level. The overall structure suggests this consolidation is part of a larger bullish continuation pattern.
If this idea resonates with you or you have your own opinion, traders, hit the comments. I’m excited to read your thoughts!
XAUUSD trade ideas
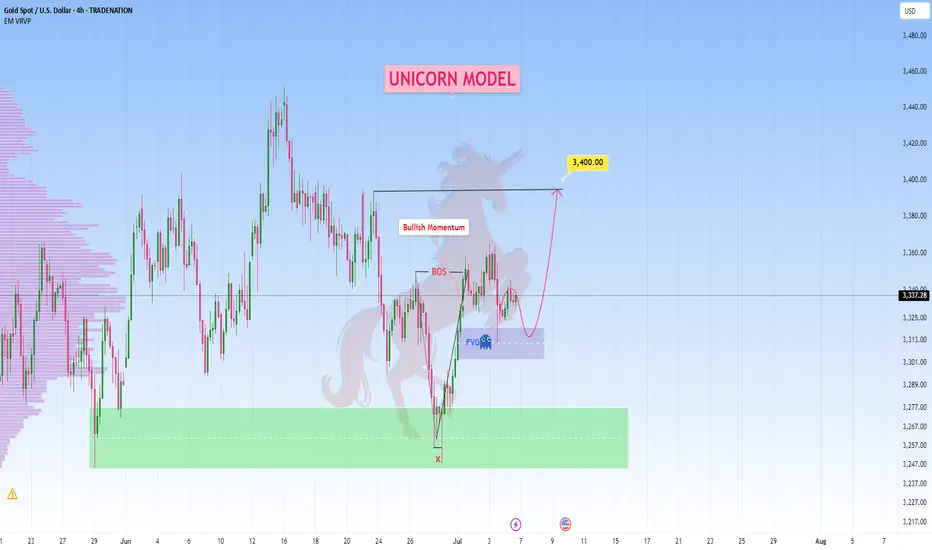
The Unicorn Model: : Guide to ICT’s Best Standalone setup🦄 The ICT Unicorn: The Most Powerful Setup in ICT
Among all the concepts of ICT, the Unicorn setup stands out as the ultimate precision entry model, it’s confluence perfected. Why? Because it merges two of the most potent ideas in ICT theory: Breaker Blocks and Fair Value Gaps into a single zone.
This combination creates the most high-probability, sniper-level setup in the entire ICT playbook.
Why It’s the Best you think?
Most ICT setups (like simple FVGs, order blocks, or liquidity sweeps) offer high-probability trades on their own, but the Unicorn setup stacks the odds in your favor by combining multiple layers of confirmation. This makes it the most disciplined and rewarding entry model for traders who rely on market structure.
Core Concepts Explained
A breaker block is a former order block that gets invalidated when price breaks structure, then acts as support or resistance upon a retest. It’s a sign of a shift in market intent, from bullish to bearish or vice versa.
A fair value gap (FVG) is a three-candle pattern where a sudden price move creates an imbalance, a "gap" between the wicks of the first and third candle. Price often retraces into that gap before continuing its trend.
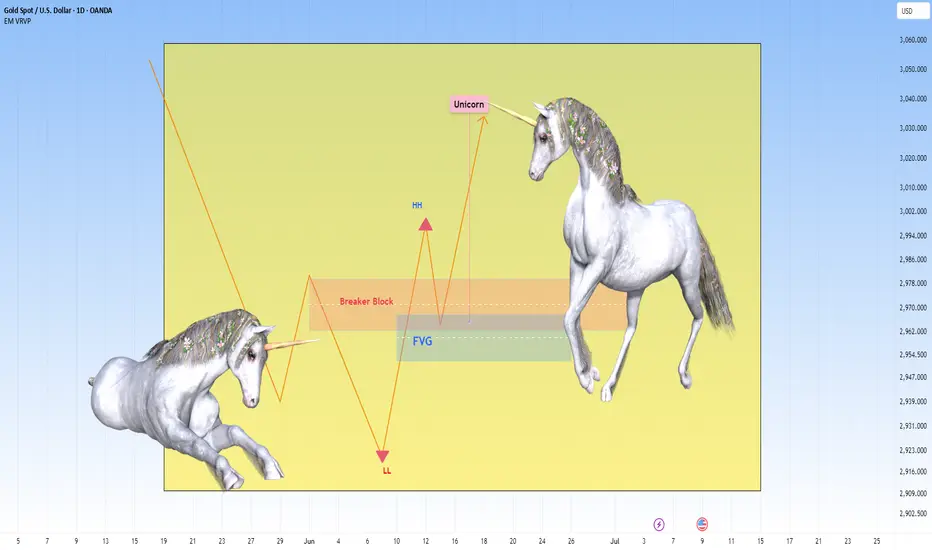
When these two concepts overlap, a breaker block and a fair value gap in the same zone, it forms the “unicorn” setup. It suggests a strong level where liquidity has been taken and institutions may re-enter.
How the Setup Work s
First, you identify a market structure shift, like a break in a previous high or low. Then look for the breaker block left behind by that move. Within that block, check if there’s a fair value gap (the imbalance zone). When price retraces back into that confluence zone, wait for a reaction, often a strong reversal or continuation.
Entry is usually taken when price shows rejection within the zone on a lower timeframe. Your stop-loss goes just beyond the breaker block, and your target can be the next high/low or a logical liquidity pool.
Example of a bearish Unicorn Model:
Best Conditions to Use It
This setup works best when used in line with the higher timeframe trend. Many traders analyze structure on the 1-hour or 4-hour chart, then drop to 5-minute or 15-minute charts to enter. It’s commonly used in forex and indices but also works well in crypto or commodities.
Avoid using it during news events though. Like all ICT concepts, it requires patience and practice to identify clean setups and avoid forcing trades.
Example spotted on a Gold setup:
ICT Unicorn Model was first introduced in 2022, primarily applied to the Nasdaq 100 (NQ) and S&P 500 (ES). What stood out immediately was its precision, the kind of clean structure and consistency you don’t often find in most strategies.
As it was tested further, it was clear this wasn’t just for indices. The model transitioned beautifully into forex, especially on major pairs like GBP/USD and EUR/USD, delivering sharp entries as well.
I also tested it on metals like gold (XAU/USD) and silver (XAG/USD), as well as the Dollar Index (DXY), and the results spoke for themselves. Even in crypto, where volatility is the norm, the Unicorn setup held its ground.
It’s rare to find a trading model that adapts across markets this well.
Final Thoughts
The ICT Unicorn is all about confluence and precision. You’re not trading every breaker or every FVG, only the ones that align, especially with a clean shift in structure. When used with proper risk management, it can be a high-probability setup in your playbook.
How to use Session Profiles for Day TradingHey whats up traders, in reveal cheat code for day trading by using session profiles. It's powerful concept. If correctly applied with HTF trend it will allows you to join running train path the right time.
Dont forget to follow me. I release such articles every Monday.
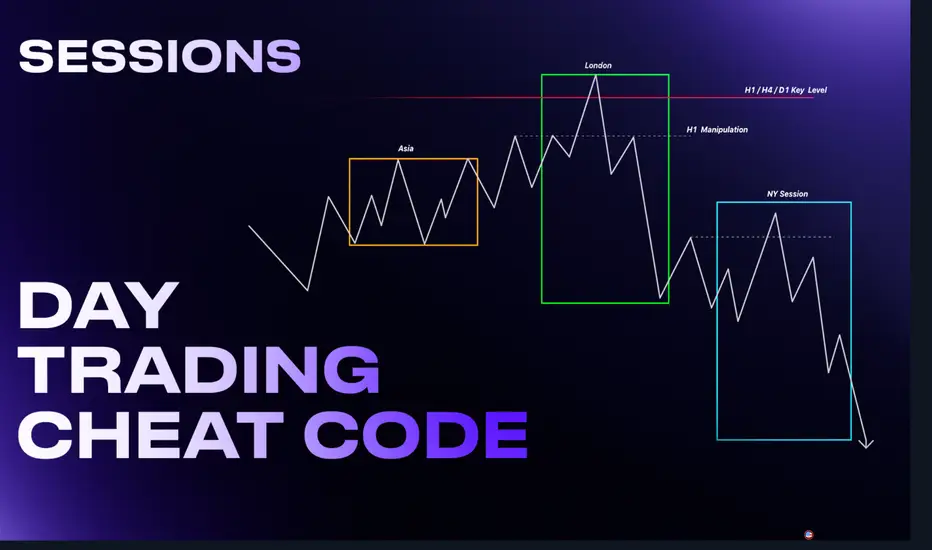
🧠 What Are Session Profiles?
A session profile describes the typical price structure and narrative during a market session — from open → high/low → close.
In Forex, we focus on:
• Asian Session
• London Session
• New York Session
Each session can act as either a reversal or continuation of the previous session(s).
📈 Why They Work
Markets are engineered to:
• Run stops (above highs or below lows)
• Fill inefficiencies (fair value gaps or imbalances)
CLS prefer to move price during specific times — the active hours around session opens. This is where liquidity is high and slippage is minimal, making it ideal for executing large orders.
So, session profiles help us map out when and where these manipulations are most likely to happen.
✅ Why You Should Use Them
Session profiles help you:
• Avoid low-probability trades in dead sessions
• Focus on high-probability narratives
• Anchor your execution models to context
But remember: they are not an entry model. You still need:
• A higher timeframe bias
• A mechanical entry model
• A system for risk and trade management
🔁 How to Use Session Profiles
Use the previous session(s) to anticipate the next one.
• For London session → analyze the Asian session
• For New York session → analyze Asian + London sessions
You’re looking for:
1. Manipulations into key levels
2. Displacement (price moves away strongly)
3. Change in order flow (e.g. OB,on M5 ,15 or H1)
4. Remaining liquidity targets (draw on liquidity)
📊 Session Profile Types with Chart Logic
1. 🔄 London Continuation Profile
Conditions:
• Asia session already made a manipulation into a key level
• Price displaced away from that level
• CIOD / OB on M15 or H1 before London open
Example:
• H1: Asia runs stops above H1 high into a fair value gap (key level)
• Displacement confirms intent
• At London open, price retraces into M15 premium (PD array) and continues in the same direction
Invalidation: the manipulation high/low from Asia session
Narrative: Asia did the manipulation → London does the continuation.
2. 🔁 London Reversal Profile
Conditions:
• Asia session consolidates near a higher timeframe key level
• London open initiates the manipulation into the key level
• Displacement + M15 BOS after manipulation
Example:
• H1: Asia consolidates under daily FVG
• London opens, price runs Asia high into that FVG
• M15 breaks down → clean short setup
• Target: higher timeframe draw on liquidity (e.g., previous day low)
Invalidation: the London session high (manipulation point)
Narrative: London performs the manipulation → price reverses.
3. 🔄 New York Continuation Profile
Conditions:
• Asia + London already created a clear manipulation and displacement
• London has not reached the final draw on liquidity
• London is not overextended (e.g., <70 pips move)
• New York opens with structure intact for continuation
Example:
• H1: London makes a reversal from a key level and displaces lower
• Draw on liquidity (e.g., previous day low) still untouched
• NY opens and continues the sell-off, retracing briefly into M15 imbalance before expanding lower
Invalidation: manipulation level from London
Narrative: London set the direction → NY finishes the move.
4. 🔁 New York Reversal Profile
Conditions:
• No clear London profile (no key level touched, no strong CHoCH)
• NY opens and manipulates into a key level (e.g., daily OB, FVG)
• Clear M15 or H1 CHoCH or BOS confirming reversal
• Asia + London lows still intact (liquidity available below)
Example:
• H1: No strong setup in London
• NY opens, price spikes into daily OB and takes out London highs
• M15 structure shifts → sell targeting London + Asia lows
Invalidation: NY session manipulation high
Narrative: London was noise → NY takes control and reverses.
🔁 Visual Structure Flow
Before applying any session profile, confirm:
1. High-probability trading conditions (e.g., key level proximity, market open, liquidity available, Red News)
2. Bias in place (HTF (D1 and Weekly direction must be known)
Then:
→ Check for valid session narrative
→ Select the correct session profile
→ Wait for the stop run of H1 / H4
→ Is there enough room for the move to key level
→ If we are still in first half of session you can enter. If its close the end of session skip it.
→ Apply your entry and risk model.
→ Dont be greedy look for 2:1 RR trade and get out.
🔁 How to enter ?
if bearish - You always want enter above H1 I H4 candle after LTF CIOD
If bullish - You always want to enter bellow H1/ H4 after LTF CIOD.
Use Order block to enter the market here is how to identify it correctly
Remember:
Never sell low / Never buy High... wait for stop run / Liquidity sweeps. If you dont know where is the liquidity - you will be liquidity.
Hope this brings clarity to your trading.
Done on the Tradenation Charts
Disclosure: I am part of Trade Nation's Influencer program and receive a monthly fee for using their TradingView charts in my analysis.
"Adapt what is useful, reject what is useless, and add what is specifically your own."
— David Perk aka Dave FX Hunter ⚔️
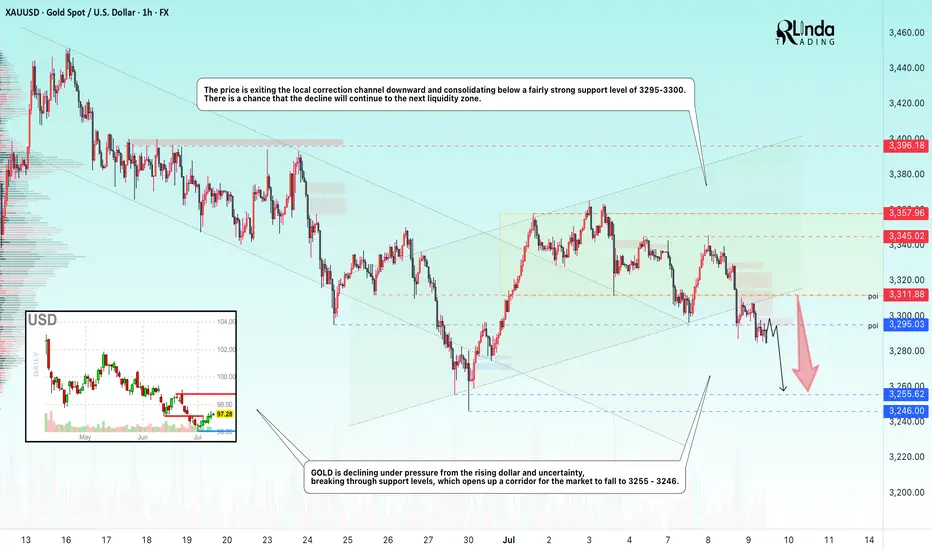
GOLD → Readiness to test the local bottomFX:XAUUSD is under pressure from the rising dollar and uncertainty, breaking through support levels, which opens up a corridor for the market to fall to 3255 - 3246
The price of gold is consolidating around $3300 after falling more than 1% amid expectations of the Fed minutes and news about tariffs.
Investors remain cautious: the dollar is supported by hopes for US trade deals, while the threat of new tariffs from August 1 is holding back gold's growth.
Weak inflation data in China did not support the metal, while expectations that the Fed will not rush to cut rates due to inflationary pressure from tariffs are also limiting interest in gold. Traders are waiting for the Fed minutes and new statements from Trump to determine the further direction.
Technically, the market looks weak (on D1, the price closed below the key level of 3300 on Tuesday) and there is a chance of a further decline.
Resistance levels: 3300, 3311
Support levels: 3295, 3255, 3246
Consolidation below 3295-3300 could trigger a further decline to 3255, from which the market could react with a correction.
Buying can be considered if gold reverses the short scenario, manages to strengthen to 3311, and consolidates above this level. At the moment, the price is in the selling zone...
Best regards, R. Linda!
Lingrid | GOLD selling Opportunity at Resistance ZoneOANDA:XAUUSD recently rebounded from the support level near 3280 and pushed upward into the 3329 resistance zone. However, the price is struggling to break above both the red descending trendline and the horizontal supply zone, suggesting exhaustion of bullish momentum. A lower high formation and rejection from this confluence area signal a likely bearish continuation. If confirmed, price may slide toward 3305, with potential to revisit the 3280 support area.
📉 Key Levels
Sell trigger: rejection from 3330 with bearish confirmation
Sell zone: 3325–3330 (confluence of horizontal and diagonal resistance)
Target: 3305 first, extended to 3282.3
Invalidation: strong hourly close above 3330 breaks bearish structure
💡 Risks
False breakout traps near 3305 may reverse sentiment
Unexpected macro events (CPI, Fed comments) can shift short-term trend
Price bouncing at 3305 before full target reach might attract dip buyers
If this idea resonates with you or you have your own opinion, traders, hit the comments. I’m excited to read your thoughts!
GOLD → Buyers are hesitant due to new tariffsFX:XAUUSD continues its correction phase after updating local highs and breaking through trend resistance. The dollar is making traders nervous...
After rising 2% last week, gold started Monday with a decline to $3,300 amid a stronger dollar due to the risk of new tariffs from Trump, who sent letters to 12 countries threatening to impose duties of up to 70% if no agreements are reached by July 9. This boosted demand for the dollar as a safe-haven asset.
Gold is also under pressure from strong US employment data, which has dampened expectations of a rate cut. The market is focused on news on tariffs and the publication of the Fed minutes on Wednesday, which may clarify the outlook for monetary policy.
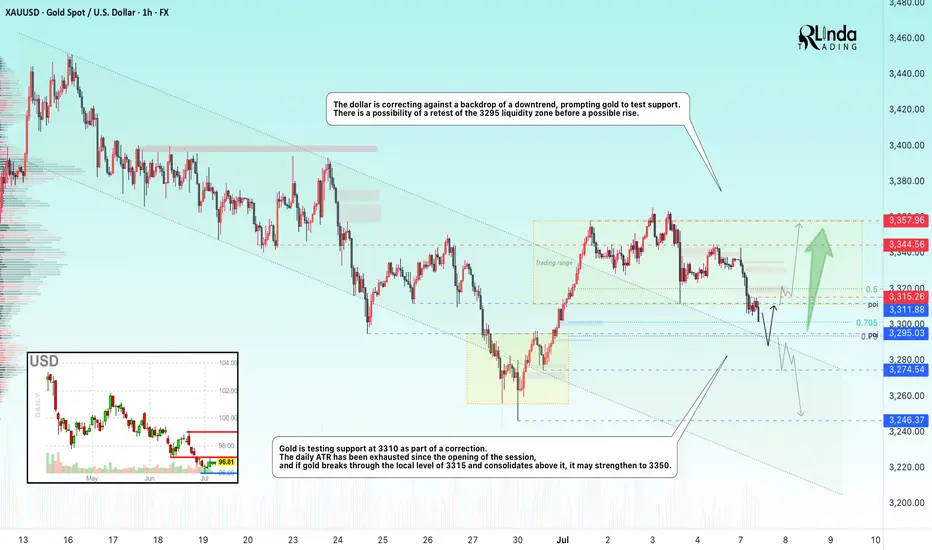
Technically, the correction may end in the 0.7 Fibonacci zone, in the range of 3295-3300. After the formation of a reversal pattern, the market may strengthen to 3350-3360.
Resistance levels: 3315, 3344, 3358
Support levels: 3300, 3295
Locally, the price is trying to consolidate below the range, which could lead to a decline to 3300-3295. If, during the correction from support, the market manages to consolidate above 3315, we can expect growth. Otherwise, a weak reaction at 3295 could lead to a retest of 3275 and consolidation in the selling zone, which could lead to a further decline to 3245 .
BUT! We are closely monitoring the position of the US and Trump on tariffs, as he is once again issuing ultimatums to countries, to which the markets are reacting...
Best regards, R. Linda!
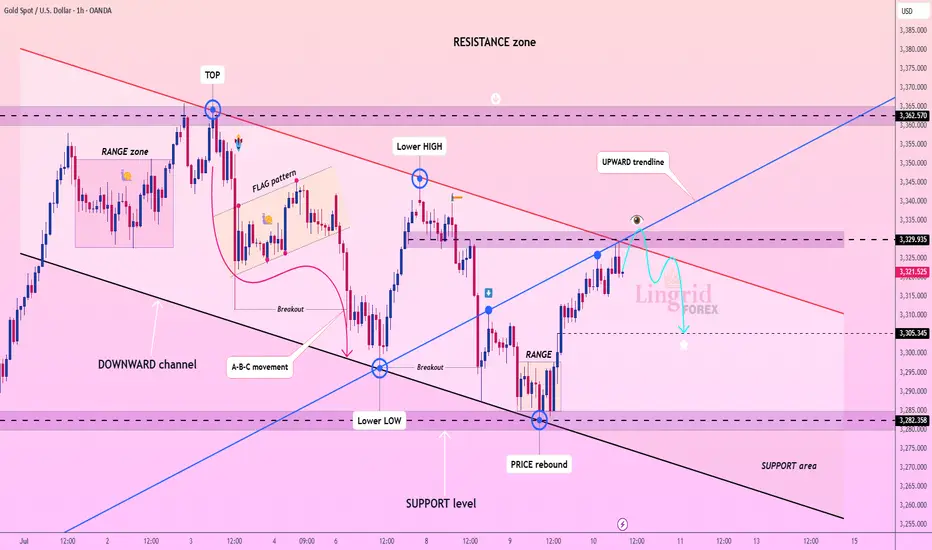
GOLD → Retest of consolidation resistance. Breakout?FX:XAUUSD is consolidating in a symmetrical triangle pattern. The price is stabilizing amid a falling dollar and uncertainty...
Gold is recovering after falling to $3,283 thanks to a weaker dollar and lower bond yields amid concerns over Trump's new tariff threats. The announced tariffs against seven countries, including Brazil and the Philippines, have heightened tensions, partially offsetting the Fed's hawkish signals. Markets are now awaiting new data from the US and speeches by Fed officials, which could influence the further dynamics of gold.
Technically, gold is squeezed between the resistance and support of a symmetrical triangle. The price is being aggressively pushed away from support within a bullish trend, but at the same time, gold is testing resistance for the fifth time, which only increases the chances of a breakout.
Resistance levels: 3330, 3345, 3358
Support levels: 3308, 3295
If gold continues to storm the local resistance at 3330 and the triangle resistance during consolidation, we will have a good chance of catching the breakout and growth. An additional scenario could be growth after a shake-up of the triangle support and the global trend.
Best regards, R. Linda!
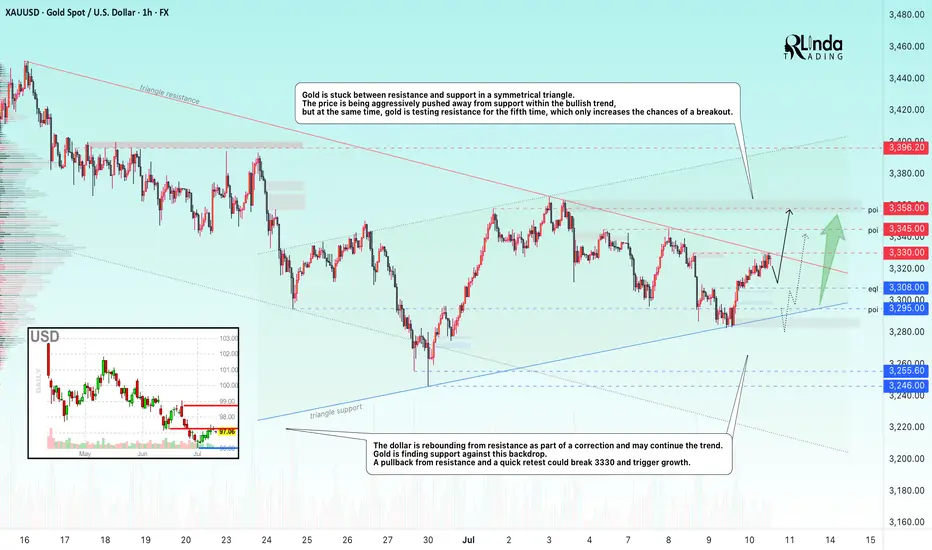
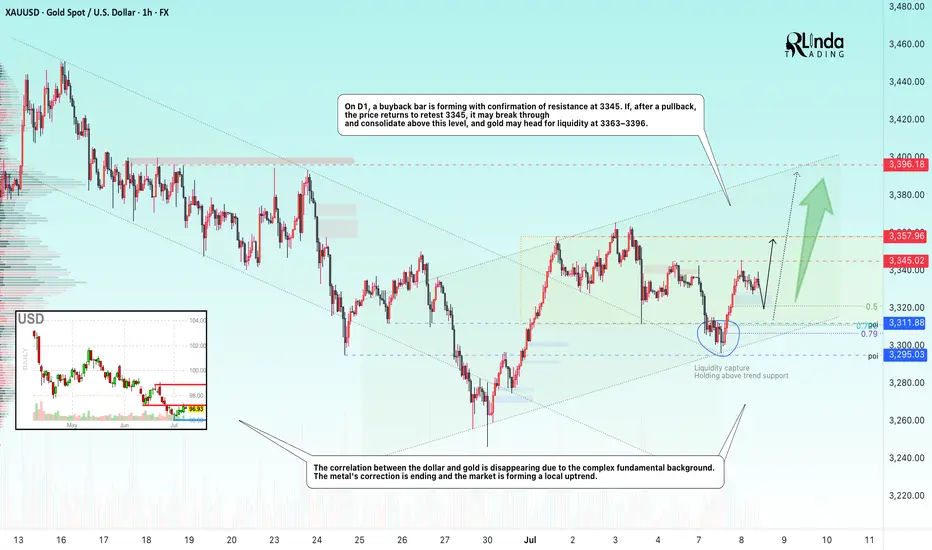
GOLD → Correction for confirmation before growthFX:XAUUSD is recovering due to increased demand as a safe-haven asset. After breaking through local trend resistance, an upward channel is beginning to form on the chart.
On Monday, gold tested the 3295-3300 zone (liquidity zone) and, against the backdrop of incoming economic data, is buying back the decline, forming a rather interesting pattern that could lead to continued growth, but there is a but!
Investors are reacting to President Trump's threats to impose tariffs on imports from a dozen countries starting August 1. In addition, the main question is the Fed's interest rate decision. The regulator is likely to leave the rate unchanged due to inflation risks.
Uncertainty surrounding tariffs is supporting interest in gold as a safe-haven asset. The market is awaiting further news and the publication of the Fed minutes on Wednesday.
Resistance levels: 3345, 3357, 3396
Support levels: 3320, 3311, 3295
A correction to support is forming. If the bulls hold their ground within the upward channel and above the key areas of interest, the focus will shift to 3345, a resistance level that could hold the market back from a possible rise. A breakout of this zone would trigger a rise to 3357-3396.
Best regards, R. Linda!
| ICT Unicorn model | The most potent concept spotted on GoldThe Unicorn model is considered by many traders to be one of the most refined and effective concepts within the ICT framework concepts because it brings together several core ideas into one powerful, repeatable setup. But what makes it so highly regarded as one of the best?
It’s the ability to stack multiple high-probability conditions: liquidity grabs, market structure shifts, fair value gaps, and optimal trade entry zones.
Unlike isolated concepts, the Unicorn model doesn’t rely on just one factor. It uses the synergy between time and price → waiting for manipulation first, then entering during the retracement into a fair value gap or order block.
This not only increases accuracy but allows for tight stops and high reward-to-risk ratios. Many traders rely on it exclusively because it’s both structured and versatile, making it easier to apply consistently across various market conditions.
How does this work:
You’ll see the price breaks a swing high, reverses, and creates a Breaker Block (failed order block) with a Fair Value Gap. These overlap to form the “Unicorn zone” → After that, price drops sharply, breaking the previous structure, indicating a shift in market direction → Price retraces, entering the overlapping zone → Traders look for rejections (candlestick patterns, wick spikes) as the entry signal→ With entry near the zone, the stop-loss is placed just beyond the Breaker Block or FVG.
Targets can be the next liquidity levels (e.g., recent lows). Many traders use 2:1 or 3:1 R:R, though targets can be higher.
In other words as a standalone strategy, the Unicorn model is highly effective , if, and only if, you have the correct daily bias. With a clear directional outlook, it becomes a complete and reliable setup.
Which in our case, on Gold it aligns perfectly.
Just sharing my thoughts for the charts, this isn’t financial advice. Always confirm your setups and manage your risk properly.
Disclosure: I am part of Trade Nation's Influencer program and receive a monthly fee for using their TradingView charts in my analysis.
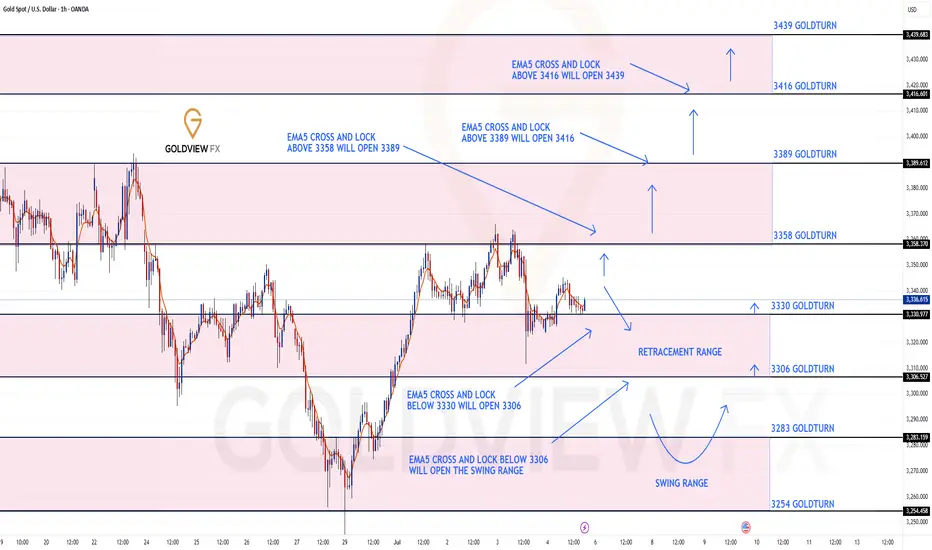
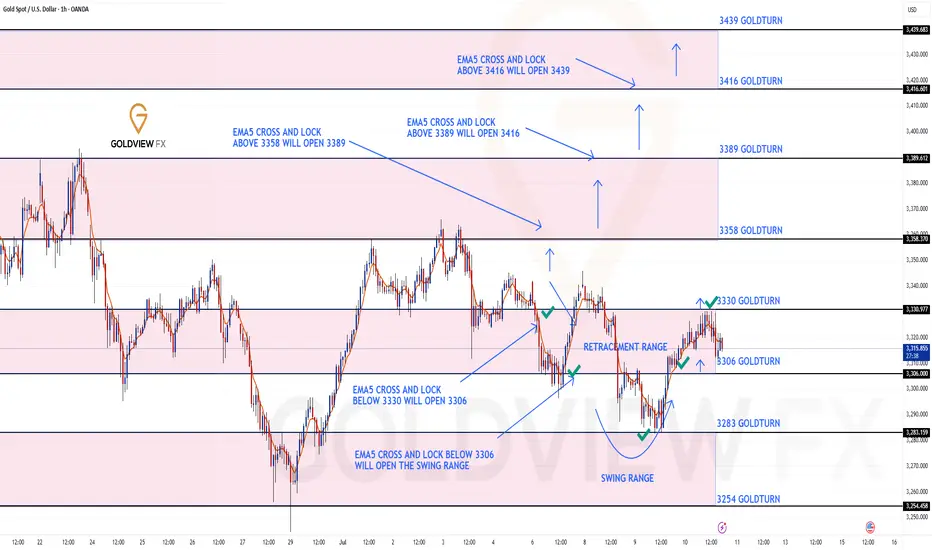
GOLD 1H CHART ROUTE MAP UPDATE & TRADING PLAN FOR THE WEEKHey Everyone,
Please see our updated 1h chart levels and targets for the coming week.
We are seeing price play between two weighted levels with a gap above at 3358 and a gap below at 3330. We will need to see ema5 cross and lock on either weighted level to determine the next range.
We will see levels tested side by side until one of the weighted levels break and lock to confirm direction for the next range.
We will keep the above in mind when taking buys from dips. Our updated levels and weighted levels will allow us to track the movement down and then catch bounces up.
We will continue to buy dips using our support levels taking 20 to 40 pips. As stated before each of our level structures give 20 to 40 pip bounces, which is enough for a nice entry and exit. If you back test the levels we shared every week for the past 24 months, you can see how effectively they were used to trade with or against short/mid term swings and trends.
The swing range give bigger bounces then our weighted levels that's the difference between weighted levels and swing ranges.
BULLISH TARGET
3358
EMA5 CROSS AND LOCK ABOVE 3358 WILL OPEN THE FOLLOWING BULLISH TARGETS
3389
EMA5 CROSS AND LOCK ABOVE 3389 WILL OPEN THE FOLLOWING BULLISH TARGET
3416
EMA5 CROSS AND LOCK ABOVE 3416 WILL OPEN THE FOLLOWING BULLISH TARGET
3439
BEARISH TARGETS
3330
EMA5 CROSS AND LOCK BELOW 3330 WILL OPEN THE FOLLOWING BEARISH TARGET
3306
EMA5 CROSS AND LOCK BELOW 3306 WILL OPEN THE SWING RANGE
3283
3254
As always, we will keep you all updated with regular updates throughout the week and how we manage the active ideas and setups. Thank you all for your likes, comments and follows, we really appreciate it!
Mr Gold
GoldViewFX
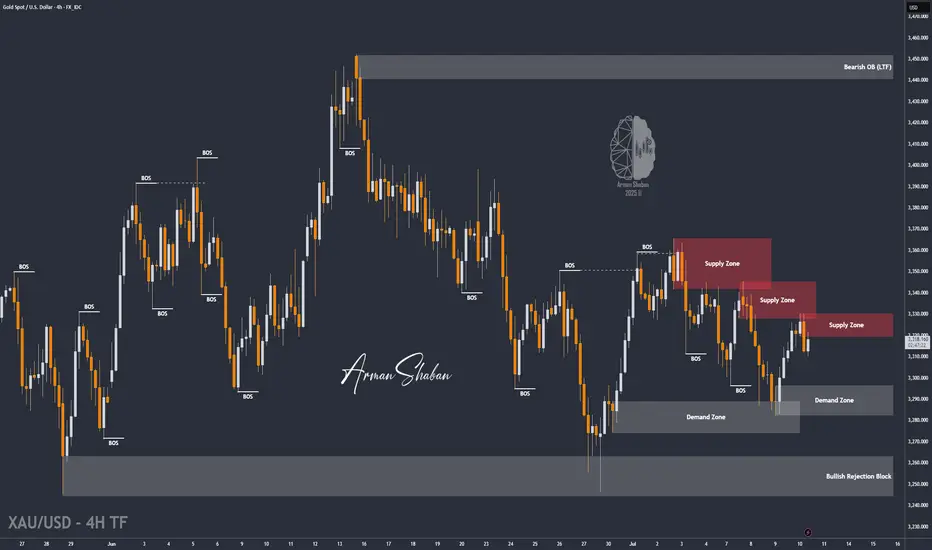
XAU/USD : Gold at a Turning Point – Rejection or Breakout Ahead?By analyzing the TVC:GOLD (XAUUSD) chart on the 4-hour timeframe, we can see that price climbed to $3330 today, entering a key supply zone, which triggered a pullback down to $3310. Gold is now trading around $3317, and I’m watching several potential setups closely.
Scenario 1:
If gold stabilizes below $3320, we could see a bearish move toward $3296.
Scenario 2:
If price breaks above the $3333 resistance, it may enter the next supply zone between $3341 and $3351, which could trigger a strong rejection—potentially offering a 100 to 400 pip move.
Now let’s break down the key levels to watch:
Supply zones: $3320, $3333, $3342, $3358
Demand zones: $3303, $3296, $3289, $3278
Monitor how price reacts to each of these zones — they may provide excellent opportunities.
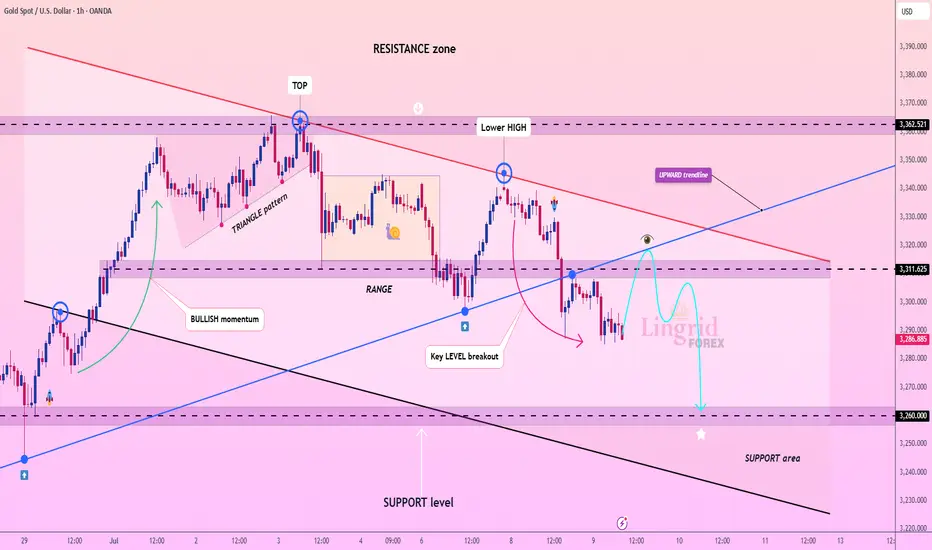
Lingrid | GOLD Major Support Level ViolatedOANDA:XAUUSD has formed a lower high beneath the key resistance at 3,310, showing fading bullish momentum after a breakout failure. Price is trading below the upward trendline and moving toward the 3,260 support zone with a corrective structure. The rejection from the resistance block and breakdown of a key level suggests continued bearish pressure.
📉 Key Levels
Sell trigger: rejection from 3,300–3,330 resistance block
Target: 3,260 key support, followed by 3,240 lower zone
Invalid level: breakout and close above 3,320 regains bullish bias
Resistance zone: 3,310–3,330 acting as a ceiling for upside attempts
⚠️ Risks
Reclaiming 3,310 would shift the bias back to neutral/bullish
Sideways range between 3,260–3,320 could cause fakeouts
Volatility spikes from macroeconomic events may trigger stop hunts
If this idea resonates with you or you have your own opinion, traders, hit the comments. I’m excited to read your thoughts!
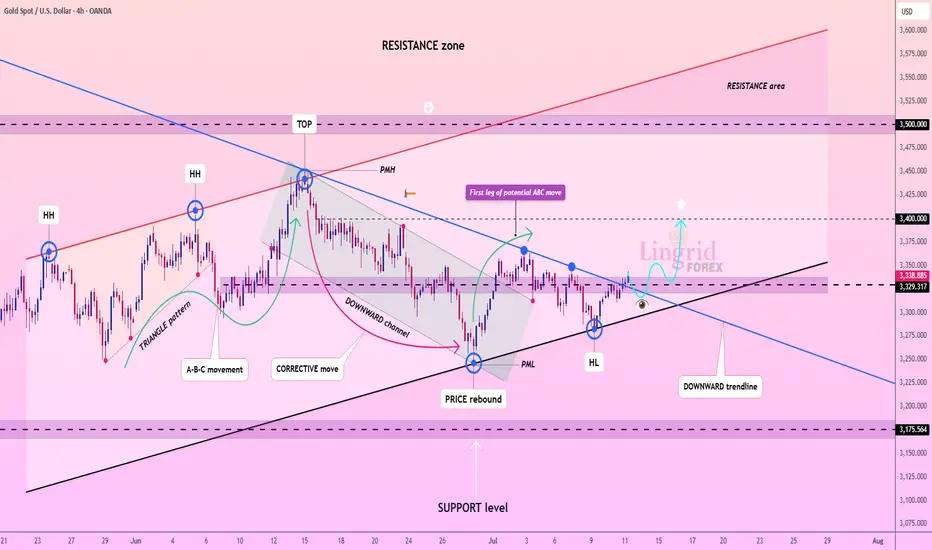
Lingrid | GOLD Potential A-B-C Movement in ProgressOANDA:XAUUSD bounced strongly from the ascending trendline and reclaimed key structure near 3,275, signaling strength after rejecting the prior downward channel. Price has broken above the descending trendline and is now testing the 3,329 resistance zone with bullish momentum. If buyers maintain control above this breakout area, a push toward the 3,400 level becomes increasingly likely. The structure supports a continuation of the bullish leg unless price drops back under 3,275.
📉 Key Levels
Buy trigger: breakout and retest hold above 3,329.3
Buy zone: 3,300–3,329 (breakout + structure support)
Target: 3,400 first, extended toward 3,500
Invalidation: sharp drop below 3,275 negates bullish setup
💡 Risks
False breakout above 3,329 could invite short-term pullback
Rejection at 3,400 may lead to consolidation below resistance
Macro shocks (Fed, CPI) could reverse sentiment abruptly
If this idea resonates with you or you have your own opinion, traders, hit the comments. I’m excited to read your thoughts!
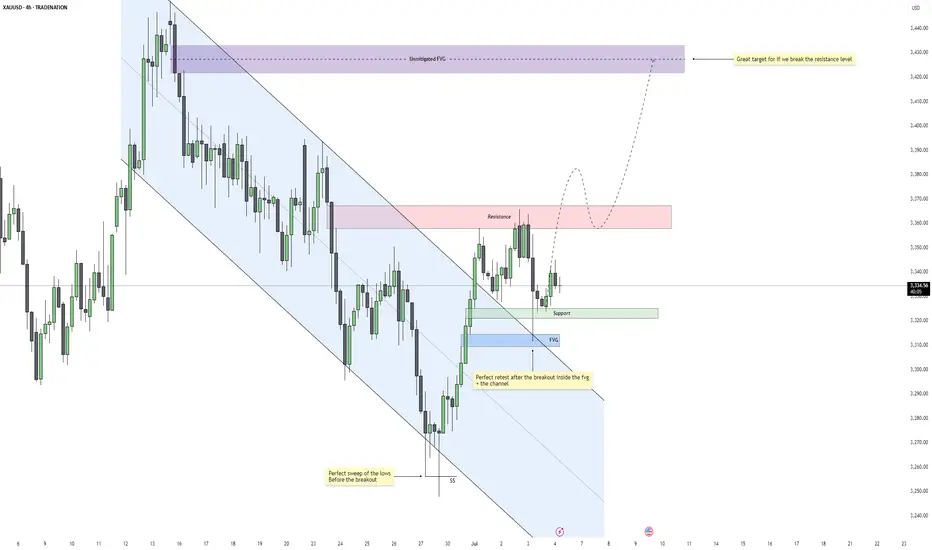
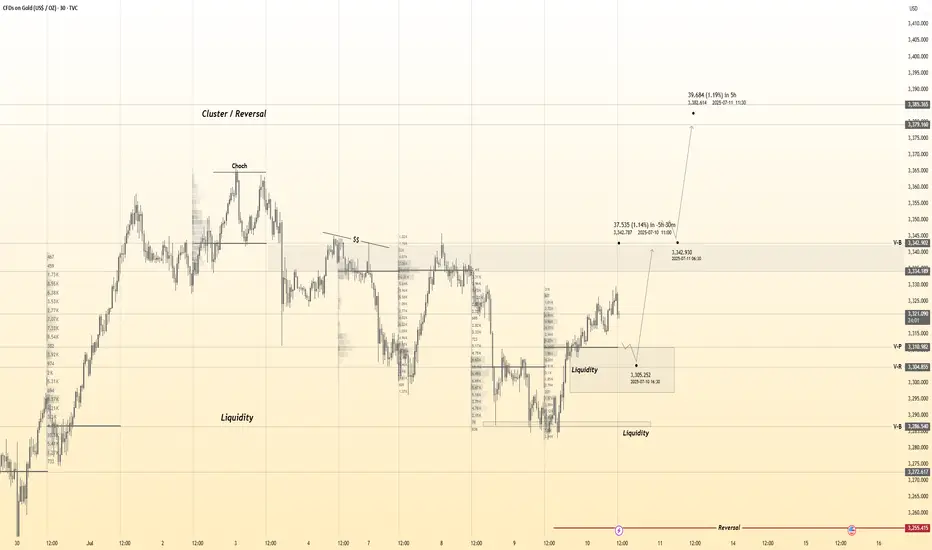
Gold – Is $3430 the Next Target After This Breakout?Gold recently completed a clean sweep of the 4H swing lows, taking out downside liquidity just before breaking out of a well-defined descending channel. This move marked a shift in momentum and structure, suggesting that the bearish leg may have concluded and the market is now transitioning into a more bullish phase.
Breakout Confirmation and Retest Zone
Following the breakout, price retraced and tapped directly into a confluence area where a fair value gap aligns with the upper boundary of the broken channel. This acted as a high-probability retest zone, and the reaction was strong. The market respected this structure perfectly, adding conviction to the breakout's validity.
Support and Resistance Dynamics
Currently, price is hovering between a nearby support level and a short-term resistance zone above. The support is holding firm after the retest, while the resistance is capping upward momentum for now. This is a healthy consolidation following the breakout, and it provides a clear structure for monitoring continuation.
Imbalance Target and Flow Outlook
Should the market gain enough strength to break through the overhead resistance, there is a large unmitigated imbalance further above that stands as a strong magnet. It represents a clean fair value gap left behind during the previous selloff and could be the next major draw if bullish momentum continues.
Overall Flow and Trade Logic
The sequence is very clean: sweep of liquidity, bullish breakout, efficient retest, and now consolidation above support. As long as price continues to form higher lows and respect the current structure, the probability of further upside remains favorable. Patience around the resistance area will be key for confirmation.
Conclusion
Gold is displaying a textbook reversal setup driven by liquidity and structure. If the current support continues to hold and buyers reclaim control above resistance, the path toward the upper imbalance becomes highly probable. The market is aligned for continuation, with bullish momentum building gradually.
Disclosure: I am part of Trade Nation's Influencer program and receive a monthly fee for using their TradingView charts in my analysis.
___________________________________
Thanks for your support!
If you found this idea helpful or learned something new, drop a like 👍 and leave a comment, I’d love to hear your thoughts! 🚀
Setupsfx_ | XAUUSD(Gold):07/07/2025 Update | Gold dropped nicely when the market opened last night, dropping around 600 pips. However, it couldn’t hold on to the gains and came right back to the selling zone. There are two entry points and two potential targets.
Good luck and trade safely!
Team Setupsfx_
Gold 30Min Engaged ( Two Bullish Entry's Detected )Time Frame: 30-Minute Warfare
Entry Protocol: Only after volume-verified breakout
🩸Bullish Reversal 3311 Zone
🩸Bullish Break 3343 Zone
➗ Hanzo Protocol: Volume-Tiered Entry Authority
➕ Zone Activated: Dynamic market pressure detected.
The level isn’t just price — it’s a memory of where they moved size.
Volume is rising beneath the surface — not noise, but preparation.
🔥 Tactical Note:
We wait for the energy signature — when volume betrays intention.
The trap gets set. The weak follow. We execute.
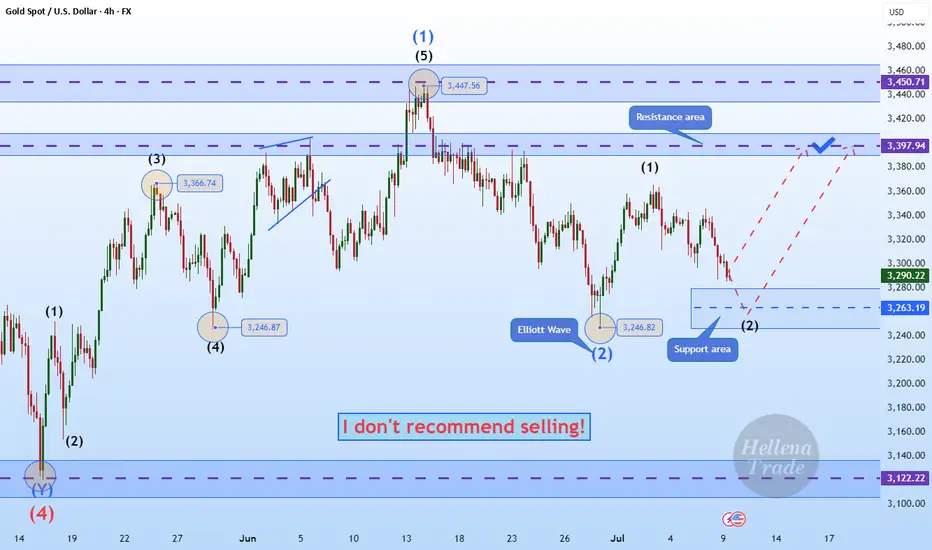
Hellena | GOLD (4H): LONG to resistance area of 3397 (Wave 3).Dear colleagues, my previous forecast remains valid, but I have decided to update it.
At the moment, I still think that wave “3” of the medium order continues its upward movement.
At the moment, I think that the small correction in wave “2” is ending and we will see a continuation of the trend. I see the resistance area of 3397.94 as the target. The main thing is to overcome the local level of the small wave “1” at 3366.37.
Manage your capital correctly and competently! Only enter trades based on reliable patterns!
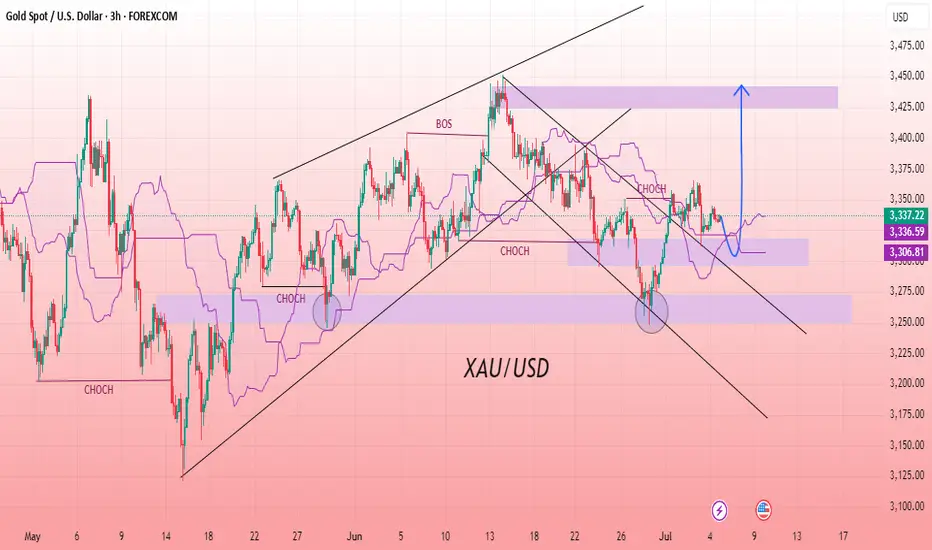
XAU/USD 3H CHART PATTERNOn this XAUUSD 3-hour chart, price has broken out of the descending channel and is retesting near the 3304 area, aligning with a bullish change of character (CHOCH) zone for a potential buy setup. The chart shows a clear upward projection after the retest, targeting a move towards the upper resistance zone around 3440. This setup aligns with market structure respecting previous support zones and aiming for higher highs after a successful breakout. Monitoring the retest area is crucial for confirmation, allowing a low-risk entry for a continuation towards the targets while maintaining clear structure. Price action should be observed for bullish momentum before continuation to the higher resistance levels indicated on the chart for a clean execution.
Entry: 3304
First Target: 3381
Second Target: 3440
Stop Loss: 3390/335
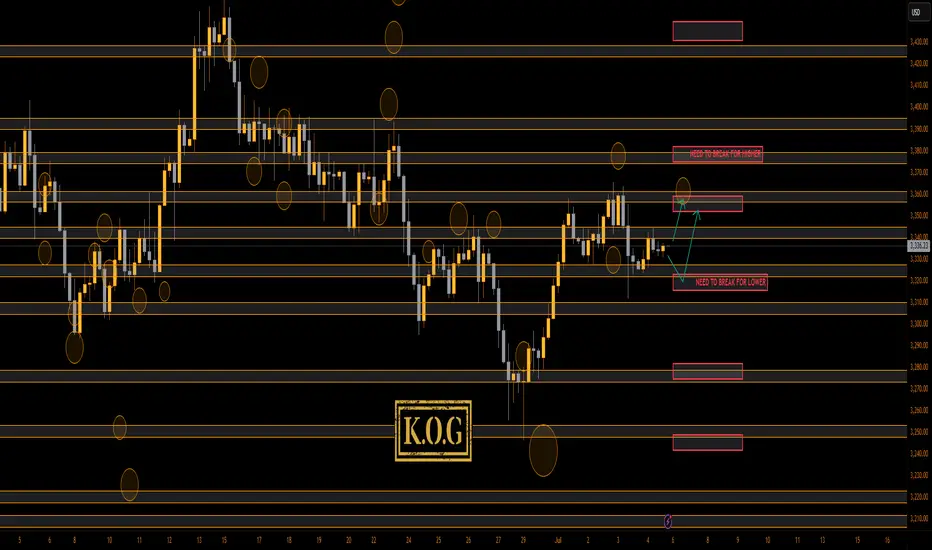
THE KOG REPORTTHE KOG REPORT:
In last week’s KOG Report we said we would ideally be looking for price to attempt lower and reject at the red box giving us the opportunity to long back up into the key levels following the red box and Excalibur targets. We did open with a huge spike down, into the 2nd region we wanted and managed to the move we giving us a great start to the week. As you can see on last week’s chart we broke above the red box which meant shorting was not on the cards, and a continuation into the next level would be a preferable trade, also working well. The NFP bias was bearish below the red box, again, tap and bounce from Excalibur giving the move downside, but not completing at the level we initially wanted.
Not a bad week at all in Camelot.
So, what can we expect in the week ahead?
For this week we would expect cleaner price action but there isn’t a lot of news so we may see some ranging and sudden burst of volume which will be needed to drive price out of the range.
We have support at the 3330 level and the extension level which is around 3210, which if spiked and held, should give us a move into the higher red box level and resistance 3345-50. There is another extension level above, 3360-65, which, if there was a bias this week would be the bearish below level. This level, if approached needs to be watched carefully for a potential RIP and needs to be broken for us to see higher pricing in gold.
Volume indicators are suggesting a potential pull back on the open, so let’s see if we can find that support and as long as we don’t break below 3310-6 we may just see a more range play between 3365 resistance and 3310 support.
It’s a bit conflicting on the charts this week which is why we’ll say let’s play it day by day and we’ll update every one as we go through the week.
RED BOX TARGETS:
Break above 3350 for 3355, 3360, 3362, 3365, 3374, 3388 and 3396 in extension of the move
Break below 3335 for 3331, 3324, 3321, 3310, 3306 and 3293 in extension of the move
Please do support us by hitting the like button, leaving a comment, and giving us a follow. We’ve been doing this for a long time now providing traders with in-depth free analysis on Gold, so your likes and comments are very much appreciated.
As always, trade safe.
KOG
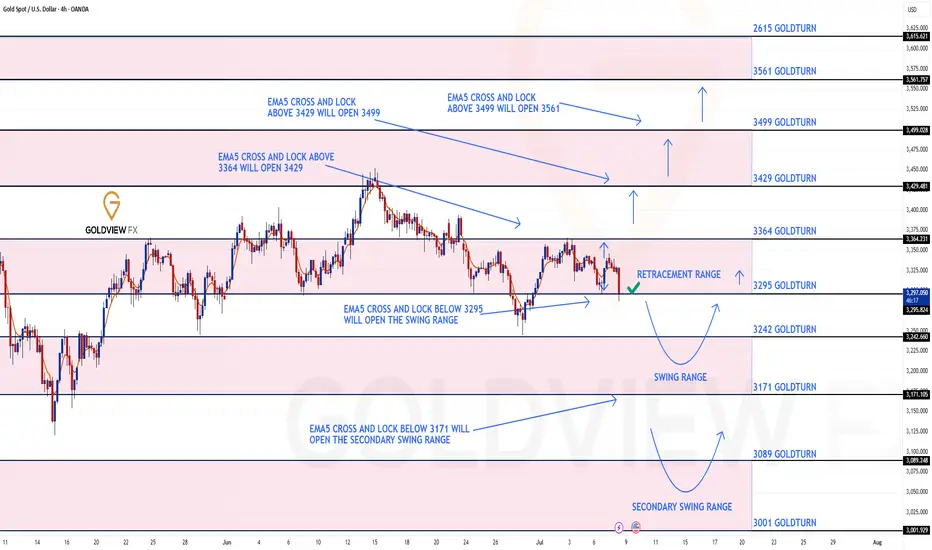
GOLD 4H CHART ROUTE MAP UPDATEHey Everyone,
Please see update on our 4H Chart route map, also playing out perfectly with our levels being respected, as analysed.
We have our bearish target hit at 3295 and currently testing for support and bounce. Ema5 cross and lock below this level will open the swing range and failure to lock will see price reject and head up for the Bullish target. The 1h chart route map from yesterdays update also has the swing range open, which we need to keep in mind when planning to buy dips.
We will keep the above in mind when taking buys from dips. Our updated levels and weighted levels will allow us to track the movement down and then catch bounces up.
We will continue to buy dips using our support levels taking 20 to 40 pips. As stated before each of our level structures give 20 to 40 pip bounces, which is enough for a nice entry and exit. If you back test the levels we shared every week for the past 24 months, you can see how effectively they were used to trade with or against short/mid term swings and trends.
The swing range give bigger bounces then our weighted levels that's the difference between weighted levels and swing ranges.
BULLISH TARGET
3364
EMA5 CROSS AND LOCK ABOVE 3364 WILL OPEN THE FOLLOWING BULLISH TARGETS
3429
EMA5 CROSS AND LOCK ABOVE 3429 WILL OPEN THE FOLLOWING BULLISH TARGET
3499
EMA5 CROSS AND LOCK ABOVE 3429 WILL OPEN THE FOLLOWING BULLISH TARGET
3499
EMA5 CROSS AND LOCK ABOVE 3499 WILL OPEN THE FOLLOWING BULLISH TARGET
3561
BEARISH TARGETS
3295 - DONE
EMA5 CROSS AND LOCK BELOW 3295 WILL OPEN THE SWING RANGE
3242
3171
EMA5 CROSS AND LOCK BELOW 3171 WILL OPEN THE SECONDARY SWING RANGE
3089
3001
As always, we will keep you all updated with regular updates throughout the week and how we manage the active ideas and setups. Thank you all for your likes, comments and follows, we really appreciate it!
Mr Gold
GoldViewFX
GOLD ROUTE MAP UPDATEHey Everyone,
Another PIPTASTRIC day on the markets with our chart idea and levels playing out and being respected, as analysed.
After completing the swing range test and full swing into 3306, we stated yesterday that we will now look for ema5 cross and lock above 3306 to open 3330. This was locked and loaded and completed the 3330 target today.
We will now continue to look for ema5 lock above 3330 for a continuation into the bullish targets above or failure to lock will see rejections into the lower Goldturns for support and bounce inline with our plans to buy dips.
We will keep the above in mind when taking buys from dips. Our updated levels and weighted levels will allow us to track the movement down and then catch bounces up.
We will continue to buy dips using our support levels taking 20 to 40 pips. As stated before each of our level structures give 20 to 40 pip bounces, which is enough for a nice entry and exit. If you back test the levels we shared every week for the past 24 months, you can see how effectively they were used to trade with or against short/mid term swings and trends.
The swing range give bigger bounces then our weighted levels that's the difference between weighted levels and swing ranges.
BULLISH TARGET
3358
EMA5 CROSS AND LOCK ABOVE 3358 WILL OPEN THE FOLLOWING BULLISH TARGETS
3389
EMA5 CROSS AND LOCK ABOVE 3389 WILL OPEN THE FOLLOWING BULLISH TARGET
3416
EMA5 CROSS AND LOCK ABOVE 3416 WILL OPEN THE FOLLOWING BULLISH TARGET
3439
BEARISH TARGETS
3330 - DONE
EMA5 CROSS AND LOCK BELOW 3330 WILL OPEN THE FOLLOWING BEARISH TARGET
3306 - DONE
EMA5 CROSS AND LOCK BELOW 3306 WILL OPEN THE SWING RANGE
3283 - DONE
3254
As always, we will keep you all updated with regular updates throughout the week and how we manage the active ideas and setups. Thank you all for your likes, comments and follows, we really appreciate it!
Mr Gold
GoldViewFX
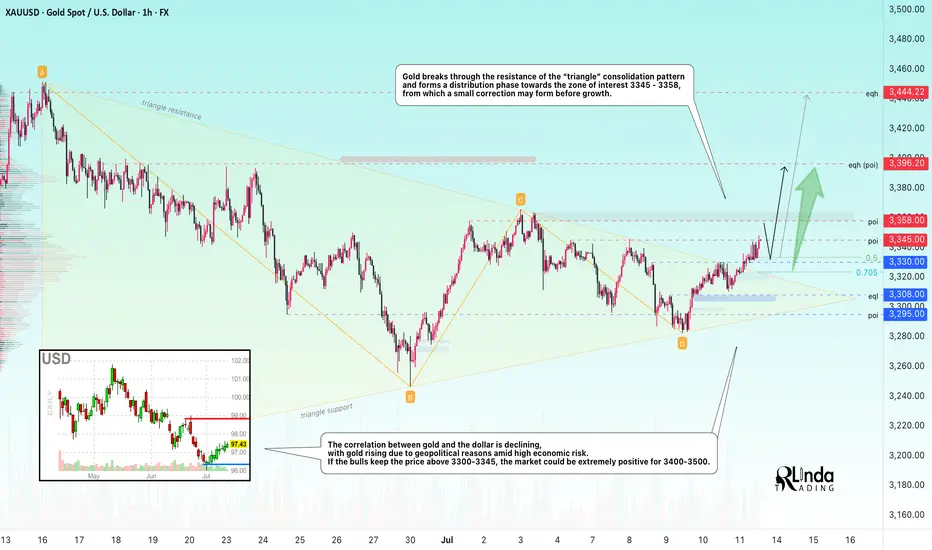
GOLD → Distribution. There is potential for growth to 3450–3500FX:XAUUSD breaks through consolidation resistance and forms a distribution pattern. A breakout of 3345-3358 could lead to another rally amid high economic risks...
Gold is rising for the third day in a row amid growing concerns about new tariffs announced by Trump. He threatened to impose tariffs on Canada and most of its trading partners, as well as the EU. Despite the strengthening of the dollar, demand for gold remains strong due to uncertainty and expectations for US inflation data next week. Investors are cautious ahead of CPI and the Fed's possible response
The correlation between gold and the dollar is declining, with gold rising due to geopolitical reasons amid high economic risks.
If the bulls keep the price above 3300-3345, the market could be extremely positive for 3400-3500.
Resistance levels: 3345, 3358
Support levels: 3330, 3308
Gold has broken through the resistance of the “triangle” consolidation pattern and is forming a distribution phase towards the zone of interest 3345 - 3358, from which a small correction may form before growth. Since 3345 is an intermediate level, the focus is on 3358. I do not rule out the possibility of a long squeeze of the support levels 3330, the triangle support, and 3310 before the growth continues.
Best regards, R. Linda!
XAU/USD : Gold is falling , When it Stops? (READ THE CAPTION)By analyzing the gold chart on the 4-hour timeframe, we can see that, in line with our latest analysis, the bearish momentum has continued—and even more strongly than expected. Gold has broken below the key $3300 level and is currently trading around $3294.
Given the strong momentum, further downside is likely. The next bearish targets are $3289, $3276, $3262, and $3254.
All key supply and demand zones are clearly marked on the chart.
(And if you're looking for more precise trading levels, just drop a comment and I'll guide you.)