GOLD Set for Big Move? | Key Zones + CPI Impact Explained !Gold Analysis – Key Levels + CPI Outlook!
In this video, I broke down the recent rejection from the $3366–$3369 resistance zone, the drop to $3346, and current price action around $3357.
We’ll also look ahead at what to expect with the upcoming CPI report — and how it could shape gold’s next big move.
📌 I’ve covered both bullish and bearish scenarios, shared key demand/supply zones, and outlined possible targets.
👉 For full context and trading strategy, make sure to watch the video till the end — and don’t forget to drop your opinion in the comments:
Do you think gold will break $3380 next, or are we headed for another pullback?
THE MAIN ANALYSIS :
XAUUSD trade ideas

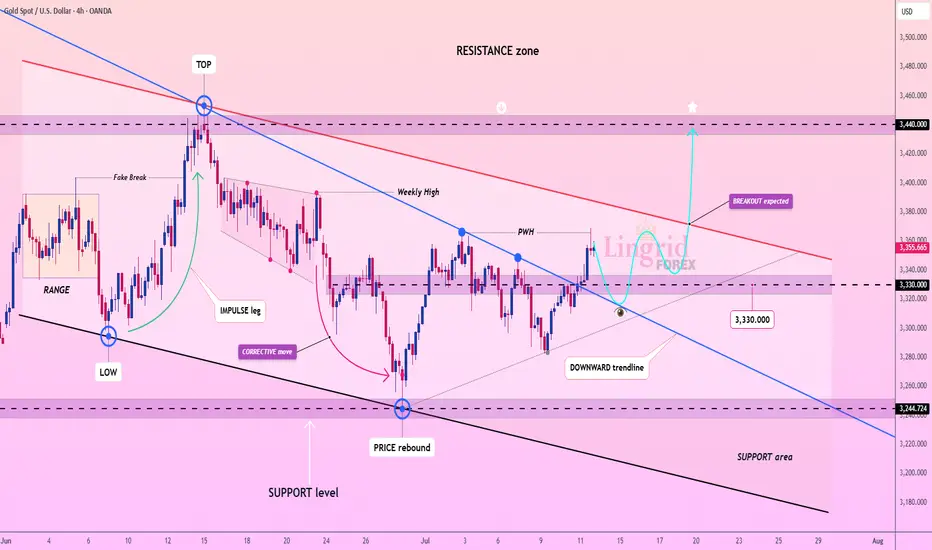
Lingrid | GOLD Weekly Market AnalysisOANDA:XAUUSD markets are navigating through a technical consolidation phase following the recent rally, maintaining underlying bullish momentum despite current volatility. The precious metal is trading between critical levels that will determine the next major directional move.
4H chart reveals a complex structure with a retest of the resistance zone around $3,440, gold has initiated a corrective move along the descending channel. The current setup suggests a healthy pullback toward the support zone near $3,330. Breaking above the downward trendline will constitute an important technical signal for bullish continuation.
The higher timeframe provides a broader perspective with an A-B pattern currently forming. Equal tests at resistance levels indicate significant institutional accumulation. The rising trendline (HL) continues to support prices, confirming the long-term bullish structure. The target zone above $3,600 remains viable if gold can successfully break through the current resistance cluster.
Key levels to monitor include the $3,330 support and $3,440 resistance. A decisive break above previous week high could trigger the next leg toward $3,400-$3,450, while failure to hold support might see a deeper correction toward $3,250. The overall technical picture suggests this consolidation represents a continuation pattern within the broader uptrend. If this idea resonates with you or you have your own opinion, traders, hit the comments. I’m excited to read your thoughts!
XAUUSDHello Traders! 👋
What are your thoughts on XAUUSD?
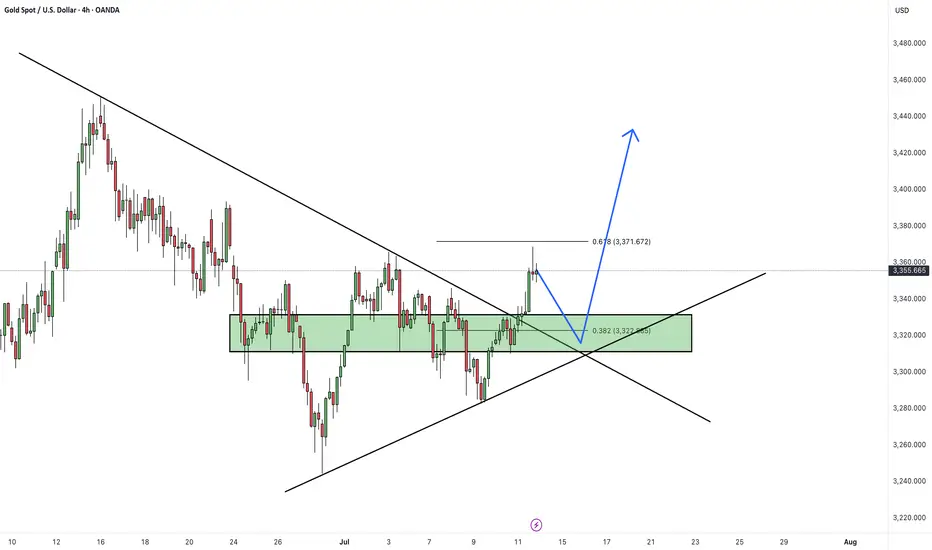
Gold has successfully broken above its descending trendline, signaling a potential shift in market structure and growing bullish momentum.
A pullback toward the broken trendline is now likely, as price may retest the breakout zone.
Once the pullback is completed, we anticipate a bullish continuation and a move toward higher levels.
As long as price holds above the identified support zone, the bullish outlook remains valid.
Will gold resume its rally after the pullback? Share your thoughts in the comments! 🤔👇
Don’t forget to like and share your thoughts in the comments! ❤️
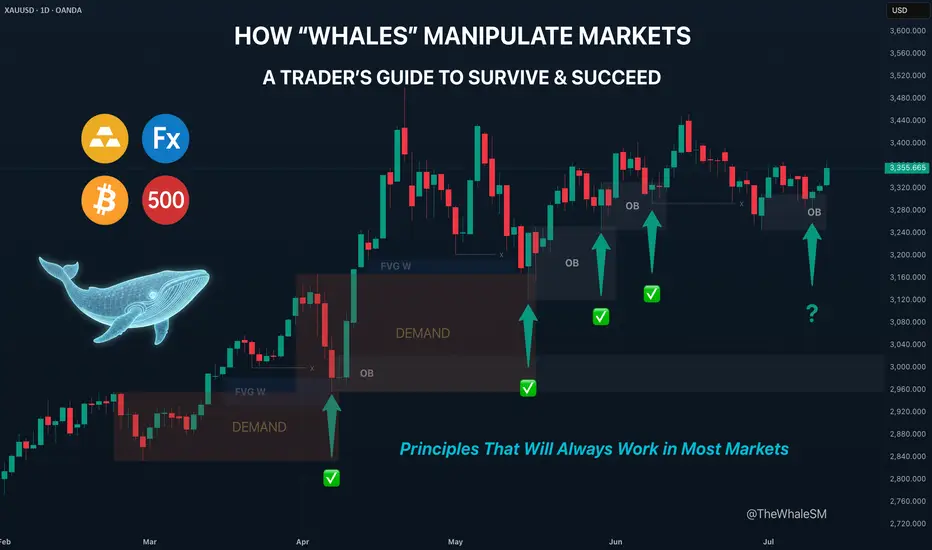
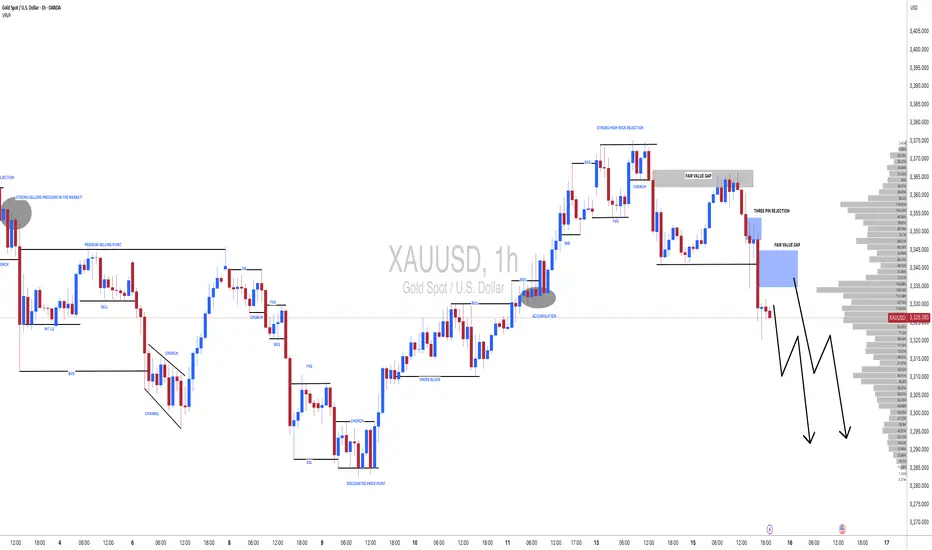
How "Whales" Manipulate Markets: A Trader's Guide to SucceedEvery chart tells a story of institutional footprints. For most, it's chaotic noise. But when you understand the market's true engine — the constant need of "Smart Money" to capture vast amounts of liquidity to fill their orders — that noise turns into a clear map.
This guide will teach you to read that map. We will break down the main types of manipulation and show you how to use them to identify high-probability zones for potential entries.
So, why exactly is liquidity the fuel for these "Smart Money" players, which for simplicity, we'll call "Whales"? It's because a Whale holds the largest volume of funds in a specific asset and, unlike retail traders like us, it cannot open its huge position at any given moment simply because there aren't enough buy or sell offers on the market.
To fill its orders, the Whale constantly carries out manipulations to capture additional liquidity. This isn't about deception or anything negative—it's how the market constantly forms its movements, how whales achieve their goals by moving from one liquidity pool to another, much like whales in the ocean hunt for plankton to get vital energy for long journeys from one feeding ground to another.
Why will these principles of price movement through manipulation, which worked decades ago, continue to work forever? Because human nature doesn't change over time. The crowd is always driven by greed and fear, making it easy to manipulate. Therefore, manipulation is often the motive for the birth of a future move and is a key element in market mechanics. If you understand these mechanics, you will be able to see the footprints of whales on any chart and not only minimize your chances of becoming their food but also join their next move to get your share of the profit in the boundless ocean of market opportunities.
Let's take a closer look at how whales carry out their manipulations and classify their types.
The Whale is constantly in hedged positions. To fill its large-sum orders without impacting the price, it uses the principles of Sell to Buy (STB) and Buy to Sell (BTS) .
The STB manipulation is used to accumulate long positions. To do this, the Whale opens an opposing short position, activating stop orders and liquidations of buyers, purchasing their positions at a favorable price. It also encourages other retail participants, especially breakout traders, to open short positions. Continuing to accumulate long positions, the Whale sharply moves the price up, liquidating short participants and absorbing their positions. After the price has moved up, the Whale is left with an open losing position from its short manipulation. To close it at breakeven or a small loss, the Whale needs to return the price back to the zone of its manipulation. This return is called mitigation .
In the opposite case, when the Whale needs to drive an asset's price down, it uses the BTS manipulation . To fill its short positions, the Whale opens a long position, activating stop-losses and forced liquidations of sellers, and encouraging retail breakout traders to also open long positions. Continuing to accumulate short positions, the Whale aggressively moves the price down, absorbing and liquidating the positions of impatient longs. After the downward impulse is complete, the Whale is left with an open losing long position. Just as in the first case, to close it at zero or a small loss, the Whale needs to return the price to the manipulation zone, after which another markdown of the asset occurs, and the cycle can be repeated as many times as necessary.
Thus, through manipulation, the Whale achieves two goals at once:
It gets the most favorable price.
It eliminates most of its competitors by liquidating their positions with an opposing move.
Most of the time, the price movement between manipulations is unpredictable. Entering during this movement, for example, in the middle or end of an impulse or within a range, increases the chances that you will become a victim of the next manipulation and liquidity for the Whale. However, if you wait for the price to arrive at the manipulation zone, also known as a Point of Interest (POI) , and ensure that the Whale acknowledges this area (i.e., it has stopped there and is beginning a reversal), the probability of choosing the correct direction for a trade will be on your side.
To help you recognize manipulation zones, let's look at their different types.
🔹 Order Block (OB) - A down candle (sometimes 2, rarely 3 candles) before an impulsive move up (in the case of a bullish OB), or an up candle (sometimes 2, rarely 3 candles) before an impulsive move down (in the case of a bearish OB). In most cases, this short, sharp move should sweep some form of significant liquidity. An additional confirmation of an Order Block is the immediate imbalance or Fair Value Gap (FVG) that follows it, because the Whale's intensive position accumulation and the associated impulse move don't allow enough time for all market participants' orders to be filled.
🔹 Demand/Supply Zones are similar in principle to Order Blocks but differ in that they have a more prolonged action, which can consist of many up or down candles, making these zones often significantly wider than OBs.
Demand Zone - The last downward move before an intensive rally.
Supply Zone - The last upward move before an intensive drop.
Often, an Order Block can be found inside a Demand/Supply zone.
🔹 Range - Also a manipulation zone and essentially an Order Block, but unlike an OB, this manipulation can last for a very long time when the Whale lacks sufficient liquidity from a quick manipulation and accumulates its large position by collecting internal and external liquidity through the range. Ranges, just like Order Blocks and Demand/Supply zones, are points of interest for the Whale to close its losing hedged positions and continue moving towards its goals.
Conditions for Applying and Validity of Manipulation Zones
An important condition for applying manipulation zones is that they can only be used once . That is, if the price has come to a zone and reacted to it, upon a second arrival, that zone is no longer valid. For convenience in marking used zones, I shorten them to the point of the first touch so as not to consider them anymore, but to understand which way the order flow is directed—a very important concept that, unlike structure, shows the true direction of the Whale's movement. Order flow is manifested by the price reacting to manipulation zones from below in an uptrend and from above in a downtrend.
It is also very important to understand that it makes sense to identify and use manipulation zones as one of a trade's entry conditions only from below for an uptrend and from above for a downtrend . Any counter-trend zones formed in the path of a trend are highly likely to be broken and serve as liquidity.
In ranges, manipulations formed after deviations can be used for entries from both sides.
Only manipulations that were formed at the beginning of an impulsive price move can be considered valid for entry. That is, they must be the manipulations that directly triggered the start of the move; in Smart Money terminology, they are often called the "origin" . Any manipulation in the middle or end of a move will most likely serve as liquidity on the way back to mitigate the origin zone.
How long does a manipulation zone remain relevant? It remains relevant until a new structural element (a higher high or a lower low) is formed , especially if the price has already come close to the manipulation zone, for example, into the FVG before the zone. This most likely means the Whale has already finished its business there and closed one of its losing hedged positions at a small loss. When the trend changes, such a zone will act as liquidity, not a POI. So, a manipulation zone will not always be mitigated; often, a reversal occurs from the FVG before it. However, entering from an FVG is much less reliable than from an Order Block, Demand/Supply zone, or Range. I personally skip such entries and wait for a new manipulation zone to form and be mitigated; they happen on the market constantly.
A good bonus that further strengthens the probability of a setup working out during the mitigation of manipulation zones is a liquidity sweep upon reaching them.
Consider the context and supplementary conditions. Although manipulation zones are the strongest areas for price reversals, they should always be used in conjunction with other supplementary conditions and tools, for example, with Fibonacci retracement levels or liquidity sweeps. "Context" implies any other conditions that can either confirm or contradict the likely direction of price movement. For example: in which phase of correction is the price? For a long, safe entries can only be considered from the discount zone (below the 50% Fib level); for shorts, only from the premium zone (above the 50% Fib level). Is there significant, un-swept liquidity nearby, such as previous daily, weekly, or monthly highs/lows, or an untouched Asian session high/low? What upcoming news could affect the asset and hit the stop before the setup plays out? At what time of day did the price mitigate the manipulation? Taking context into account is a crucial and integral part of analysis in the search for entry points.
Due to the fractal nature of market charts, manipulations can be seen on any timeframe. On weekly and daily timeframes, manipulation zones can be used for swing trading or investment purchases. 4-hour and 1-hour timeframes will show potential entries from manipulations for intraday trading or holding positions for several days. 5-minute and 1-minute timeframes will show manipulations in the form of order flow for final entry confirmation.
Whatever type of analysis you use for your trading, understanding the nature of market manipulations and practicing their recognition will allow you to be one step ahead of most market participants and open your trades with an understanding of which way institutional capital is most likely to move next.
~~~~~~~~~~~~~~~~~~~~~~~~~~~~~~~~~~~~~~~~~~~~~~~~~~~~~~~~~~~~~~~~~
If you found this guide helpful, support it with a Boost! 🚀
Have a question or a "lightbulb moment" from this article? Share it in the comments! I read every single one. 💬
► Follow me on TradingView for more educational content like this and to not miss my next detailed trade idea .
~~~~~~~~~~~~~~~~~~~~~~~~~~~~~~~~~~~~~~~~~~~~~~~~~~~~~~~~~~~~~~~~~
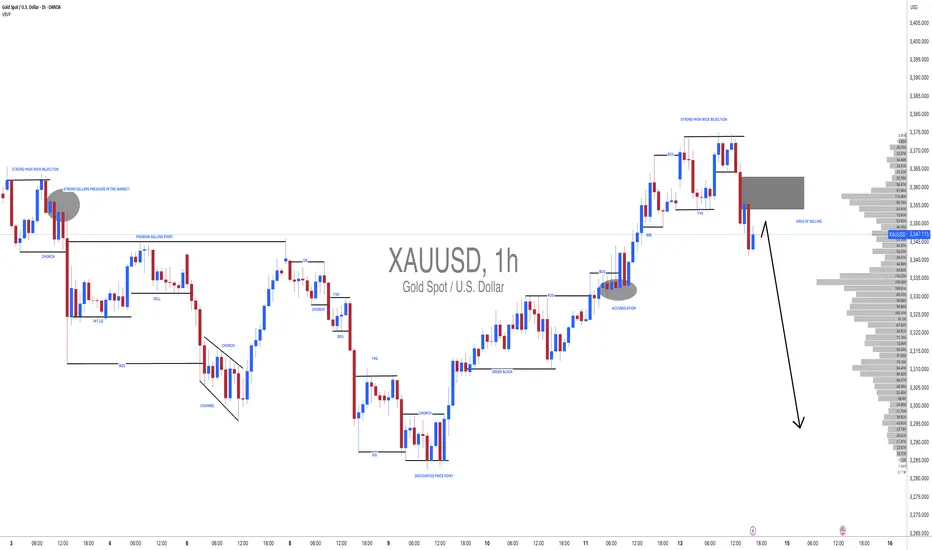
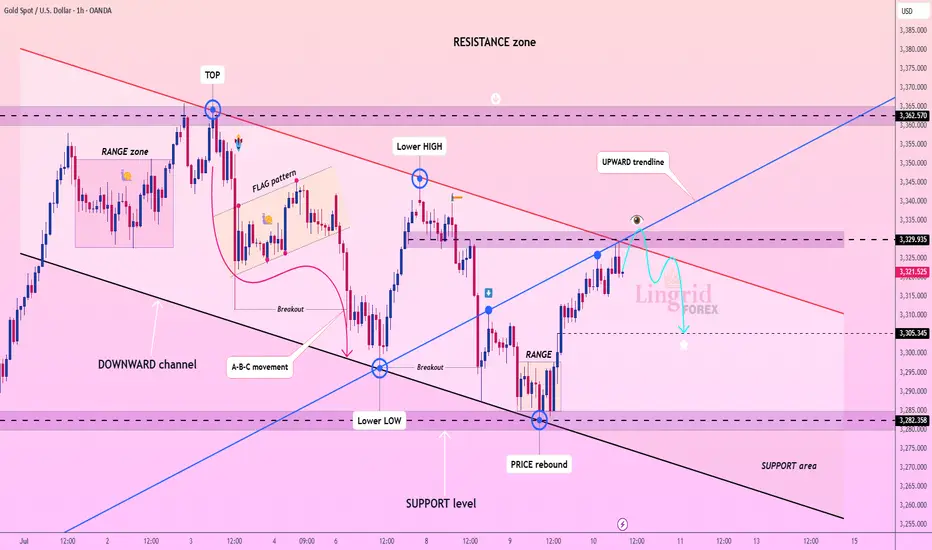
Lingrid | GOLD selling Opportunity at Resistance ZoneOANDA:XAUUSD recently rebounded from the support level near 3280 and pushed upward into the 3329 resistance zone. However, the price is struggling to break above both the red descending trendline and the horizontal supply zone, suggesting exhaustion of bullish momentum. A lower high formation and rejection from this confluence area signal a likely bearish continuation. If confirmed, price may slide toward 3305, with potential to revisit the 3280 support area.
📉 Key Levels
Sell trigger: rejection from 3330 with bearish confirmation
Sell zone: 3325–3330 (confluence of horizontal and diagonal resistance)
Target: 3305 first, extended to 3282.3
Invalidation: strong hourly close above 3330 breaks bearish structure
💡 Risks
False breakout traps near 3305 may reverse sentiment
Unexpected macro events (CPI, Fed comments) can shift short-term trend
Price bouncing at 3305 before full target reach might attract dip buyers
If this idea resonates with you or you have your own opinion, traders, hit the comments. I’m excited to read your thoughts!
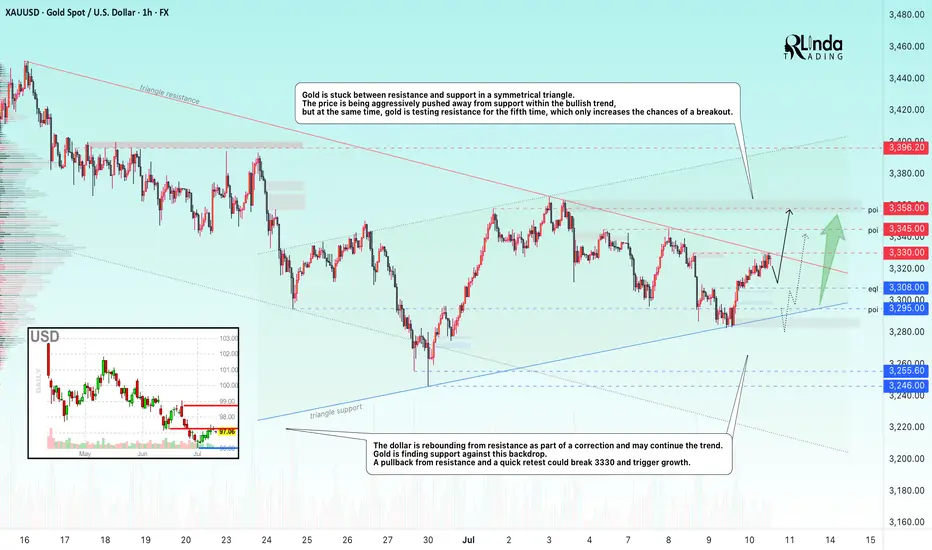
GOLD → Retest of consolidation resistance. Breakout?FX:XAUUSD is consolidating in a symmetrical triangle pattern. The price is stabilizing amid a falling dollar and uncertainty...
Gold is recovering after falling to $3,283 thanks to a weaker dollar and lower bond yields amid concerns over Trump's new tariff threats. The announced tariffs against seven countries, including Brazil and the Philippines, have heightened tensions, partially offsetting the Fed's hawkish signals. Markets are now awaiting new data from the US and speeches by Fed officials, which could influence the further dynamics of gold.
Technically, gold is squeezed between the resistance and support of a symmetrical triangle. The price is being aggressively pushed away from support within a bullish trend, but at the same time, gold is testing resistance for the fifth time, which only increases the chances of a breakout.
Resistance levels: 3330, 3345, 3358
Support levels: 3308, 3295
If gold continues to storm the local resistance at 3330 and the triangle resistance during consolidation, we will have a good chance of catching the breakout and growth. An additional scenario could be growth after a shake-up of the triangle support and the global trend.
Best regards, R. Linda!
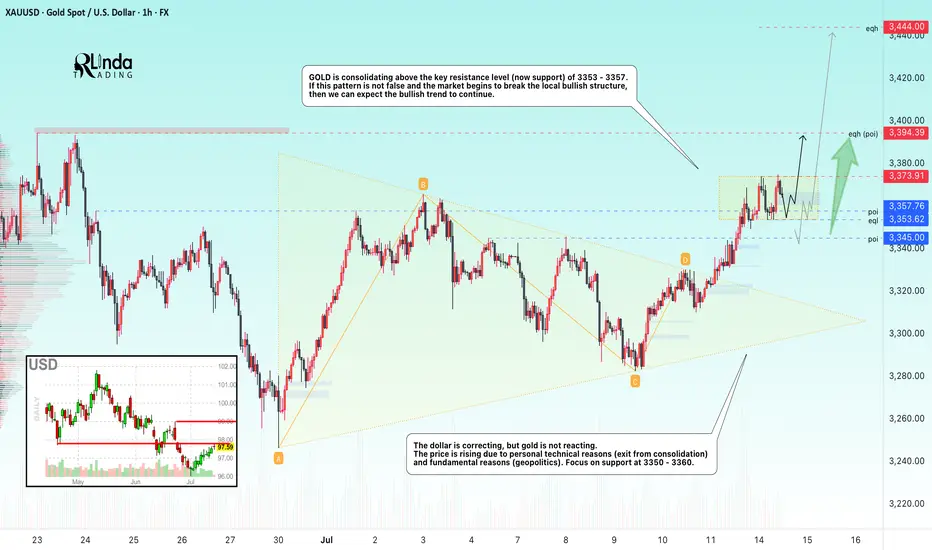
GOLD → Consolidation. Long squeeze before growth to 3400FX:XAUUSD has broken through resistance at 3353-3357 since the session opened, and bulls are currently trying to keep the market in the buying zone. Should we expect a long squeeze before growth?
Gold is in local consolidation after breaking through a key level. The price is still in the consolidation phase formed during a week-and-a-half correction. The price reached a three-week high of $3,374 on Monday but fell after the EU's conciliatory statements. Investors are awaiting US inflation data and Chinese GDP figures as they assess the prospects for a Fed rate cut. Heightened geopolitical and trade tensions are keeping demand for safe-haven assets high.
Technically, gold has entered a local buying zone, but there is a fairly complex resistance zone above it, and consolidation is needed to break through it. Such patterns could include a retest of support and a liquidity grab before growth.
Resistance levels: 3373, 3394
Support levels: 3357, 3353, 3345
There is a possibility of a retest of eql 3353 in a long squeeze format and a return to resistance at 3373 for a breakout. I also do not rule out a retest of the key level of 3345. The global trend is bullish, with the price locally in a fairly wide range, with an emphasis on the support zone of 3345-3355. If the bulls can hold this zone overall, the market will have a good chance of rising to 3400-3450
Best regards, R. Linda!
Lingrid | GOLD potential Bullish Move From Confluence ZoneOANDA:XAUUSD is forming a higher low above trend support, following a breakout from the consolidation zone and a bullish continuation leg. Price is currently pulling back toward the 3345–3350 region, which aligns with the previous breakout and key structure support. A successful retest of this area would provide confirmation for a renewed push toward the 3400 resistance zone. Momentum favors further upside if bulls defend the support and reclaim bullish control.
📉 Key Levels
Buy trigger: bullish bounce from 3345 with reclaim above 3360
Buy zone: 3345–3360 (trend support and previous breakout)
Target: 3400
Invalidation: drop below 3345 with sustained pressure cancels bullish thesis
💡 Risks
Weak volume on bounce could lead to range-bound price action
Global macro shifts may interfere with expected trend continuation
Another fake breakout near 3400 could trigger sharp rejection
If this idea resonates with you or you have your own opinion, traders, hit the comments. I’m excited to read your thoughts!

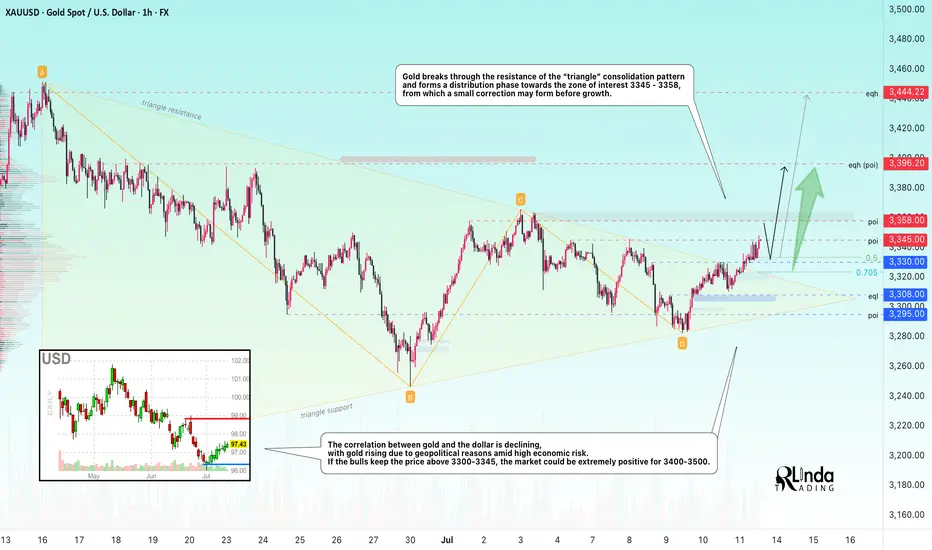
GOLD → Distribution. There is potential for growth to 3450–3500FX:XAUUSD breaks through consolidation resistance and forms a distribution pattern. A breakout of 3345-3358 could lead to another rally amid high economic risks...
Gold is rising for the third day in a row amid growing concerns about new tariffs announced by Trump. He threatened to impose tariffs on Canada and most of its trading partners, as well as the EU. Despite the strengthening of the dollar, demand for gold remains strong due to uncertainty and expectations for US inflation data next week. Investors are cautious ahead of CPI and the Fed's possible response
The correlation between gold and the dollar is declining, with gold rising due to geopolitical reasons amid high economic risks.
If the bulls keep the price above 3300-3345, the market could be extremely positive for 3400-3500.
Resistance levels: 3345, 3358
Support levels: 3330, 3308
Gold has broken through the resistance of the “triangle” consolidation pattern and is forming a distribution phase towards the zone of interest 3345 - 3358, from which a small correction may form before growth. Since 3345 is an intermediate level, the focus is on 3358. I do not rule out the possibility of a long squeeze of the support levels 3330, the triangle support, and 3310 before the growth continues.
Best regards, R. Linda!
XAU/USD : Gold at a Turning Point – Rejection or Breakout Ahead?By analyzing the TVC:GOLD (XAUUSD) chart on the 4-hour timeframe, we can see that price climbed to $3330 today, entering a key supply zone, which triggered a pullback down to $3310. Gold is now trading around $3317, and I’m watching several potential setups closely.
Scenario 1:
If gold stabilizes below $3320, we could see a bearish move toward $3296.
Scenario 2:
If price breaks above the $3333 resistance, it may enter the next supply zone between $3341 and $3351, which could trigger a strong rejection—potentially offering a 100 to 400 pip move.
Now let’s break down the key levels to watch:
Supply zones: $3320, $3333, $3342, $3358
Demand zones: $3303, $3296, $3289, $3278
Monitor how price reacts to each of these zones — they may provide excellent opportunities.
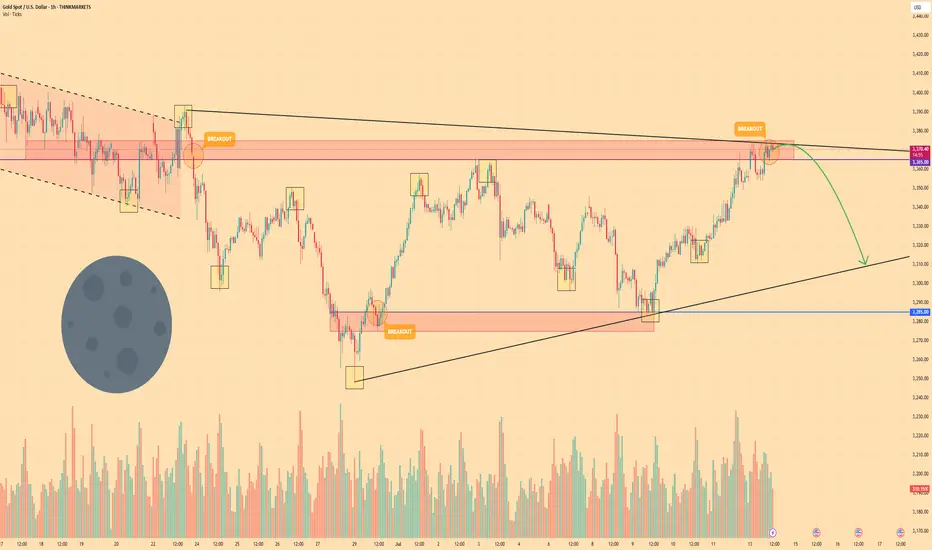
GOLD - Price can start to decline and break support levelHi guys, this is my overview for EURUSD, feel free to check it and write your feedback in comments👊
Gold initially traded inside a steady falling channel, carving lower highs at $3390 and lower lows around $3285 as bears held sway.
A brief fake breakout at $3365 briefly flipped sentiment, but sellers quickly reasserted control and pushed price back toward the channel floor.
Buyers then absorbed selling at the $3285 support area, sparking a rebound into a rising wedge pattern marked by converging trendlines.
Within this wedge, three minor breakouts failed to trigger sustained rallies, underscoring persistent resistance near the upper boundary.
I anticipate Gold to roll over from the wedge’s ceiling and break below $3365, targeting the wedge’s lower support line at $3310
If this post is useful to you, you can support me with like/boost and advice in comments❤️
Disclaimer: As part of ThinkMarkets’ Influencer Program, I am sponsored to share and publish their charts in my analysis.
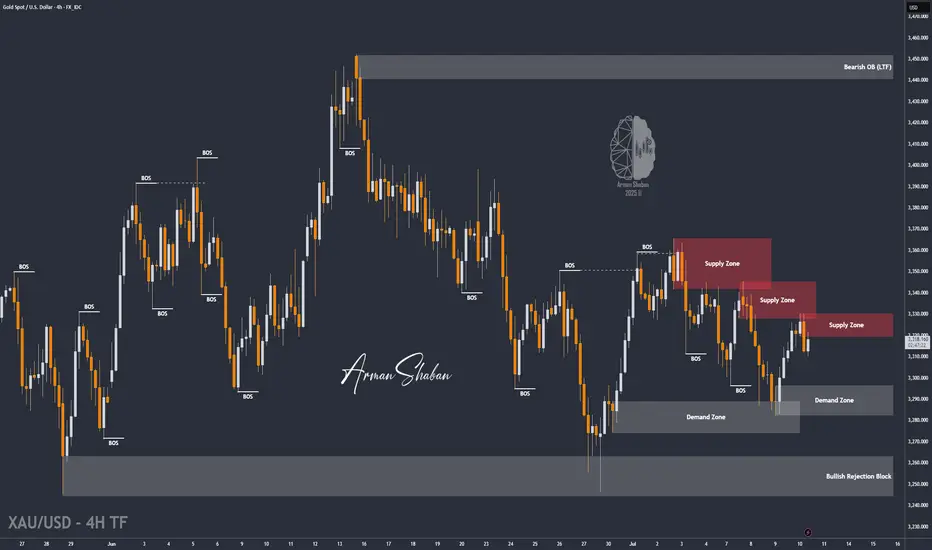
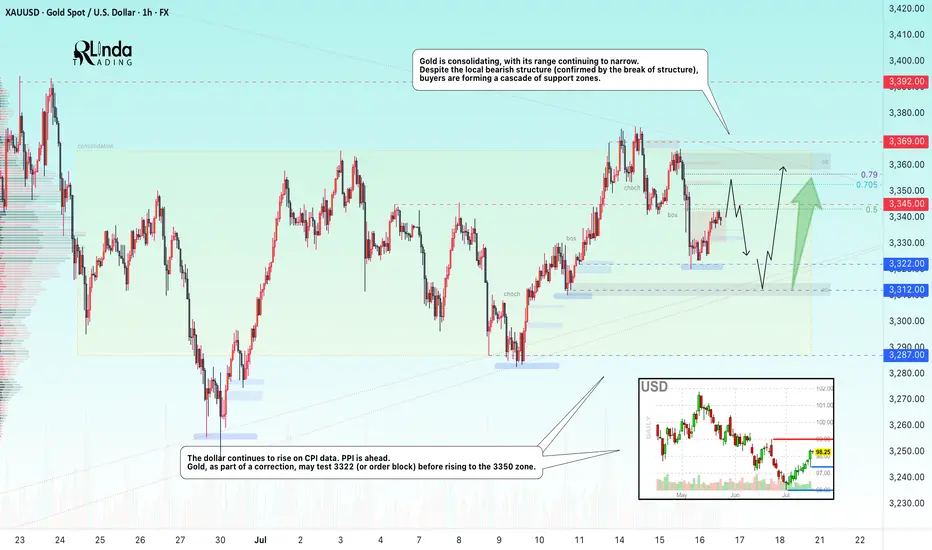
GOLD → Borders are shrinking. Consolidation continues...FX:XAUUSD is adjusting amid controversial CPI data and confirming the local bearish market structure. The PPI is ahead, and gold is consolidating, with its boundaries continuing to narrow...
Gold is recovering slightly but remains under pressure amid rising bond yields and a stronger US dollar. Higher inflation in the US reduces the chances of a quick Fed rate cut. Traders are cautious ahead of the PPI data release. If producer inflation exceeds forecasts, the dollar may rise again, putting further pressure on gold
Technically, we see consolidation in a symmetrical triangle pattern. Trading within the consolidation has a negative side - low volatility and unpredictable movements. The purpose of such movements is accumulation. However, decisions can be made based on relatively strong levels. In the current situation, we are seeing a rebound from 0.5 Fibonacci (I do not rule out a retest of the 0.7 zone before correction). The price may head towards the liquidity zone of 3322 before rising to the upper boundary of the consolidation and the zone of interest of 3350-3360.
Resistance levels: 3345, 3353, 3369
Support levels: 3322, 3312, 3287
The problem is that the price is in a consolidation phase. That is, technically, it is standing still and moving between local levels. You can trade relative to the indicated levels. Focus on PPI data. At the moment, gold is in the middle of a triangle and is likely to continue trading within the boundaries of a narrowing channel due to uncertainty...
Best regards, R. Linda!
Lingrid | GOLD Potential A-B-C Movement in ProgressOANDA:XAUUSD bounced strongly from the ascending trendline and reclaimed key structure near 3,275, signaling strength after rejecting the prior downward channel. Price has broken above the descending trendline and is now testing the 3,329 resistance zone with bullish momentum. If buyers maintain control above this breakout area, a push toward the 3,400 level becomes increasingly likely. The structure supports a continuation of the bullish leg unless price drops back under 3,275.
📉 Key Levels
Buy trigger: breakout and retest hold above 3,329.3
Buy zone: 3,300–3,329 (breakout + structure support)
Target: 3,400 first, extended toward 3,500
Invalidation: sharp drop below 3,275 negates bullish setup
💡 Risks
False breakout above 3,329 could invite short-term pullback
Rejection at 3,400 may lead to consolidation below resistance
Macro shocks (Fed, CPI) could reverse sentiment abruptly
If this idea resonates with you or you have your own opinion, traders, hit the comments. I’m excited to read your thoughts!
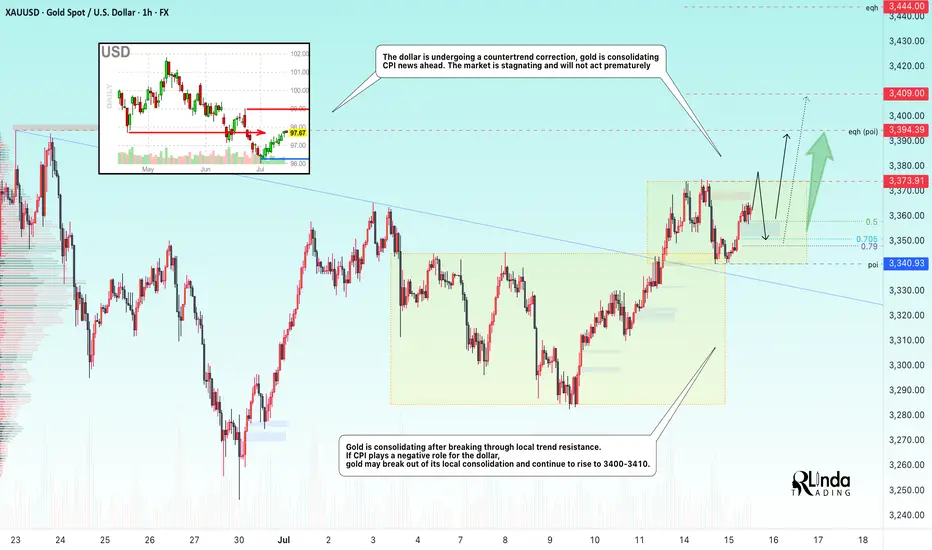
GOLD → Consolidation ahead of CPI. Chances for growth?FX:XAUUSD Gold is consolidating amid a correction in the dollar ahead of important news. Consumer price index data is due later today. The market is stagnant and will not move prematurely.
On Tuesday, gold rose slightly amid profit-taking ahead of the US CPI release. Investors are waiting for a signal from inflation: weaker data could strengthen bets on a Fed rate cut and support gold, while strong inflation would strengthen the dollar and put pressure on the metal. The situation is exacerbated by Trump's new tariff threats and his criticism of the Fed chair. Let me remind you of Trump's pressure on regulators regarding inflation and interest rate cuts.
Technically, gold is trading above the previously broken “symmetrical triangle” consolidation. Bulls are trying to hold their ground above 3340-3350. Focus on the current range of 3340-3373
Resistance levels: 3373, 3394
Support levels: 3350, 3340
Favorable news for gold could boost interest in the metal, which would generally lead to growth. However, there is a factor of unpredictability, and against this backdrop, gold may test support at 3350-3340. If the bulls manage to keep the price above this zone, we may see growth in the medium term. Otherwise, the price may drop to 3310-3280.
Best regards, R. Linda!
#XAUUSD(GOLD): Strong Sellers Hold, Further Drop Incoming! God dropped from our area of entry yesterday as we initially expected. However, since the massive drop, we are now seeing some short-term correction in the prices. In the coming time, we can expect further price drops around 3280 or 3250.
If you like our idea, please like and comment.
Team Setupsfx_
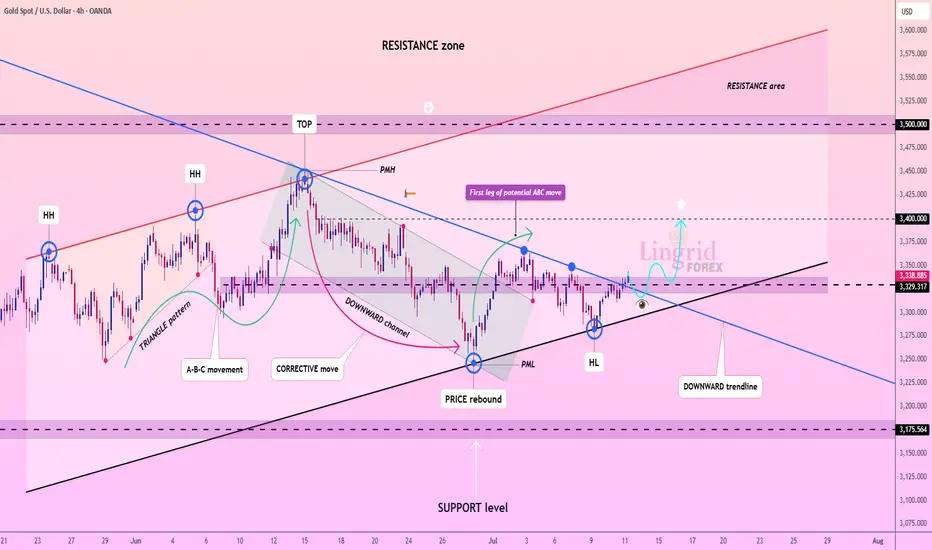
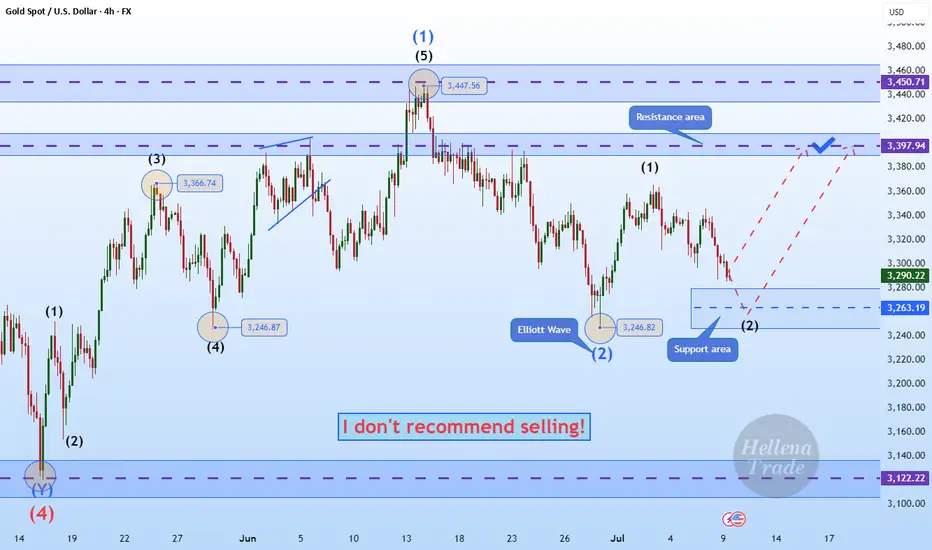
Hellena | GOLD (4H): LONG to resistance area of 3397 (Wave 3).Dear colleagues, my previous forecast remains valid, but I have decided to update it.
At the moment, I still think that wave “3” of the medium order continues its upward movement.
At the moment, I think that the small correction in wave “2” is ending and we will see a continuation of the trend. I see the resistance area of 3397.94 as the target. The main thing is to overcome the local level of the small wave “1” at 3366.37.
Manage your capital correctly and competently! Only enter trades based on reliable patterns!
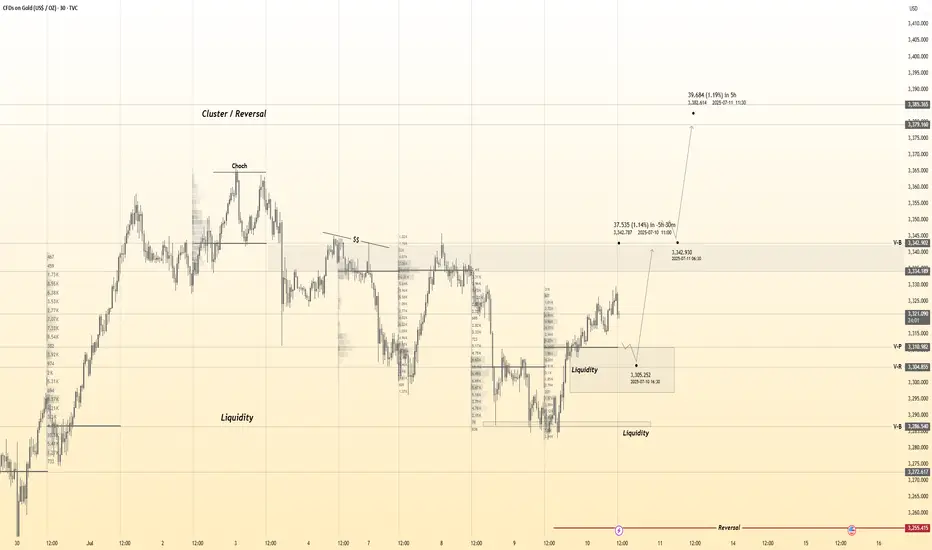
Gold 30Min Engaged ( Two Bullish Entry's Detected )Time Frame: 30-Minute Warfare
Entry Protocol: Only after volume-verified breakout
🩸Bullish Reversal 3311 Zone
🩸Bullish Break 3343 Zone
➗ Hanzo Protocol: Volume-Tiered Entry Authority
➕ Zone Activated: Dynamic market pressure detected.
The level isn’t just price — it’s a memory of where they moved size.
Volume is rising beneath the surface — not noise, but preparation.
🔥 Tactical Note:
We wait for the energy signature — when volume betrays intention.
The trap gets set. The weak follow. We execute.
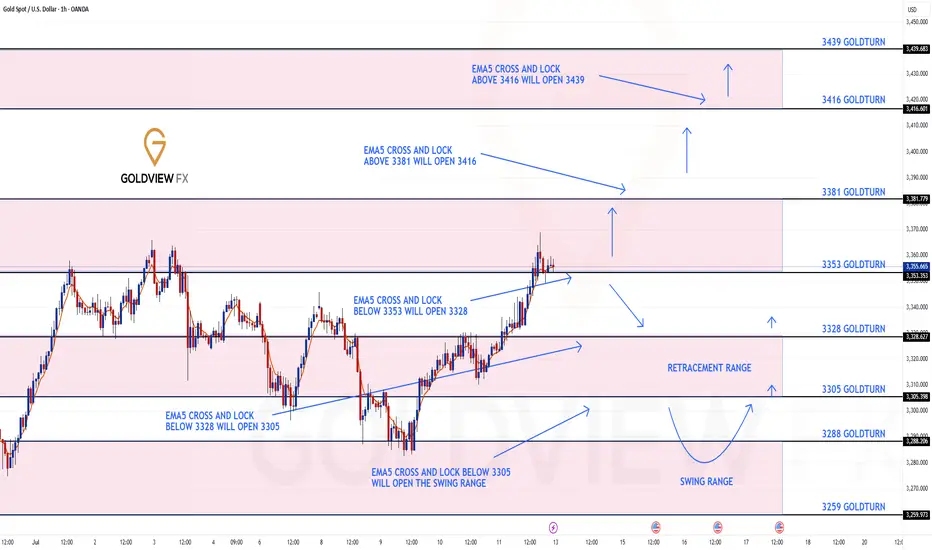
GOLD 1H CHART ROUTE MAP UPDATE & TRADING PLAN FOR THE WEEKHey Everyone,
Please see our updated 1h chart levels and targets for the coming week.
We are seeing price play between two weighted levels with a gap above at 3381 and a gap below at 3353. We will need to see ema5 cross and lock on either weighted level to determine the next range.
We will see levels tested side by side until one of the weighted levels break and lock to confirm direction for the next range.
We will keep the above in mind when taking buys from dips. Our updated levels and weighted levels will allow us to track the movement down and then catch bounces up.
We will continue to buy dips using our support levels taking 20 to 40 pips. As stated before each of our level structures give 20 to 40 pip bounces, which is enough for a nice entry and exit. If you back test the levels we shared every week for the past 24 months, you can see how effectively they were used to trade with or against short/mid term swings and trends.
The swing range give bigger bounces then our weighted levels that's the difference between weighted levels and swing ranges.
BULLISH TARGET
3381
EMA5 CROSS AND LOCK ABOVE 3381 WILL OPEN THE FOLLOWING BULLISH TARGETS
3416
EMA5 CROSS AND LOCK ABOVE 3416 WILL OPEN THE FOLLOWING BULLISH TARGET
3439
BEARISH TARGETS
3353
EMA5 CROSS AND LOCK BELOW 3353 WILL OPEN THE FOLLOWING BEARISH TARGET
3328
EMA5 CROSS AND LOCK BELOW 3328 WILL OPEN THE FOLLOWING BEARISH TARGET
3305
EMA5 CROSS AND LOCK BELOW 3305 WILL OPEN THE SWING RANGE
3288
3259
As always, we will keep you all updated with regular updates throughout the week and how we manage the active ideas and setups. Thank you all for your likes, comments and follows, we really appreciate it!
Mr Gold
GoldViewFX
GOLD 1H CHART ROUTE MAP UPDATEHey Everyone,
Quick follow up on our 1H chart idea
We had a nice push up on the chart at the start of the week, coming close but just short of the 3381 gap. Still, it was a solid catch that respected our levels beautifully.
Following that, we cleared our 3353 Bearish Target, which also triggered the EMA5 cross and lock, confirming the move toward our 3328 retracement range, a level we hit perfectly.
As expected, we're now seeing a reaction in this 3328 zone, which remains key. We are watching this closely for a potential bounce. However, if price crosses and locks below 3328, the swing range will open, setting up the potential for a larger swing bounce from deeper levels.
We’ll continue using dips and key support zones for scalps and intraday bounces, aiming for 20–40 pips per level. The structure remains valid, and as mentioned before, our back-tested levels have consistently shown strong reaction zones over the past 24 months.
Updated Reminder of Key Levels:
BULLISH TARGET
3381
EMA5 CROSS & LOCK ABOVE 3381 opens
3416
EMA5 CROSS & LOCK ABOVE 3416 opens
3439
BEARISH TARGETS
3353 ✅ HIT
EMA5 CROSS & LOCK BELOW 3353 opens
3328 ✅ HIT
EMA5 CROSS & LOCK BELOW 3328 opens
3305
EMA5 CROSS & LOCK BELOW 3305 opens Swing Range:
3288
3259
As always, we’ll continue monitoring and sharing updates, as price reacts around these zones. Thank you all for the continued support, your likes, comments, and follows are genuinely appreciated!
Mr Gold
GoldViewFX

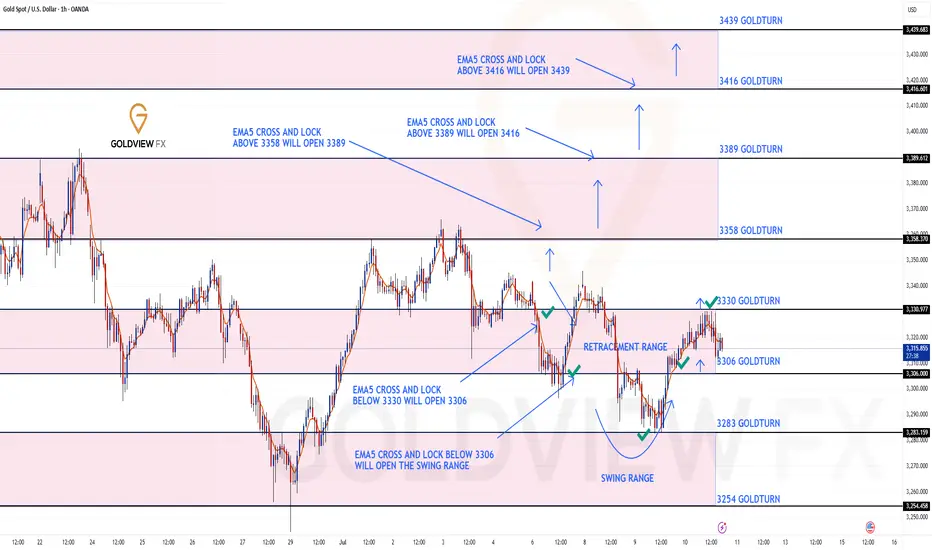
GOLD ROUTE MAP UPDATEHey Everyone,
Another PIPTASTRIC day on the markets with our chart idea and levels playing out and being respected, as analysed.
After completing the swing range test and full swing into 3306, we stated yesterday that we will now look for ema5 cross and lock above 3306 to open 3330. This was locked and loaded and completed the 3330 target today.
We will now continue to look for ema5 lock above 3330 for a continuation into the bullish targets above or failure to lock will see rejections into the lower Goldturns for support and bounce inline with our plans to buy dips.
We will keep the above in mind when taking buys from dips. Our updated levels and weighted levels will allow us to track the movement down and then catch bounces up.
We will continue to buy dips using our support levels taking 20 to 40 pips. As stated before each of our level structures give 20 to 40 pip bounces, which is enough for a nice entry and exit. If you back test the levels we shared every week for the past 24 months, you can see how effectively they were used to trade with or against short/mid term swings and trends.
The swing range give bigger bounces then our weighted levels that's the difference between weighted levels and swing ranges.
BULLISH TARGET
3358
EMA5 CROSS AND LOCK ABOVE 3358 WILL OPEN THE FOLLOWING BULLISH TARGETS
3389
EMA5 CROSS AND LOCK ABOVE 3389 WILL OPEN THE FOLLOWING BULLISH TARGET
3416
EMA5 CROSS AND LOCK ABOVE 3416 WILL OPEN THE FOLLOWING BULLISH TARGET
3439
BEARISH TARGETS
3330 - DONE
EMA5 CROSS AND LOCK BELOW 3330 WILL OPEN THE FOLLOWING BEARISH TARGET
3306 - DONE
EMA5 CROSS AND LOCK BELOW 3306 WILL OPEN THE SWING RANGE
3283 - DONE
3254
As always, we will keep you all updated with regular updates throughout the week and how we manage the active ideas and setups. Thank you all for your likes, comments and follows, we really appreciate it!
Mr Gold
GoldViewFX
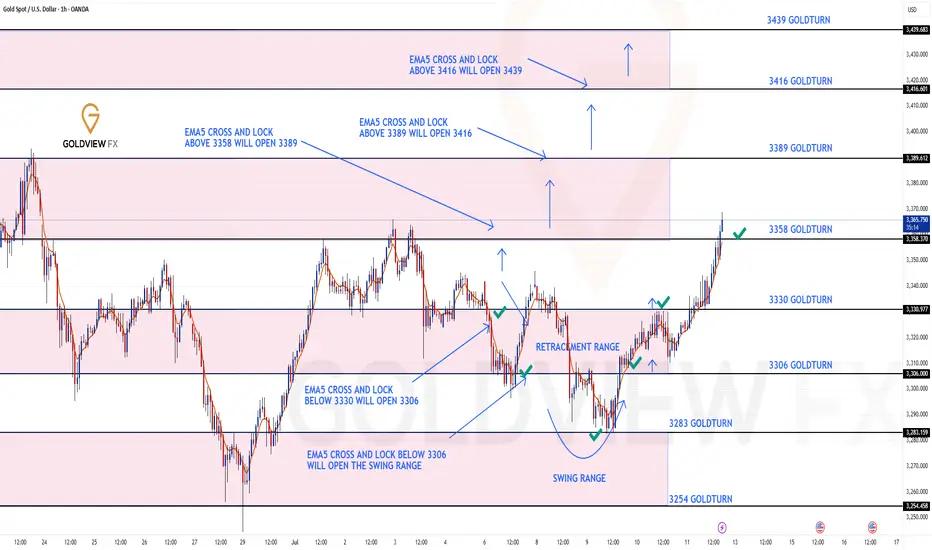
GOLD ROUTE MAP UPDATEHey Everyone,
Great finish to the week!!!
After completing our Bearish targets throughout the week, we got the swing perfectly, like we analysed and was waiting for our Bullish target to be complete.
- We got the Bullish target at 3358 HIT perfectly completing this range!!
BULLISH TARGET
3358 - DONE
BEARISH TARGETS
3330 - DONE
EMA5 CROSS AND LOCK BELOW 3330 WILL OPEN THE FOLLOWING BEARISH TARGET
3306 - DONE
EMA5 CROSS AND LOCK BELOW 3306 WILL OPEN THE SWING RANGE
3283 - DONE
We will now come back Sunday with a full multi timeframe analysis to prepare for next week’s setups, including updated views on the higher timeframes, EMA alignments, and structure expectations going forward.
Thanks again for all your likes, comments, and follows.
Wishing you all a fantastic weekend!!
Mr Gold
GoldViewFX
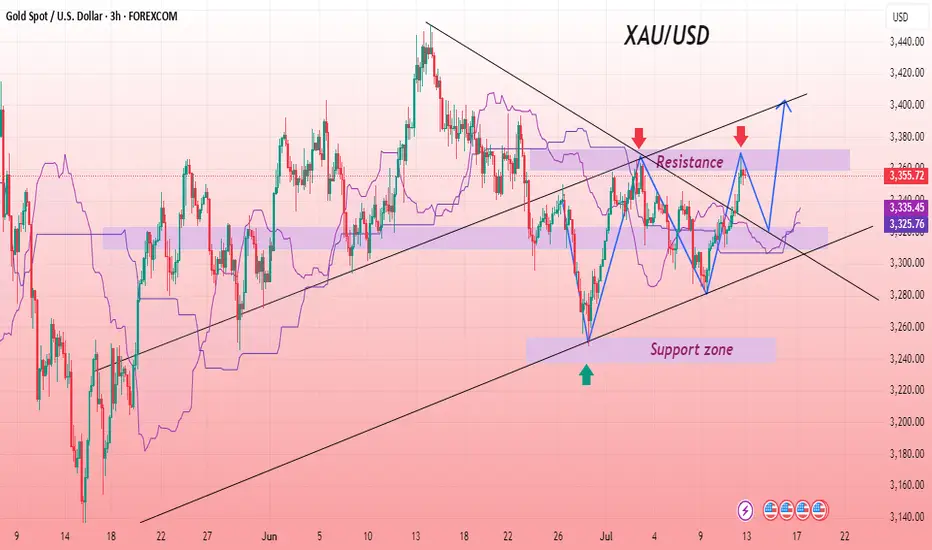
Gold Building Momentum for Potential Upside MoveGold is holding strength above the ascending trendline while testing a critical resistance zone on the 3-hour chart, indicating a potential bullish continuation pattern. The recent 35% tariff on Canada and 15% to 20% on other countries announced by Trump is helping gold to rise as traders seek safety amid rising trade tensions and potential inflationary pressures. Price action shows buyers defending dips near the support zone while respecting the Ichimoku cloud structure, signalling readiness for a breakout if resistance is cleared. Market uncertainty is driving demand for gold, aligning with the bullish structure as the trendline remains intact. Volatility is expected to increase with the tariff developments, and a clean breakout above resistance can open the way for further upside, while maintaining disciplined risk management remains essential in this environment. Continue to monitor price action near the resistance zone for confirmation of continuation toward higher levels in the coming sessions.
Entry: Buy 3320/3326
Target: 3400
Stop Loss: 3304
If you found this analysis helpful, don’t forget to drop a like and comment. Your support keeps quality ideas flowing—let’s grow and win together! 💪📈
XAUUSD: Time For Swing Sell, 1 Hour Timeframe! Gold is currently trading at crucial level where we have witnessed a strong bearish presence. This is a small time frame overview and price may not complete the target fully, so close when you think it is the time. Good luck and trade safe!
Team Setupsfx_