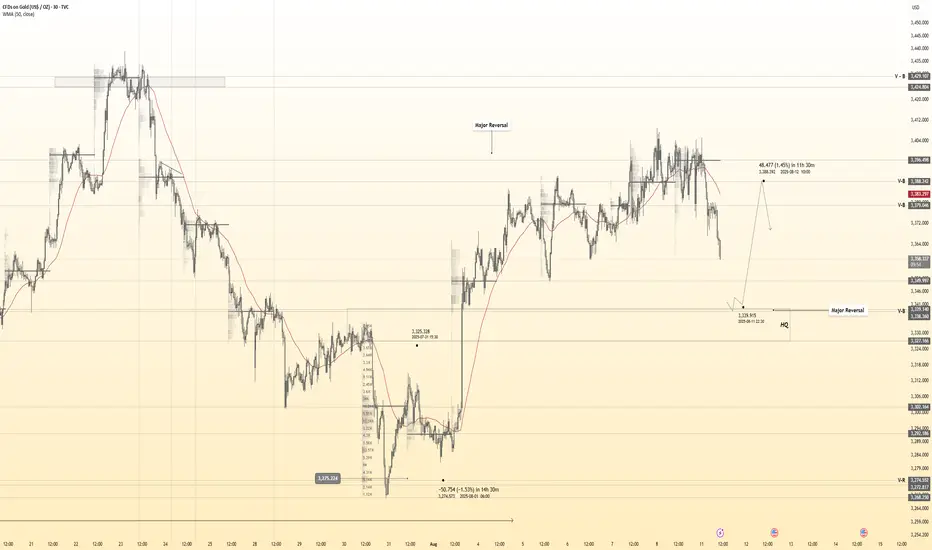
Gold 30Min Engaged ( Bearish & Bullish Entry Detected )Time Frame: 30-Minute Warfare
Entry Protocol: Only after volume-verified breakout
🩸Bearish Reversal From - 3397
🩸Bullish Reversal : 3341
➗ Hanzo Protocol: Volume-Tiered Entry Authority
➕ Zone Activated: Dynamic market pressure detected.
The level isn’t just price — it’s a memory of where they moved size.
Volume is rising beneath the surface — not noise, but preparation.
🔥 Tactical Note:
We wait for the energy signature — when volume betrays intention.
The trap gets set. The weak follow. We execute.
XAUUSD trade ideas
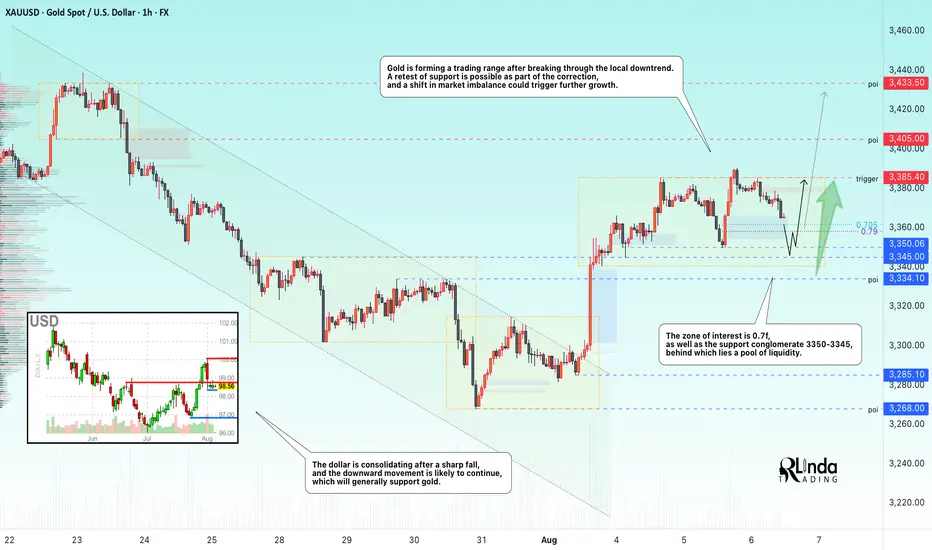
GOLD → Long squeeze of support ahead of possible growthFX:XAUUSD is entering a consolidation phase after a rally. The market is forming a trading range, and a retest of support could end in growth...
Gold pulled back from an 8-day high ($3391) on profit-taking ahead of Trump's Fed appointments. Weak ISM services data (50.1) and a pause in the dollar's weakening added pressure, although expectations of Fed policy easing in September remain supportive.
The market focus is on key events: Fed appointments (including a possible replacement for Powell) and Trump's trade statements. These factors could provide new momentum after the current correction, as long as the fundamental drivers for growth remain in place.
Resistance levels: 3385.4
Support levels: 3358, 3350, 3345
Technically, the price has confirmed resistance after a false breakout, and the market needs to build up potential for a possible continuation of growth. At the moment, the most likely scenario is a long squeeze (false breakdown) before growth continues. Focus on the key support zone.
Best regards, R. Linda!
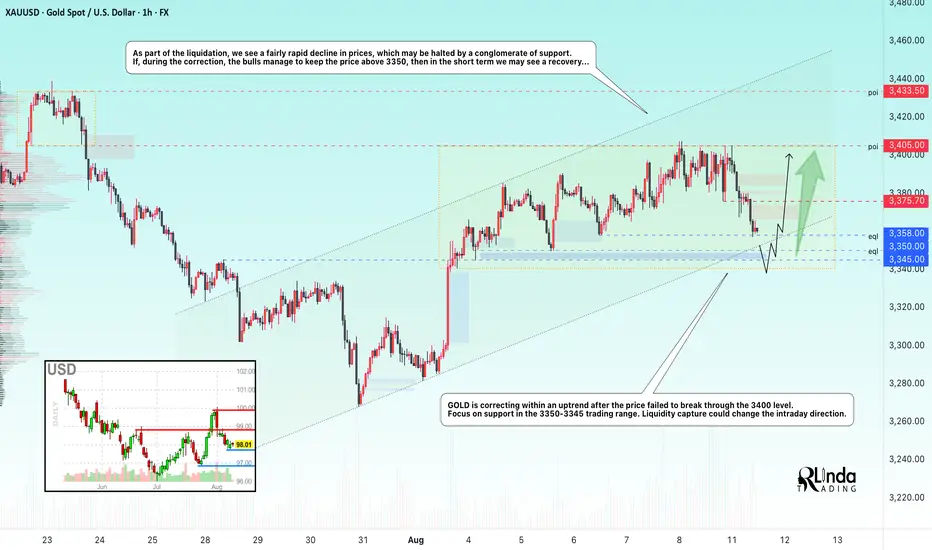
GOLD → Retest of support within an uptrendFX:XAUUSD is forming a liquidation phase as part of the previously mentioned bullish wedge pattern. Bulls were unable to break through the 3400 mark, and due to uncertainty, the price has entered a correction phase...
On Monday, gold fell to $3350, echoing the bearish sentiment in Asian trading, as $3400 remains an unattainable level. The pressure is intensified by weak data from China (PPI −3.6%), profit-taking and expectations for the US inflation report, as well as uncertainty in US-China trade negotiations and microchip policy. Optimism is being held back by expectations of Fed policy easing after negative statistics and forecasts of rate cuts, as well as possible meetings between US and Russian leaders. All this reduces demand for gold as a safe haven asset.
The focus is on the local trading range of 3400-3350. Before a possible rise, the market may test a strong support zone...
Resistance levels: 3376, 3405
Support levels: 3358, 3350, 3345
At the moment, we are seeing a retest of 3358 and a false breakdown, with a fairly weak reaction to the zone. In the short term, gold may test 3350-3345. A false breakdown and the bulls holding the price above this zone could bring the price back up...
Best regards, R. Linda!
How to Read COT Data: Understanding Big Players’ Order FlowHey whats up traders, today Im going to reveal my COT approach. If you’re serious about finding higher timeframe bias based on what the big players are doing, then COT data is a tool you need to know. It offers unique insights into the positioning of institutional traders—and if read correctly, it can help you align with real market momentum rather than noise.
Before we break it down step-by- step. I want to mention that this is my personal approach. Larry Williams is doing it differently and I have seen some other approaches. This is what works for me, might you find it also usefull.
What Is COT Data?
The Commitment of Traders (COT) report is published every Friday by the CFTC (U.S. Commodity Futures Trading Commission). It shows the open positions of various market participants in the futures markets as of the previous Tuesday.
This data is based on the requirement that large traders must report their positions once they pass a certain threshold. In short, we’re peeking into the order flow of institutions—excluding high-frequency trading and market making noise.
Hope you already recognized small disadvantage to us as retail traders.
Big players report data on Tuesday and it's published on Friday. So we basically have it late and we dont know what has happen in last 3 days. But no worry I will show you my trick how to read between the lines.
COT helps us:
• Understand HTF (Higher Timeframe) bias
• Spot shifts in institutional positioning
• Identify trend continuations or potential reversals
• Avoid getting trapped in retail sentiment traps
It’s not a standalone entry tool, but rather a macro confirmation layer for swing or position trades. Huge advantage by following large players is that they are trading on fundamentals and you dont need to worry about that - you just follow them. But you must follow the right participants, because there is few.
Who Are the Market Participants?
The COT report breaks down traders into several categories. Each one has a different motive and behavior in the market:
1. Commercials
• Think of them as hedgers.
• These are producers, manufacturers, and institutions trying to lock in prices for raw materials or currencies.
• They are usually contrarian at extremes.
When they reach record net long or net short positions, reversals often follow.
2. Non-Commercials (Speculators)
• These are institutional funds, hedge funds, and large speculators.
• Their goal? Profit.
• Often, they follow trends and their positioning reflects the broader market sentiment of the big money.
3. Dealers
• Mostly big banks and institutions facilitating trades.
• They manage risk rather than speculate heavily, so they typically take the opposite side of speculative flows.
4. Leveraged Money
• Hedge funds using high leverage.
• Their positions often reflect short-term speculative behavior.
• Watching their net positioning and changes week-to-week can give clues on momentum exhaustion.
Now you might think which one to follow and Yes you can build your strategy on following any of them fore example
Larry Williams - been trading base on Commercials
Anton Kreil - suggest following Leveraged money
I tried both but for me works best - Non commercials ( Speculators)
Again here you cant say definitely which one is right or wrong. What works for you is right. Thats it.
There are multiple versions of the report, but here are the most commonly used, Im using - ✅ Traders in Financial Futures (TFF)
• Focused on financial markets like forex, bonds, and indexes.
Where to find COT data?
It's free and you can find it on the SEC website there is simple week to week format. As you can see below. Many traders are watching this.
I dont say this is wrong but you dont have complete data - missing big picture.
As you can see here these data below are clearly giving you a picture about an order flow and positioning changedsvn the positions which can confirm trend or help you spot potential reversal you need to watch bigger data sample. Institutions doesnt reverse market in a week, they need to of load positions and I it takes them some time. Which will explain later.
Im collecting the data to the collums. I want see longs, shorts of commercials and from that I calculate. Following
Longs % exposure
Shorts % exposure
Net positions
13 weeks average
Historical Highest positions
Historical Lowest Positions
Relationship between these numbers helps me justify whats going behind the price action, but also spot strong levels. I will show you how to put it together with the context of the charts and then I will show you few order flow patterns examples, it's not difficult but it requires a bit of practice.
Bullish Pattern - Longs growing / Shorts being closed
This is the strongest COT patter and clean sign of buying
This is classing pattern what we have just seen on the EURUSD
Notice how longs has been growing constantly and net positions confirms that.
In may been able to see rapid shorts closing, which and confirmed bullish trend and we can look just for the bullish setups.
Now lets look to the USDJPY chart it will be tricky because it's all red and looks tricky but focus to the numbers and price action, how longs are growing while shorts being closed. Very weak JPY.
Bearish consolidation Shorts being build
Massive shorts being added int he consolidation phase longs doenst move at all. Further big drop coming. This is now happening on the AUDUSD. Look at this tight price consolidation and let's read what is happening. just look at the COT its clean longs around 23K constantly while they are building massive shorts. Whats gonna happens next is clear.
Profit taking move
This ofter occurs when we can see sharp move above the highs but without real longs being added, rather they being closed. As on our example below on the gold. We can see massive profit taking on longs while price was moving up. But they were not been adding shorts. What doest it tell us. They do not want to trade full reversal - not building short position, but market is overheated and they taking profits to buy later for lower or price can go to the consolidation where they will be building short, but definitely its late for us to go long.
Here is another example on USDCHF
Notice longs positions in the moment where there was 46K long and then next week change -12K net. It's a huge change which has started Sell off. But look in to Shorts , there is no heavy shorting, price simply go down based on huge longs profit taking. This is why its important to look in to bigger picture because if you look only in to week to week data. You will still see bigger longs than shorts and it will give you bullish opinion. Hope it's clear. And by the way now we can see 2 weeks with more then +3.4K longs. Its getting bullish IMO.
Now lets look to the another example on the USDCAD
Now we will use one of my past analysis where based on the data I predicted further move. And here I want to mention one thing. Even though we can see COT being bearish. It doesnt mean that price cant go up in short term (can be be 2- 3 weeks) There for you still need to use price action and dont just blindly short, but short run above the highs, because this is where big players add shorts. Not on the lows.
P rice moving up shorts being added - Reversal coming
This is showing positions building for the sell. In this case you can see both growing longs and shorts remember. Big players are hedgers, they are taking longs to move price up so they build shorts. Once they got their positions they close longs and sell of starts.
Lets look to my TV analysis where I have seen shorts grown recently while GBP was moving up close the Monthly Order block , but notice the shorts colum how the shorts were growing recently and also longs dropped from 110K to 100K.
Clena signs of the reversal but again I waited for a pullback above the weekly highs. Click to open a chart bellow
This was a prediction from few week ago. Now let's look how the data looks right now. On the GBPUSD chart below we can see reveal in the data. Long significantly dropped by 50% and shorts increased by 50%. This is a clean reversal pattern in the COT. Look at net positions it clearly flipped to the bearish and big drop is coming.
Few more tips
Remember they know we are watching this data and what we see is what they want us to see, so they are often trying to hide their positions as long as possible. Thats why intra-week reversal are happening on Wednesday after they report their positions.
They cannot hide the data forever, follow the data week by week to keep in track whats happening. It will increase your winning ratio.
Every 3 months there is a new futures contract. The must close the positions and reopen them in to the new contract, They are using it for reversals.
Also some if there is some US holidays on the day when report should be released to the public its delayed to the next week. And thats when they do biggest positions changes secretly.
COT data isn’t a magic crystal ball—but it’s a powerful tool if you know how to combine it with technical analysis. You need to use your mechanical system. It perfectly fits with my CLS strategy and It's suitable for swing traders.
Think outside the box. Even when you see bearish COT - dont be stupid to sell low. It's not NOD order flow for intraday scalping, you have time. But if you something is clearly bearish every run above weekly and daily highs is high probability Sell in the smart money trend.
Dont hesitate to ask any questions and follow. I share COT weekly updates.
“Adapt what is useful. Reject whats useless and add whats is specifically yours.”
David Perk aka Dave FX Hunter

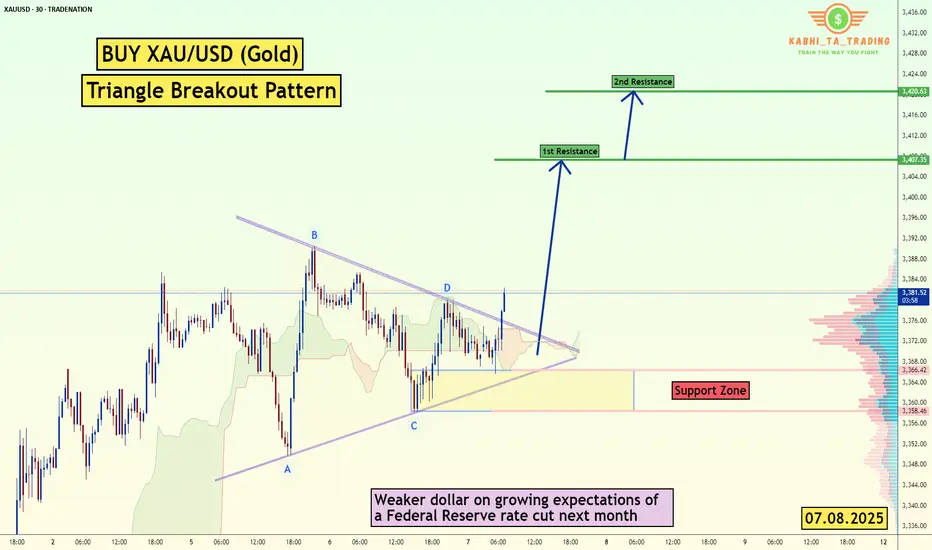
XAU/USD (Gold) Triangle Breakout (07.08.2025)The XAU/USD pair on the M30 timeframe presents a Potential Buying Opportunity due to a recent Formation of a Triangle Breakout Pattern. This suggests a shift in momentum towards the upside and a higher likelihood of further advances in the coming hours.
Possible Long Trade:
Entry: Consider Entering A Long Position around Trendline Of The Pattern.
Target Levels:
1st Resistance – 3407
2nd Resistance – 3420
🎁 Please hit the like button and
🎁 Leave a comment to support for My Post !
Your likes and comments are incredibly motivating and will encourage me to share more analysis with you.
Best Regards, KABHI_TA_TRADING
Thank you.
Disclosure: I am part of Trade Nation's Influencer program and receive a monthly fee for using their TradingView charts in my analysis.
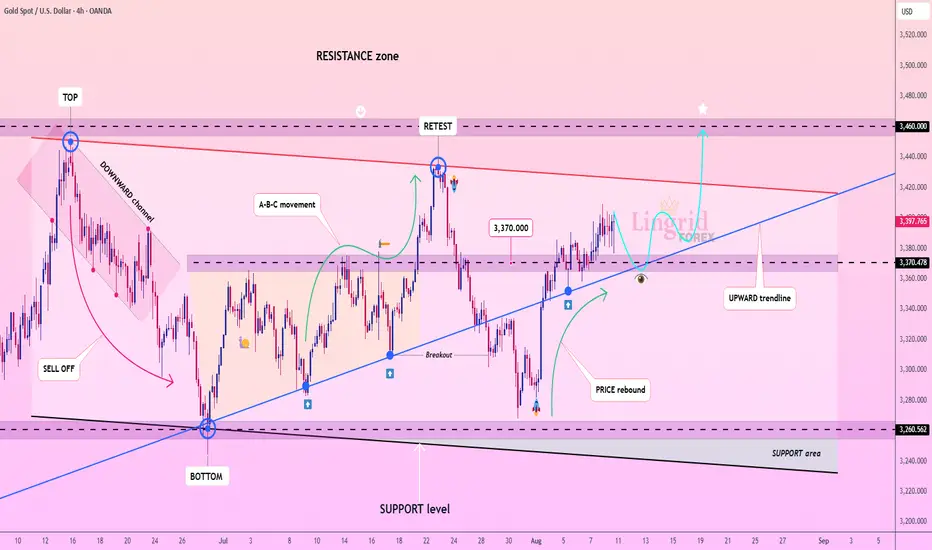
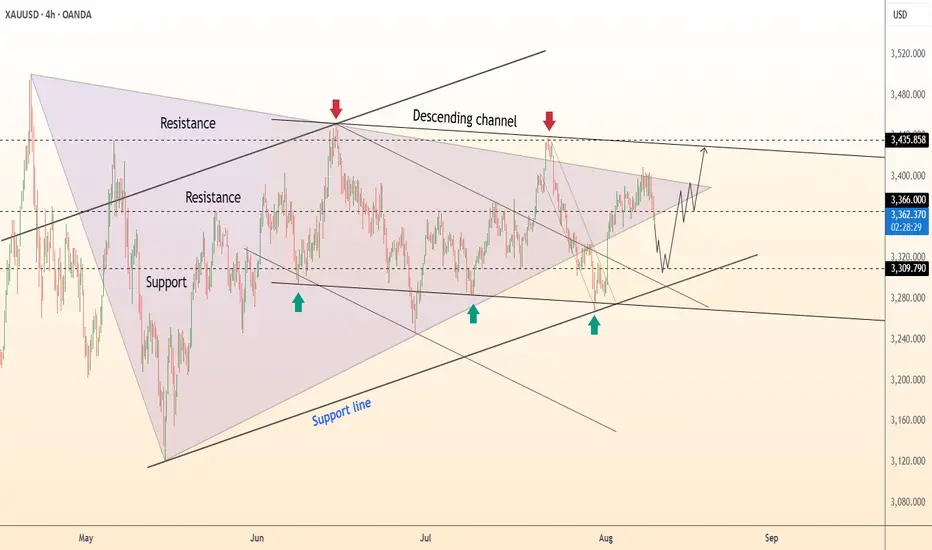
Lingrid | GOLD Weekly Price Outlook: Uptrend AccelerationOANDA:XAUUSD continues attracting significant buying interest as bulls successfully penetrated key resistance levels during the week. The market demonstrates resilience with bulls consistently stepping in during any price declines, suggesting an ongoing upward trajectory ahead.
The 4H timeframe shows gold trading within a defined channel, with price action completing an A-B-C corrective movement before breaking through the downward-sloping resistance trendline. The breach above the $3,370 level signals a potential shift in momentum, with the upward trendline now providing dynamic support. The resistance zone around $3,450-3,460 remains the next critical target.
The longer-term perspective highlights an ascending triangle pattern with multiple tests of the resistance band near $3,450. Gold price has risen approximately 40% from where they stood one year ago, reflecting extraordinary momentum. Each test of resistance has been met with renewed buying pressure, indicating strong underlying demand.
On the long-run price action suggest price could average $3,650 by Q4 2025, with potential for $4,000 by mid-2026. Central banks purchased over 400 metric tons in the first half of 2025, providing fundamental support beneath current technical developments.
The breakout above established resistance, combined with the ascending triangle formation and persistent institutional demand, suggests gold remains positioned for continued strength. We should monitor the $3,370 level as new support, with upside targets extending toward $3,500 and beyond.
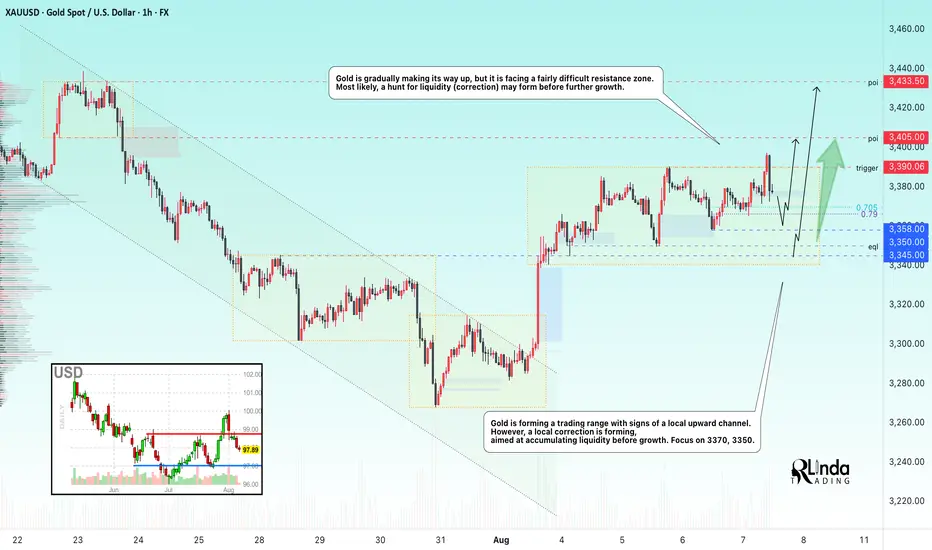
GOLD → Correction before a breakout and rallyFX:XAUUSD is gradually making its way upward, but it faces a fairly difficult resistance zone. Most likely, a long squeeze may form before further growth.
Gold is rising amid uncertainty: Expectations of key US labor market data (unemployment claims, labor costs), the possibility of a Fed rate cut in September after weak employment and services data, new trade threats (possible 15% tariffs on Japanese imports and restrictions on Russian oil supplies to China)
Key risks:
Trump's decision on Fed appointments (replacement of Kugler and Powell) and further escalation of trade conflicts could increase volatility. For now, dovish expectations and demand for safe-haven assets are supporting gold.
Technically, the focus is on the local range of 3390-3335 (3350). A false break of support could trigger growth...
Resistance levels: 3390, 3405, 3433
Support levels: 3365, 3358, 3350
The fall of the dollar is supporting the already bullish gold... However, before continuing its growth, the price is forming a correction, and a false breakout of support and liquidity capture could have a positive effect on the market for further upward movement...
Best regards, R. Linda!
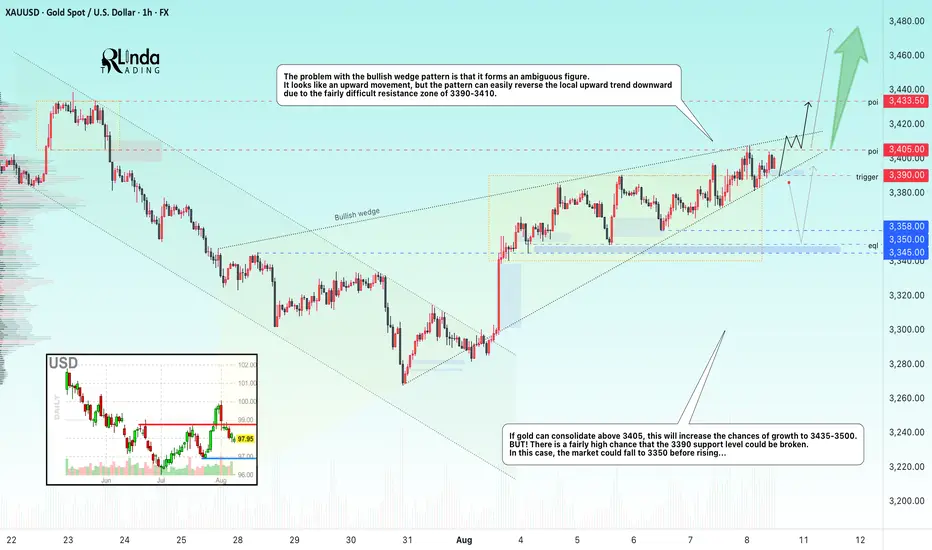
GOLD → A stalemate situation - a bullish wedgeFX:XAUUSD is unable to break through the resistance level of 3400. However, an ambiguous “bullish wedge” pattern is forming on the chart...
The price of gold retreated from a two-week high on profit-taking. The correction intensified after the US imposed tariffs on imports of gold bars (1 kg), which could disrupt supplies from Switzerland and London.
Key supporting factors: Escalation of trade conflicts, concerns about the US economy and pressure on the Fed, questions about the Fed's independence after Trump's appointments
Risks: Short-term volatility ahead of US CPI data next week. However, fundamental drivers remain bullish.
Support levels: 3390, 3350
Resistance levels: 3405, 3435
The problem with the bullish wedge pattern is that it forms an ambiguous figure. We have an upward movement, but the pattern could easily reverse the local upward trend due to the fairly difficult resistance zone of 3390-3410.
If gold manages to consolidate above 3405, this will increase the chances of growth to 3435-3500.
BUT! There is a fairly high chance that the 3390 support level could be broken. In this case, the market could fall to 3350 before rising...
Best regards, R. Linda!
XAUUSDHello Traders! 👋
What are your thoughts on GOLD?
Gold remains trapped below the key $3,390–$3,400 resistance zone, which has rejected price multiple times in recent sessions.
A short-term pullback toward the marked support level is likely.
From that zone, we expect buyers to step in, leading to another bullish push toward the resistance, and this time, a potential breakout above the $3,400 level.
As long as the price stays above support, the bullish outlook remains intact.
A confirmed break above $3,400 could open the path toward new highs.
Don’t forget to like and share your thoughts in the comments! ❤️
The 50/50 Account Management Scam- How it WorksFrom Cold Calling to Telegram
I’ve been in the markets for so long I feel like a dinosaur, and I’ve probably seen every scam out there.
The truth is, none of them are really new — they’re just adapted to the new social paradigm.
What was done in the 2000s through cold calling is now done through Telegram, Instagram, X, and other social platforms.
I didn’t really want to write this article, in case it gave someone ideas.
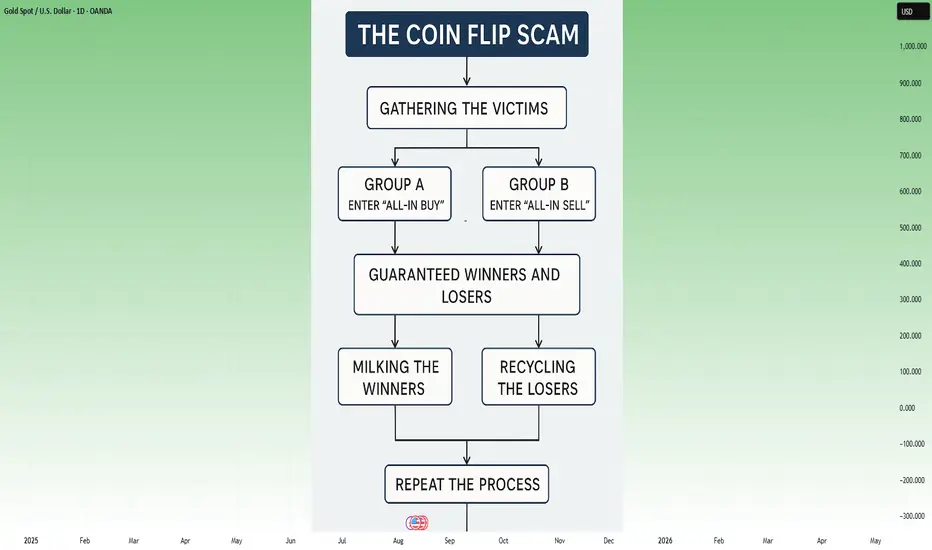
But since anyone who wants to be a scammer already knows how it works, maybe this article can warn those who still have no idea how the so-called account management scam operates — especially its most common form: the coin flip scam (50/50 scam, Opposite trades scam, Split-direction scam, Two-group margin call trick, as is also known)
Step-by-Step: How the Coin Flip Scam Works
1. Gathering the victims
The scammer starts by fishing for victims through Telegram channels/groups, Instagram profiles, Facebook groups, or even X posts.
They present fabulous profits, post ads with guaranteed return offers, and flood the feed with so-called “proofs” — screenshots of winning trades, client testimonials, and account statements. Most of these are either fabricated or selectively chosen to show only the winning side.
Once someone shows interest, the scammer’s first move is to earn their trust.
They’ll tell you the broker doesn’t matter, that you can choose it, and that they have no access to your money — which is, technically, true.
Then comes the closer:
“You don’t have to pay me upfront. I only get paid if I make you money, so it’s in my best interest not to lose. You see? We’re on the same side.”
This combination of flashy results and “risk-free” terms makes you feel safe enough to hand them trading access.
________________________________________
2. Splitting into two groups
The accounts are divided into two equal batches:
• Group A → All-in BUY
• Group B → All-in SELL
With high leverage (e.g., 1:200), a 50-pip move means either doubling the account or wiping it out completely.
Note: I won’t go too deep into the details here, because the exact margin call level depends on the broker. But trust me, it’s easy for a scammer to plan the money split based on the different brokers’ rules. What we’re talking about here is just the general principle.
________________________________________
3. Guaranteed winners and losers
The market moves.
One group hits margin call and loses, while the other doubles or triples its capital (depending on broker's leverage, even more on 1:500).
The scammer now has perfect marketing material: “Look how I doubled my client’s account!”
________________________________________
4. Milking the winners
Clients who made a profit are celebrated and told something like:
“I only worked with low capital this time just to show you I can do it. I have big clients and serious strategies — now that you’ve seen the proof, deposit more so we can make real money.”
The scammer frames the initial gain as a “demo run” to gain the client’s confidence, pushing them to commit much larger sums next.
________________________________________
5. Recycling the losers
The wiped-out clients are told:
“It was an unusual market move. Deposit another $1,000 and we’ll recover it tomorrow.”
Some quit, but others fall for it again.
________________________________________
6. Repeat the process
The cycle continues. There’s always a “happy” group and real account statements to attract fresh victims, while the losers are quietly discarded or convinced to reinvest.
________________________________________
Why the scam works
• The proof are authentic – Screenshots and MT4/MT5 statements for the winners are real.
• Survivorship bias – Prospects only see the successes, never the failures.
• Hope psychology – Losers believe “next time” will be different (and it can be if they end up in the "winner group" next time
________________________________________
Final word
If someone promises to double your account quickly and safely — walk away.
Real trading is about risk management and long-term consistency, not betting your capital on a 50/50 gamble.
Don’t be the next screenshot in a scammer’s sales pitch. 🚀
P.S.
Stop believing they “made you money on purpose” at the beginning and then “lost it on purpose” after you deposited more.
If they truly had the skill to do that, they wouldn’t need to be scammers in the first place.
The reality is simple — once you put in more money, you just happened to land on the losing side of their scam.
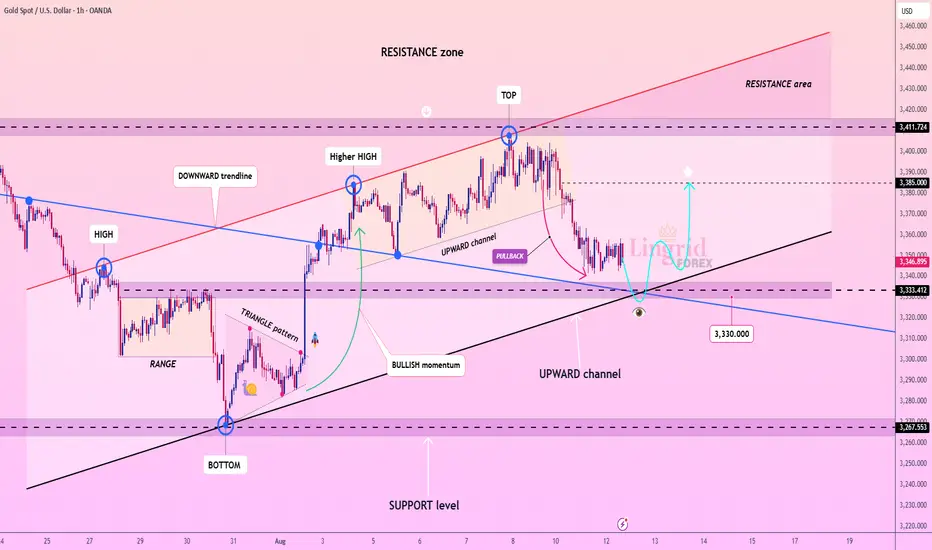
Lingrid | GOLD Short-Term Correction From Psychological LevelOANDA:XAUUSD is currently retesting the broken triangle structure from below, having rebounded from the ascending support zone. The price is approaching a confluence near 3,400–3410, where prior breakdown and resistance meet. If this level holds as resistance, the setup favors a bearish continuation toward 3,340 and possibly deeper. The broader structure shows lower highs and increasing rejection pressure below the resistance zone.
📉 Key Levels
Sell trigger: 3,400 rejection
Sell zone: 3,398.660–3,410
Target: 3,340
Invalidation: Break and hold above 3,410
💡 Risks
Momentum from recent rebound could challenge resistance
A higher low formation could tilt sentiment bullish
External factors (Fed, inflation data) may inject volatility beyond the range
If this idea resonates with you or you have your own opinion, traders, hit the comments. I’m excited to read your thoughts!

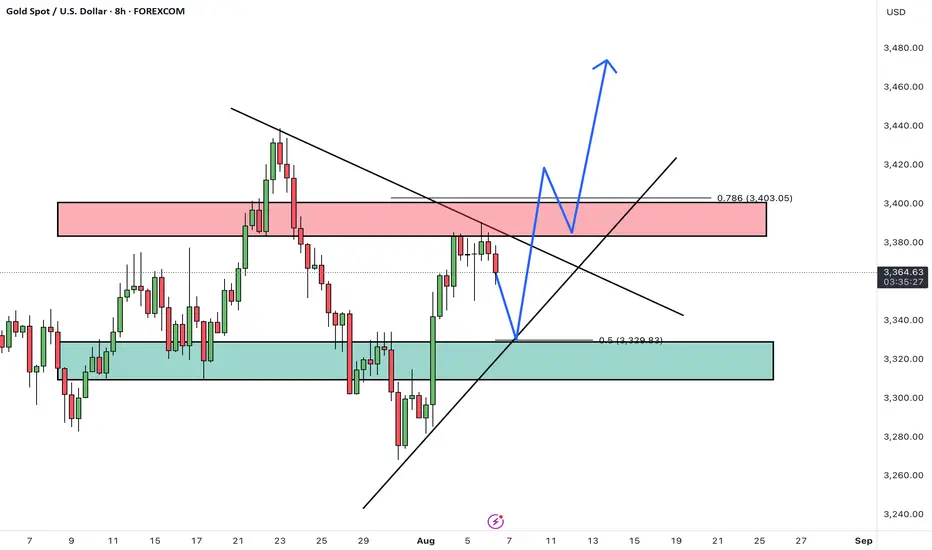
Lingrid | GOLD Anticipating a Trend Continuation Amid PullbackOANDA:XAUUSD is pulling back within the upward channel after topping near the 3,410 resistance zone. Price is currently holding above 3,330 support and aligning with the channel base, signaling potential for a bullish rebound. A push above 3,350 could open the way toward 3,385, while a drop under 3,315 risks deeper correction.
📉 Key Levels
Buy trigger: Break above 3,350
Buy zone: 3,328–3,350
Target: 3,385
Invalidation: Close below 3,320
💡 Risks
Failure to hold upward channel support
Strengthening USD pressuring gold
Sudden macroeconomic news impacting safe-haven demand
If this idea resonates with you or you have your own opinion, traders, hit the comments. I’m excited to read your thoughts!
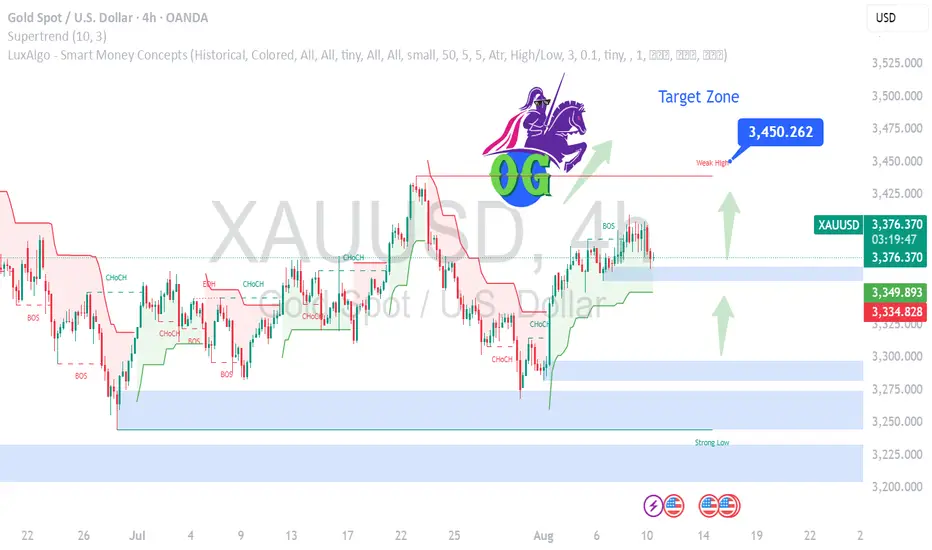
Gold Shines Bright - Strong Buy Zone XAUUSD Buy Setup – Gold is maintaining strong bullish momentum after holding the 3375 support level. Market sentiment remains positive, with buyers stepping in and pushing price higher. As long as price sustains above 3375, the path of least resistance remains to the upside.
The next bullish targets are set at 3425 and 3450, where we expect potential profit-taking. A break and close above 3425 could accelerate momentum toward 3450. Traders should monitor intraday pullbacks for fresh buying opportunities, keeping stop-losses below the support zone to protect capital.
Gold 30Min Engaged ( Bullish Entry Detected )Time Frame: 30-Minute Warfare
Entry Protocol: Only after volume-verified breakout
🩸Bullish Reversal - 3340
➗ Hanzo Protocol: Volume-Tiered Entry Authority
➕ Zone Activated: Dynamic market pressure detected.
The level isn’t just price — it’s a memory of where they moved size.
Volume is rising beneath the surface — not noise, but preparation.
🔥 Tactical Note:
We wait for the energy signature — when volume betrays intention.
The trap gets set. The weak follow. We execute.
XAU/USD | Gold at Make-or-Break $3400! BUY or SHORT ? (READ)By analyzing the gold chart on the 4-hour timeframe, we can see that, as expected from the previous analysis, the price began to rise and gained over 250 pips, reaching the $3409 supply zone. Upon hitting this key level, gold faced selling pressure and dropped more than 290 pips down to $3380. When it returned to this important level, strong buying stepped in again, and it is now trading around $3391.
The total return from this analysis so far has been over 540 pips. If gold manages to hold above $3400, the next upside targets will be $3409, $3416, and $3419. Keep an eye on the $3419–$3434 zone for potential reactions. Show some strong support for this analysis, friends, and stay tuned for direct trade setups based on it!
THE Previous Analysis :
Best Regards , Arman Shaban

XAU/USD | Gold at a Turning Point – Breakout or Breakdown Ahead?By analyzing the gold chart on the 4-hour timeframe, we can see that after our last analysis, gold continued its correction and dropped to $3358. It’s currently trading around $3367, and for the bullish scenario to remain valid, we need to see price hold above $3358 and soon close above $3370. If this happens, another bullish move could follow.
Otherwise, if gold breaks and stabilizes below $3358, this scenario will be invalidated, and the alternative outlook suggests further downside toward $3349 and $3339. This analysis will be updated — and don’t forget to show your support, friends!
Please support me with your likes and comments to motivate me to share more analysis with you and share your opinion about the possible trend of this chart with me !
Best Regards , Arman Shaban

xauusd (GOLD): a signal Hi guys!
Key Technical Points:
Ascending Channel:
Price action has been moving within a well-defined ascending channel.
Currently, the price has pulled back and is approaching the lower boundary of this channel.
This lower boundary often acts as a support area where buyers might step in.
Support Zone (Red Box):
The red highlighted area, around $ 3,340-$ 3,350 USD, is a key support zone.
This zone aligns w ith the lower boundary of the channel , adding more weight to the support.
Price is currently testing this area, which could act as a springboard for the next upward move.
Resistance Zone (Blue Box):
The upper resistance zone between roughly 3,425 and 3,440 USD is a major target for bulls.
This is a previous high area where sellers might re-enter the market.
-------------------------------------------------------
Trade Idea:
Long Position:
Entry could be considered near the lower boundary of the channel and the red support zone (around 3,340-3,350 USD).
Stop loss placement: Just below the red support zone to limit downside risk.
Target: The upper resistance zone at around 3,425-3,440 USD.

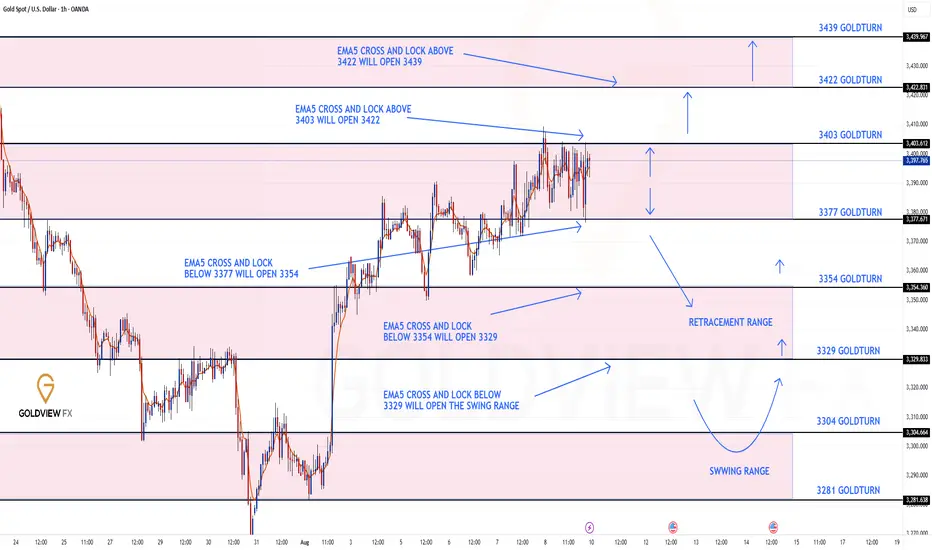
GOLD 1H CHART ROUTE MAP UPDATE & TRADING PLAN FOR THE WEEKHey Everyone,
Please see our updated 1h chart levels and targets for the coming week.
We are seeing price play between two weighted levels with a gap above at 3403 and a gap below at 3377. We will need to see ema5 cross and lock on either weighted level to determine the next range.
We will see levels tested side by side until one of the weighted levels break and lock to confirm direction for the next range.
We will keep the above in mind when taking buys from dips. Our updated levels and weighted levels will allow us to track the movement down and then catch bounces up.
We will continue to buy dips using our support levels taking 20 to 40 pips. As stated before each of our level structures give 20 to 40 pip bounces, which is enough for a nice entry and exit. If you back test the levels we shared every week for the past 24 months, you can see how effectively they were used to trade with or against short/mid term swings and trends.
The swing range give bigger bounces then our weighted levels that's the difference between weighted levels and swing ranges.
BULLISH TARGET
3403
EMA5 CROSS AND LOCK ABOVE 3403 WILL OPEN THE FOLLOWING BULLISH TARGETS
3422
EMA5 CROSS AND LOCK ABOVE 3422 WILL OPEN THE FOLLOWING BULLISH TARGET
3439
BEARISH TARGETS
3377
EMA5 CROSS AND LOCK BELOW 3377 WILL OPEN THE FOLLOWING BEARISH TARGET
3354
EMA5 CROSS AND LOCK BELOW 3354 WILL OPEN THE FOLLOWING BEARISH TARGET
3329
EMA5 CROSS AND LOCK BELOW 3329 WILL OPEN THE SWING RANGE
3304
3281
As always, we will keep you all updated with regular updates throughout the week and how we manage the active ideas and setups. Thank you all for your likes, comments and follows, we really appreciate it!
Mr Gold
GoldViewFX
DeGRAM | GOLD rebound from the support line📊 Technical Analysis
● XAUUSD is consolidating within a narrowing wedge, holding above the 3,309–3,320 support zone while repeatedly testing the upper boundary.
● A breakout above 3,366 would confirm bullish momentum toward 3,435, with dips likely finding buyers at mid-channel support.
💡 Fundamental Analysis
● Softer US PPI data and declining Treasury yields have renewed interest in non-yielding assets like gold.
● Rising central bank gold purchases in July strengthen medium-term demand prospects.
✨ Summary
Buy above 3,366; target 3,435. Setup remains valid while holding above 3,309.
-------------------
Share your opinion in the comments and support the idea with a like. Thanks for your support!
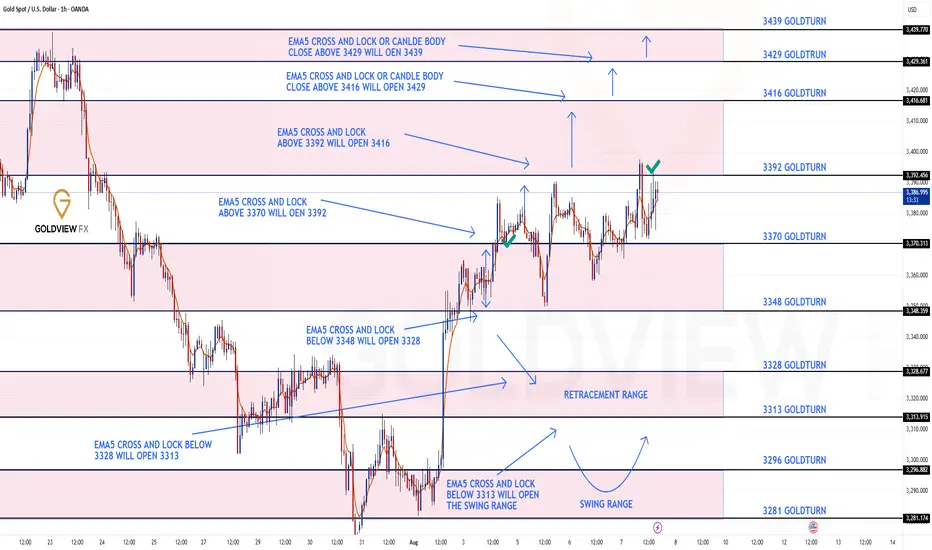
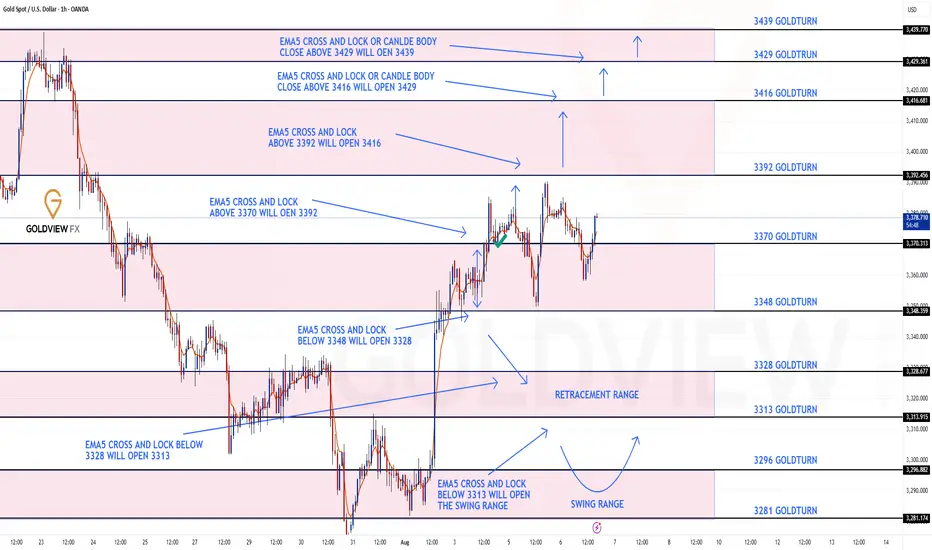
GOLD ROUTE MAP UPDATEHey Everyone,
Another great day in the markets with our chart idea playing out exactly as planned, allowing us to buy the dips.
We’re seeing a repeat of yesterday's setup, the 3392 gap remains open after the EMA5 lock above 3370. We're getting drops into the lower Goldturn zones, giving us great opportunities to buy back in.
As long as we don’t get a confirmed lock below 3348, we continue to chase the open gap above at 3392.
We will keep the above in mind when taking buys from dips. Our updated levels and weighted levels will allow us to track the movement down and then catch bounces up.
We will continue to buy dips using our support levels taking 20 to 40 pips. As stated before each of our level structures give 20 to 40 pip bounces, which is enough for a nice entry and exit. If you back test the levels we shared every week for the past 24 months, you can see how effectively they were used to trade with or against short/mid term swings and trends.
The swing range give bigger bounces then our weighted levels that's the difference between weighted levels and swing ranges.
BULLISH TARGET
3370 - DONE
EMA5 CROSS AND LOCK ABOVE 3370 WILL OPEN THE FOLLOWING BULLISH TARGETS
3392
EMA5 CROSS AND LOCK ABOVE 3392 WILL OPEN THE FOLLOWING BULLISH TARGET
3416
EMA5 CROSS AND LOCK ABOVE 3416 WILL OPEN THE FOLLOWING BULLISH TARGET
3429
EMA5 CROSS AND LOCK ABOVE 3429 WILL OPEN THE FOLLOWING BULLISH TARGET
3439
BEARISH TARGETS
3348
EMA5 CROSS AND LOCK BELOW 3348 WILL OPEN THE FOLLOWING BEARISH TARGET
3328
EMA5 CROSS AND LOCK BELOW 3328 WILL OPEN THE FOLLOWING BEARISH TARGET
3313
EMA5 CROSS AND LOCK BELOW 3313 WILL OPEN THE SWING RANGE
3296
3281
As always, we will keep you all updated with regular updates throughout the week and how we manage the active ideas and setups. Thank you all for your likes, comments and follows, we really appreciate it!
Mr Gold
GoldViewFX
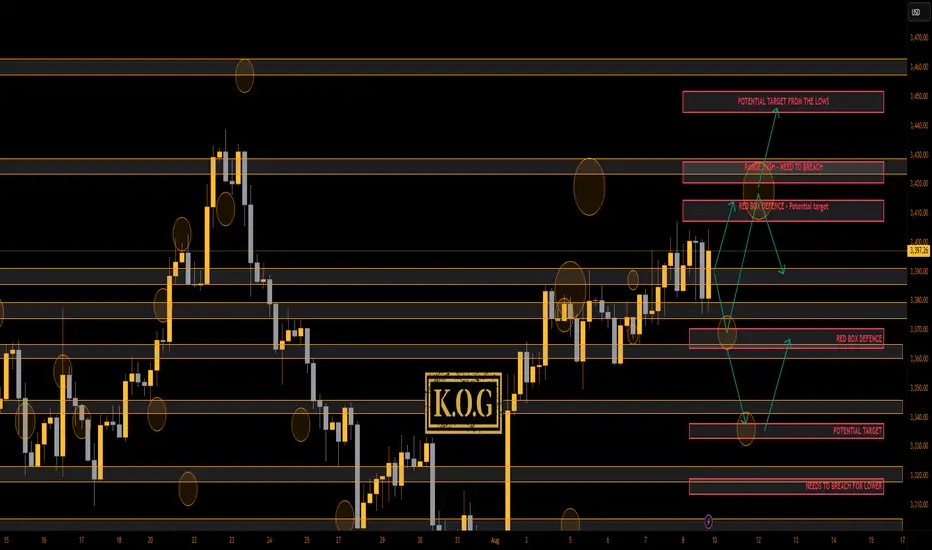
THE KOG REPORT THE KOG REPORT:
In last week’s KOG Report we shared the NFP chart and the KOG Report chart for the wider community. We said we would be looking for price to support below at the red box and then push upside into the higher levels and the red box targets. We also suggested the shorting region and the target level for that trade which as you can see worked well playing level to level, point to point. We also completed all of our target levels without the breach and even though it was choppy, we completed numerous Excalibur targets in Camelot.
A decent week not only on Gold but also the other pairs we trade an analyse.
So, what can we expect in the week ahead?
I have indications of higher pricing, however, how low can the take it before they then attempt higher? For that reason, let’s stick with the 4H as this the most effective for our strategy and analysis and lets look at the key levels!
We have the level above 3408-11 which is a reasonable target for this move, but there is red box defence there which will need to be attempted and broken to go higher. If we resist at that level with extension level 3430-5, there is a chance we can correct the move all the way back down into the 3350-40 levels before we again get an opportunity to capture that long trade!
We have no news tomorrow so again, more of a chop and ranging price action is on the cards, with the support level being 3375-70 for the Asian session and resistance being the 3408-11 level. My Red box indi’s are stretched, my daily liquidity indicator is stretched, so I would say please play caution on the markets as they are extremely fragile at the moment.
KOG’s Bias for the week:
Bullish above 3365 with targets above 3408, 3410, 3415 and above that 3420
Bearish below 3365 with targets below 3359, 3355, 3350 and below that 3345
RED BOX TARGETS: (You can see how effective these are so please make use of these together with the analysis and bias we share. It all goes together, without PRICE ACTION knowledge you only have hope)
Break above 3406 for 3407, 3410, 3420, 3429, 3430 and 3435 in extension of the move
Break below 3395 for 3393, 3385, 3380 and 3370 in extension of the move
Please do support us by hitting the like button, leaving a comment, and giving us a follow. We’ve been doing this for a long time now providing traders with in-depth free analysis on Gold, so your likes and comments are very much appreciated.
As always, trade safe.
KOG
Some Traders Only See The Bait, But Not The HookLet’s get one thing straight: if you seriously think you’ve discovered a “secret” setup that you saw in a YouTube video with 1 million views, and it’s right there on the chart – clean, centered, elegant – congrats. You’re already on the hook.
Welcome. You’re liquidity.
🧼 “Clean breakout” = dig your own grave, enthusiastically
It’s honestly beautiful how thousands of traders see the same “clean breakout,” the same “double bottom,” the same “bullish engulfing,” and all believe they’re geniuses. They enter confidently, with a “perfect oversold” RSI, a “confirmed” MACD, and maybe even the moon in Capricorn.
Then, of course, the market spits their orders back in their face at 300 km/h.
Standard response? “It was manipulation.”
No, bro. It was bait. You were the fish. You bit. The market says thank you for your participation and moves on.
🧠 If you see what everyone else sees, it’s useless
What most don’t get is this: if a setup looks “too clean,” it will most probably not work. If you see it, everyone sees it. If everyone thinks something is “about to explode,” that means it’s being used – to attract orders. Your money. Your emotions. Exactly what bigger players need to exit, gracefully – on your dime.
The market is like an exclusive party: if you found out about it, it’s already lame.
💅 That warm feeling of “certainty”? Yeah, you’re screwed
The irony? The moments when a trader feels most certain are exactly the moments when they’re most exposed. The market wants you to feel relaxed. Wants you to think “this is the one.” It’s like a drug dealer giving you your first hit for free, with a smile. Not because he likes you, but because he knows you’re hooked.
So when you feel “sure” – check your mouth. You might already be on the hook.
🤡 “But it was an A+ setup!”
Of course it was. The A+ setup – seen, tested, recycled, and re-sold thousands of times. The one that works great in textbooks, backtests, webinars, and in the wet dreams of those who think they just need “a perfect strategy”.
But the market isn’t here to validate your setup. It’s here to take your money. From whom? From those who still think it’s a “fair game.”
Spoiler: it’s not.
🤔 If you’re gonna bite, at least ask: who’s holding the line?
Look at any “clear opportunity” and ask the magic question:
“Who benefits from what I’m seeing right now?”
If the answer is “me ” – you’re in trouble.
If you don’t know – you’re in even more trouble.
The market is full of traps dressed up as opportunities. Hooks that move slowly, with sexy candles, to lure in the kind of trader who only learned the “buy low, sell high” part – but skipped the chapter on “ don’t bite every shiny thing you see. ”
🎬 Bottom line:
The market doesn’t try to fool you. You’re already doing that yourself.
The market doesn’t need complex tricks. All it needs is people in a hurry, easy to excite, who never ask the right questions. Who see a green candle and think, “This is it.”
Who don’t bother looking for the hook because they’re too busy dreaming about the profits.
If you want to trade seriously, it’s simple:
Don’t ask “Where do I enter?”
Ask: “Where do they want me to enter?”
And if you’re already there… run.
🧭 Alright, now seriously
( I mean, I tried to be funny above – but let’s get real for a second )
Let’s look at a few concrete recent examples from the market:
📉 EUR/USD
On Monday, I mentioned that price was testing resistance and could offer a nice selling opportunity.
But… I changed my mind. (You know... dynamic probabilities )
The pattern was way too clean, too clear, too pretty.
And of course, price broke above.
Because if it looks too obvious – it’s probably already bait.
🟡 XAU/USD (Gold)
Since yesterday, I’ve been talking about the potential for an upside breakout.
Why?
Because 3380–3385 resistance zone is way too clean.
Everyone sees it. Everyone talks about it. Everyone sells there.
Which makes me ask: if everyone’s expecting a drop… isn’t that, once again, just bait?
Here is my Gold analysis from today:
BTC/USD
We all see the confluence of support. The perfect alignment. The setup that screams “Buy me.”
But what if it’s too perfect to be true?
What if it’s just another classic trap – the kind that gets everyone excited before the drop comes.
💡 Now don’t get me wrong – this isn’t about abandoning technical analysis.
Far from it. For me, it’s essential.
But we’ve got to use it differently.
✅ Not as a treasure map
❌ But as a battlefield map showing us where the traps are laid
So maybe… don’t bite like a lizard the second something shiny pops up on your chart.
Instead, ask yourself:
“Does this make sense… or does it make too much sense? ”
Because in trading, when something looks too clean – that’s exactly when it gets dirty.
Disclosure: I am part of TradeNation's Influencer program and receive a monthly fee for using their TradingView charts in my analyses and educational articles.
GOLD ROUTE MAP UPDATEHey Everyone,
This is a follow-up update on our 1H chart and what can I say, another amazing result!
After hitting our bullish target at 3370 earlier this week, we confirmed the EMA5 cross and lock above 3370 confirming 3392, which I continued to highlight and remind as we bought the dips throughout the week. And today, we finally completed 3392 to perfection.
Next, we’ll be watching for an EMA5 lock above 3392 for a potential continuation. If that fails to lock, we may see some range play between 3392 and 3370.
We will keep the above in mind when taking buys from dips. Our updated levels and weighted levels will allow us to track the movement down and then catch bounces up.
We will continue to buy dips using our support levels taking 20 to 40 pips. As stated before each of our level structures give 20 to 40 pip bounces, which is enough for a nice entry and exit. If you back test the levels we shared every week for the past 24 months, you can see how effectively they were used to trade with or against short/mid term swings and trends.
The swing range give bigger bounces then our weighted levels that's the difference between weighted levels and swing ranges.
BULLISH TARGET
3370 - DONE
EMA5 CROSS AND LOCK ABOVE 3370 WILL OPEN THE FOLLOWING BULLISH TARGETS
3392 - DONE
EMA5 CROSS AND LOCK ABOVE 3392 WILL OPEN THE FOLLOWING BULLISH TARGET
3416
EMA5 CROSS AND LOCK ABOVE 3416 WILL OPEN THE FOLLOWING BULLISH TARGET
3429
EMA5 CROSS AND LOCK ABOVE 3429 WILL OPEN THE FOLLOWING BULLISH TARGET
3439
BEARISH TARGETS
3348
EMA5 CROSS AND LOCK BELOW 3348 WILL OPEN THE FOLLOWING BEARISH TARGET
3328
EMA5 CROSS AND LOCK BELOW 3328 WILL OPEN THE FOLLOWING BEARISH TARGET
3313
EMA5 CROSS AND LOCK BELOW 3313 WILL OPEN THE SWING RANGE
3296
3281
As always, we will keep you all updated with regular updates throughout the week and how we manage the active ideas and setups. Thank you all for your likes, comments and follows, we really appreciate it!
Mr Gold
GoldViewFX