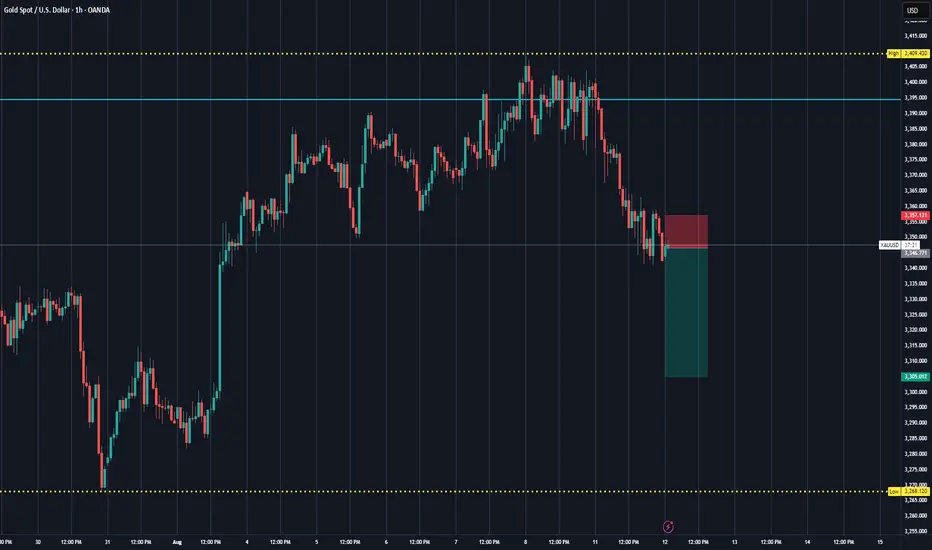
Short-time short on gold, planning to long soon🔍Gold (XAUUSD) Technical Analysis – Dual Bias Strategy
Current Trade: Short-term Sell
Overall Plan: Preparing for a Long (Buy) Entry
Thoughts
I’m currently taking advantage of the short-term bearish pressure on gold but staying prepared for a long re-entry once price hits key demand zones. This dual-bias strategy allows me to trade with the trend while managing risk and maximizing opportunities on both ends.
XAUUSD trade ideas
Gold comets that came in Earth's orbit Gold mining is very popular. They are many different products and Earth's orbit and they have all become a part of mining since the beginning of time in which there are many more products to be mined for.
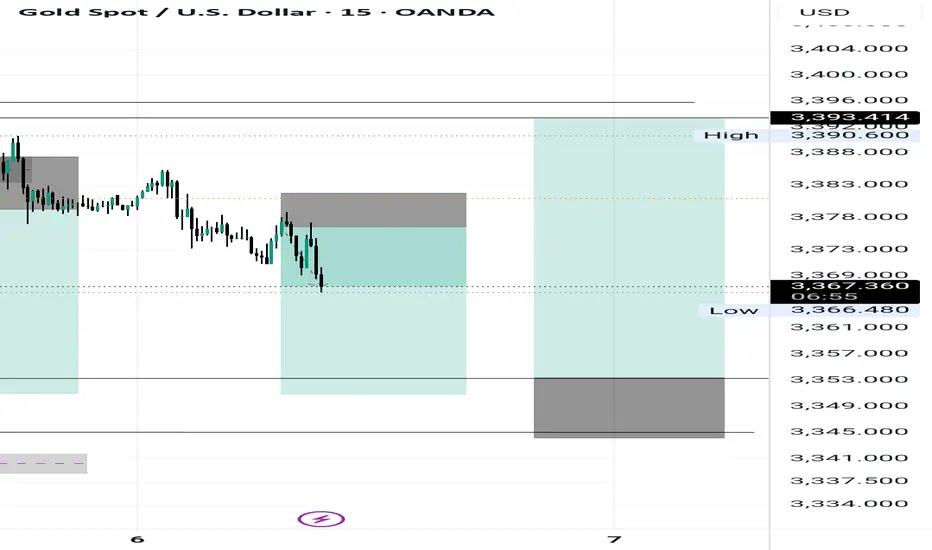
Wait for a pullback and then test the previous high#XAUUSD
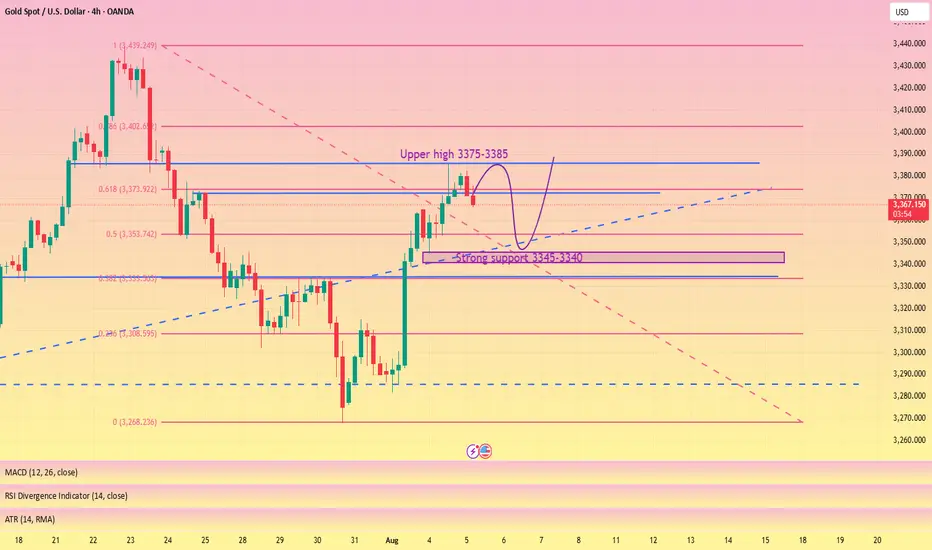
The gold market closed positively on the daily chart, with strong support near 3345-3340 below. The market trend is still dominated by bulls,🐂 but the daily moving average support is too far from the high point. It is not ruled out that it may retreat to the moving average support near 3345-3340,📊 and then rise again.🚀
From the monthly chart, 🌙although the monthly chart closed positive, the market is generally converging at a high level. Upper resistance remains, and a breakout is unlikely without breaking through this resistance level (no further discussion will be given).📉
Judging from the weekly chart, the Bollinger Bands have shrunk, and the MACD indicator has formed a death cross with large volume, indicating weak fluctuations at the weekly level.😩
Judging from the daily chart, 📊the current technical indicators are tending to the zero axis, and the rapid upward correction of the smart indicator indicates that the price fluctuation tends to rebound. The current focus is on yesterday's high around 3385. It is expected to break through 3430. The lower support Bollinger band middle track and moving average tend to stick together around 3346-3340.🌈
Judging from the hourly chart and 4H chart, 📊the overall rhythm tends to fluctuate and fall. The short-term pressure from above is around 3375-3385, and a break above will definitely lead to an increase.📈
On the whole, pay attention to yesterday's NY starting point near 3365-3360, and the strong support below is 3346-3340. The hourly and 4H charts tend to fluctuate and fall, so for short-term trading we need to short on rallies. 📉
Intraday trading suggestions are as follows:
1. Consider going long currently around 3365-3360📈, targeting 3374-3380🎯. If it breaks through, look for 3400.
2. Go long if it retraces below 3355-3340, targeting 3375-3385. Wait for further adjustments.🐂
3. If the price first reaches the resistance level of 3375-3385 and holds, consider going short with a small position and anticipate a pullback towards 3365-3355.🐻
1 hrs BPRClear Buying area is near BPR
Look in the 1 hr BPR area, once it is tapped make to check for confirmation in small time frame for entry
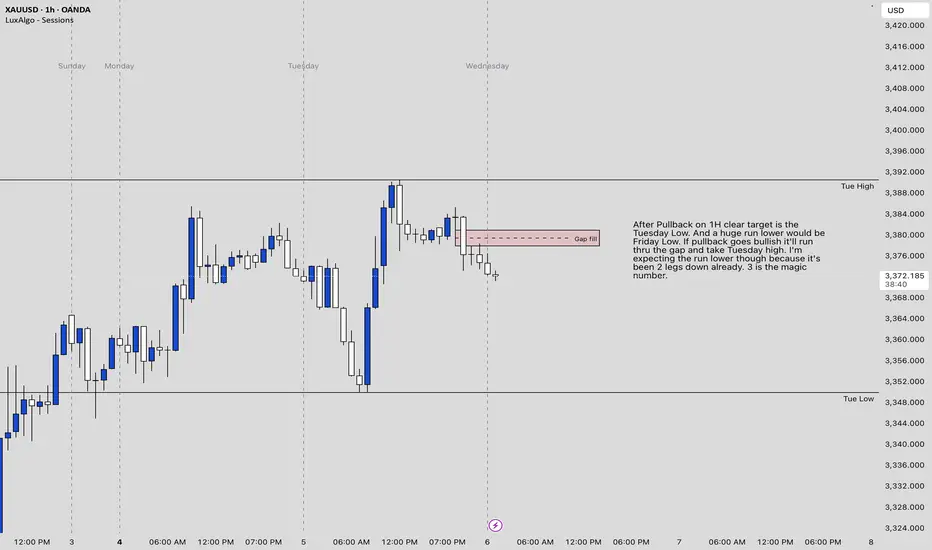
Gold Analysis - Possible big move inboundI left it all on the chart. But it appears gold is prepping for the third leg down after a massive move up. It could take a few days but it's free range all the way to Friday's low. It could be invalidated if the pullback is strong enough. But the gap was filled and its been 2 consecutive pushes downwards. A huge drop seems imminent from my perspective.
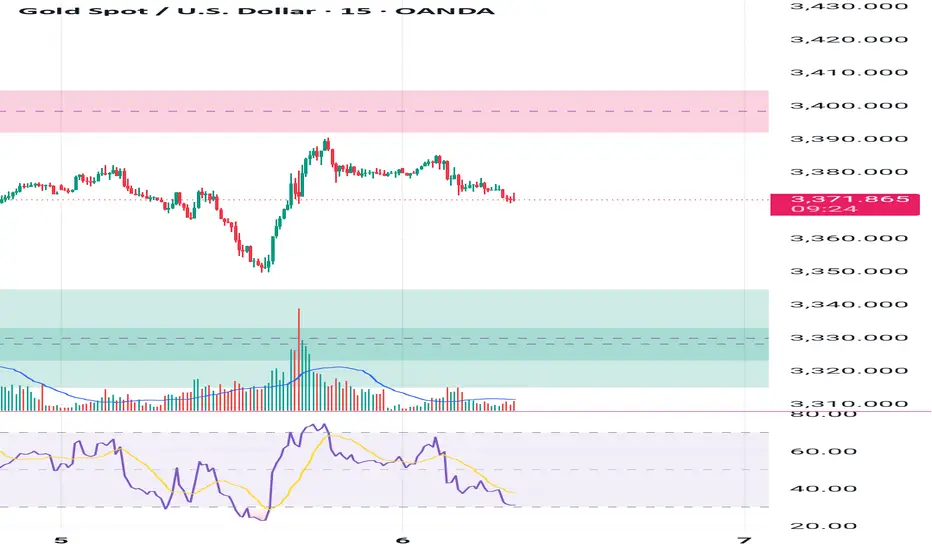
XAUUSD – Is This a Short-Term Top?1. What happened yesterday
After dipping to 3340 in early trading—just shy of the key 3335 support where I was looking to buy—Gold resumed its bullish momentum that began on Friday. During the New York session, price spiked to a new intraday high near 3385. However, the final hour brought a pullback, and since then, Gold has entered a tight consolidation range.
2. Key question: Is Gold forming a short-term top?
The 1H chart shows a new failed breakout attempt above 3380 during the Asian session. This left behind a minor double top, with the neckline sitting around 3370. That level is especially important—it aligns with a short-term rising trendline.
3. Why a correction might follow
• Price rejected above 3380 twice
• Small double top visible on LTF
• 3370 is a make-or-break level (neckline + trendline)
• A break below could trigger a correction of the +1000 pips rally from Friday’s lows
4. Trade plan
While there is some evidence of a potential top, this remains a high-risk and aggressive short.
Any attempt to trade against the trend should be done with tight stops and small size .
5. Final thoughts
A short-term top could indeed be in place, but Gold must break below 3370 to unlock deeper downside. Until then, the bulls are still in control—just taking a breather. ⚖️
Disclosure: I am part of TradeNation's Influencer program and receive a monthly fee for using their TradingView charts in my analyses and educational articles.
Crystal Ball Forecast for Gold (XAUUSD)🔮 Crystal Ball Forecast for Gold (XAUUSD)
Current Price: 3372
Medium-Term Direction: 🔻 DOWN
✅ My Forecast: GOLD WILL GO DOWN from 3372
🔍 Why? (Technical Reasons Supporting Bearish Outlook)
1. Gann Price Vibration (From recent high ~3385)
3372 = 45° level – key resistance level
Price rejected at 3375–3385 zone multiple times
If 3375 holds as resistance, next vibration levels:
3335 (Gann 45° down)
3284 (Gann 90° down)
3250 (Gann 120° down)
2. Elliott Wave
Looks like Wave 5 (ending diagonal) completed at 3385
Current price at 3372 = classic "after top" trap zone
Next structure likely forming ABC correction or new bearish impulse
Projection:
Wave A → 3335
Wave C → 3280–3250
3. Price Action + Candle Behavior
Strong upper wicks around 3375–3380
Lower highs forming = distribution pattern
MACD & RSI divergence visible on 4H/1D
📉 Medium-Term Bearish Targets
Target Price Reason
3335 Gann 45° down, Wave A low
3284 Gann 90° down, Wave C
3250 Gann 120°, Cycle
3183 Gann 180°, major support
📌 Summary Forecast
✳️ Gold is topping out.
✳️ Bearish move toward 3280–3250 is highly likely.
✳️ Best entry = on rejection from 3375–3380 zone
✳️ Stop = above 3390
✳️ Hold short for 2–3 weeks or until target reached
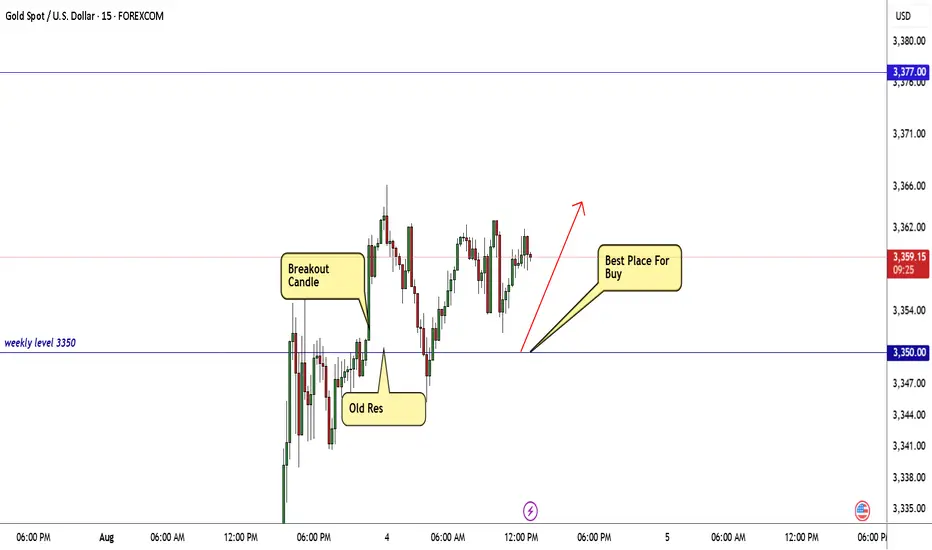
GOLD Breakout Done , Long Setup Valid To Get 150 Pips !Here is My 15 Mins Gold Chart , and here is my opinion , we finally above 3350.00 and we have a 30 Mins Candle closure above it And Perfect Breakout , so i`m waiting the price to go back and retest this res and new support and give me a good bullish price action to can enter a buy trade and we can targeting 100 to 150 pips .
Reasons To Enter :
1- New Support Created .
2- Bullish Price Action .
3- Bigger T.F Giving Good Bullish P.A .
4- Clean Breakout .
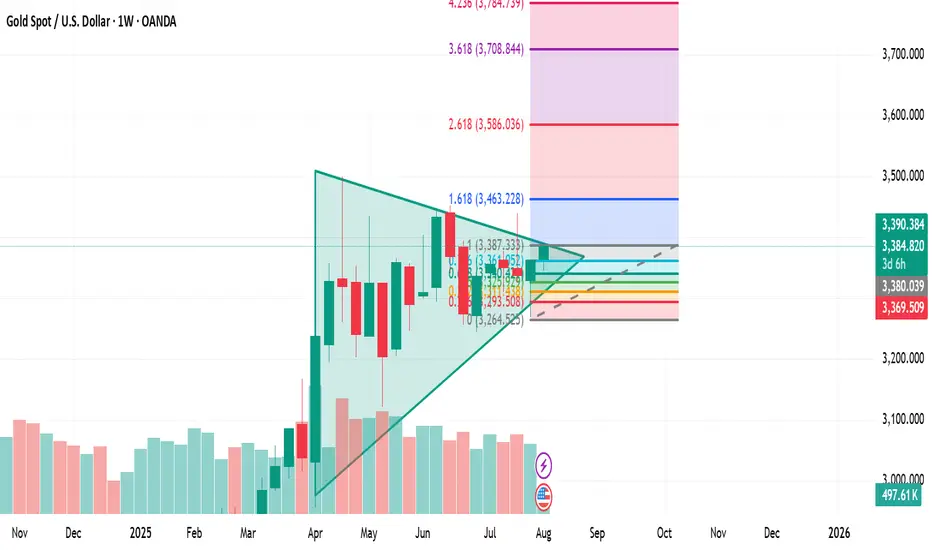
Gold Ascending Triangle Breakout: Targeting $3,463XAU/USD is currently trading at $3,385.91 and has been consolidating in a tight ascending triangle pattern on the weekly chart for the past four months. This structure has formed after a strong impulse move earlier in the year and is now coiling beneath a significant resistance zone at $3,386 to $3,400. Each weekly rejection from this level has added strength to the ceiling, while the consistent formation of higher lows suggests institutional accumulation. Volume has been declining steadily during this period, a classic sign of compression and imminent breakout potential. Fibonacci extensions from the April impulse leg point toward upside targets of $3,463 (1.618), $3,586 (2.0), and $3,708 (2.618). A weekly close above $3,400 with strong volume would confirm the breakout and likely trigger a momentum-driven move toward these levels. Invalidation would occur with a weekly close below $3,330 or a clear break of trendline support. In the current macroeconomic climate—defined by central bank uncertainty, inflationary pressures, and geopolitical tension—gold remains a key hedge. This 4-month consolidation reflects not weakness, but pressure building beneath the surface. As with all sustained triangles, the longer the base, the stronger the breakout. A move from this structure could define the next major phase for gold heading into Q4 2025.
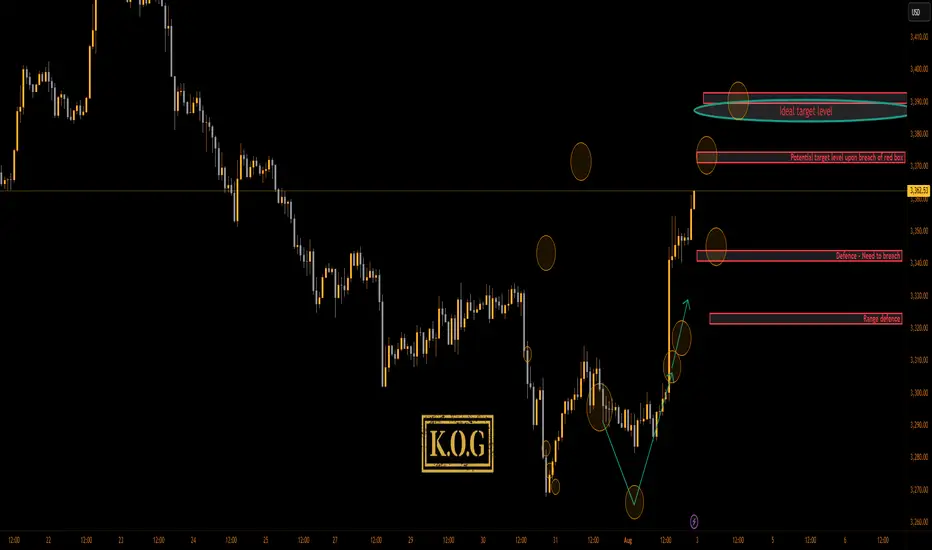
THE KOG REPORT - NFP UPDATE 1H 1H:
This is the chart we used last week for the FOMC and NFP KOG Reports. From the chart we can see the low was captured for FOMC and NFP didn’t give us an undercut low. We’ve kept the potential target box from the Report and for now we’ll stick with it. Red box defence is active below at the 3340-5 level and the ideal target stands above in the oval as long as we remain above the 3340 bias level.
KOG’s bias for the week:
Bullish above 3340 with targets above 3370, 3373, 3379 and above that 3384
Bearish on break of 3340 with targets below 3330, 3320 and below that 3310
RED BOXES:
Break above 3365 for 3372, 3375, 3379, 3384 and 3390 in extension of the move
Break below 3350 for 3346, 3340, 3335 and 3330 in extension of the move
Please do support us by hitting the like button, leaving a comment, and giving us a follow. We’ve been doing this for a long time now providing traders with in-depth free analysis on Gold, so your likes and comments are very much appreciated.
As always, trade safe.
KOG
Gold spot/ U.S DollarHere is my first prediction of gold in next few days.
As you can see on the chart, I expect the price to experience decline, then goes for rebounding from 3,301 to 3,338. It won't be farfetched to consider the price starting a rally to retest the resistance above.

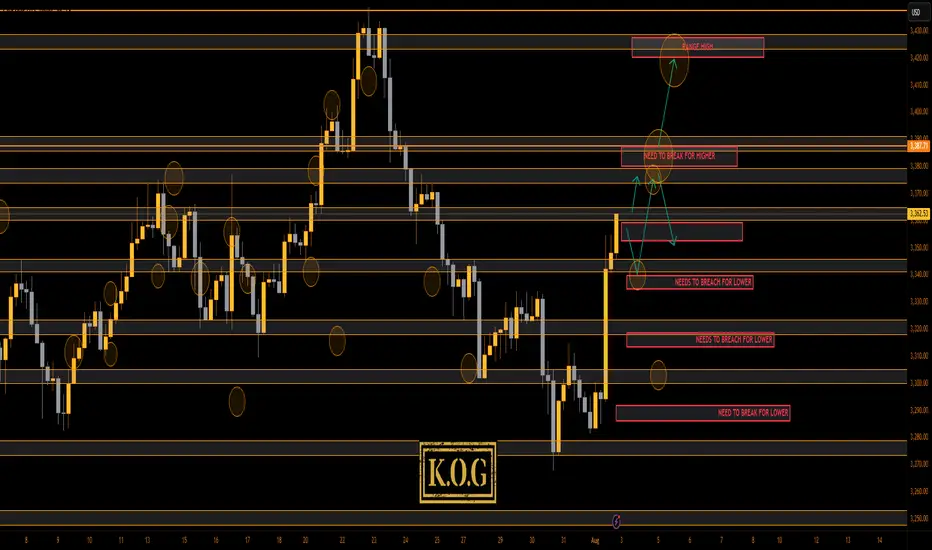
THE KOG REPORT THE KOG REPORT:
Due to there being no KOG Report last week so we won’t reference it, however, we did post the FOMC and NFP reports for the wider community to help them navigate the moves, which as you can see from the pinned ideas worked well.
So, what can we expect in the week ahead?
After the move we observed for NFP on Friday we would like to see some retracement in the sessions ahead. Looking at the 4H chart we have a reversal in play, but we still have no break out of this range! We’re simply playing the highs and the lows while price chops and whipsaws within it, which could be causing some new traders confusion and frustration.
We have a support level below 3350 and below that 3340 which will be the bias level for this week as bullish above. We then have the intra-day resistance level 3365-70 while there is an extension of the move into the 3385 level. Ideally, what we want to see here is support levels hold or a quick continuation on the open into the higher red box levels and the a potential for a RIP. That RIP however is most likely going to be a scalp unless we come down and break below that 3345-50 level.
We want to see how this reacts at these higher levels and if we do get a break of the boxes, otherwise, there is a chance we see another curveball like we suggested a couple of weeks ago, and we correct this whole move back downside with the first hurdle being 3340-35 on the flip.
We’re going to keep it simple here for now and usual we’ll update during the week once we have a clearer understanding of whether this wants to attempt a new all time high or not.
Please note, our liquidity indicator is suggesting a little higher but a pullback is on the way.
We’ll keep you updated.
KOG’s bias for the week:
Bullish above 3340 with targets above 3370, 3373, 3379 and above that 3384
Bearish on break of 3340 with targets below 3330, 3320 and below that 3310
RED BOXES:
Break above 3365 for 3372, 3375, 3379, 3384 and 3390 in extension of the move
Break below 3350 for 3346, 3340, 3335 and 3330 in extension of the move
Please do support us by hitting the like button, leaving a comment, and giving us a follow. We’ve been doing this for a long time now providing traders with in-depth free analysis on Gold, so your likes and comments are very much appreciated.
As always, trade safe.
KOG
Gold 4H timeframe Based on the chart my shared (Gold 4H timeframe with Ichimoku cloud), here are the identified target points:
📈 Upside Targets:
1. First Target: 3380
This is marked just above the Ichimoku cloud breakout.
It is a short-term resistance zone.
2. Second Target: 3420
This is the higher target zone indicated in the chart.
It aligns with a previous high and potential resistance area.
---
🟡 Key Support:
Support Zone: Around 3322 – 3353
Price needs to hold above this zone to maintain the bullish momentum.

Gold is in very nice bearish opportunity ahead.Gold is in very nice bearish opportunity ahead. The level of 3000$ should be good for testing as a strong support for a next bull run. My tp now after confirmation is in betwwen a zone 3000-3050$.

3331 liquidity scan complete, recovery⭐️GOLDEN INFORMATION:
Gold (XAU/USD) traded with a positive tone in Wednesday’s Asian session, extending Tuesday’s rebound from the $3,331 level — its lowest in a week and a half. July’s U.S. consumer inflation data, which came in broadly in line with expectations, strengthened market bets on a September rate cut by the Federal Reserve. This has kept the U.S. Dollar on the defensive, providing a tailwind for the non-yielding metal.
That said, optimism surrounding an extension of the U.S.–China trade truce and the U.S.–Russia summit aimed at ending the war in Ukraine could limit safe-haven demand and cap gold’s upside. Moreover, repeated failures to hold above the $3,400 mark suggest that stronger follow-through buying is needed before confirming a near-term bottom. Traders now await comments from key FOMC policymakers later on Wednesday for fresh directional cues.
⭐️Personal comments NOVA:
Gold price moves sideways 3330 - 3360, liquidity sweep completed 3330, recovery
⭐️SET UP GOLD PRICE:
🔥SELL GOLD zone: 3389- 3391 SL 3396
TP1: $3380
TP2: $3367
TP3: $3350
🔥BUY GOLD zone: $3304-$3302 SL $3297
TP1: $3315
TP2: $3325
TP3: $3338
⭐️Technical analysis:
Based on technical indicators EMA 34, EMA89 and support resistance areas to set up a reasonable BUY order.
⭐️NOTE:
Note: Nova wishes traders to manage their capital well
- take the number of lots that match your capital
- Takeprofit equal to 4-6% of capital account
- Stoplose equal to 2-3% of capital account
Lingrid | GOLD Weekly Market Analysis: Strong Bullish ReboundOANDA:XAUUSD market has demonstrated resilience with a strong bullish rebound following the NFP, suggesting that institutional buyers are stepping in at critical support levels. The precious metal is now testing key resistance zones that will determine whether the recovery can gain sustainable momentum.
The chart reveals a compelling technical setup with gold bouncing strongly just above the June low support zone around $3,265. This rebound has pushed price back above the $3,330 level and is now approaching the critical $3,400 resistance area. The strong bullish rebound after the NFP release indicates that the selling pressure faded, with buyers emerging at attractive levels near the June lows.
The previous pullback phase has been contained within the broader ascending channel structure, maintaining the overall bullish framework. The triangle pattern breakout to the downside appears to have been a false move, with the current rebound suggesting that the correction may be complete. The ability to hold above the previous week low has preserved the medium-term uptrend structure.
Key levels to monitor include the immediate resistance at $3,400 and the previous support-turned-resistance at $3,330. A decisive break above $3,400 would likely trigger renewed bullish momentum toward the $3,440-$3,465 zone, while failure to sustain above $3,330 could see another test of the June low support. The strong rebound from critical support levels suggests that the broader bullish bias remains intact, with this correction potentially setting up for the next leg higher.
If this idea resonates with you or you have your own opinion, traders, hit the comments. I’m excited to read your thoughts!

Current Trade, check myfxbook. Lets Go.So yeah just a idea of sell, enjoy. Also not much words yeah, just covering the brief area for the post to go through mate but yeah its a trade so trade it yeah.
GOLD 1H CHART ROUTE MAP UPDATE & TRADING PLAN FOR THE WEEKHey Everyone,
Please see our updated 1h chart levels and targets for the coming week.
We are seeing price play between two weighted levels with a gap above at 3370 and a gap below at 3348. We will need to see ema5 cross and lock on either weighted level to determine the next range.
We will see levels tested side by side until one of the weighted levels break and lock to confirm direction for the next range.
We will keep the above in mind when taking buys from dips. Our updated levels and weighted levels will allow us to track the movement down and then catch bounces up.
We will continue to buy dips using our support levels taking 20 to 40 pips. As stated before each of our level structures give 20 to 40 pip bounces, which is enough for a nice entry and exit. If you back test the levels we shared every week for the past 24 months, you can see how effectively they were used to trade with or against short/mid term swings and trends.
The swing range give bigger bounces then our weighted levels that's the difference between weighted levels and swing ranges.
BULLISH TARGET
3370
EMA5 CROSS AND LOCK ABOVE 3370 WILL OPEN THE FOLLOWING BULLISH TARGETS
3392
EMA5 CROSS AND LOCK ABOVE 3392 WILL OPEN THE FOLLOWING BULLISH TARGET
3416
EMA5 CROSS AND LOCK ABOVE 3416 WILL OPEN THE FOLLOWING BULLISH TARGET
3429
EMA5 CROSS AND LOCK ABOVE 3429 WILL OPEN THE FOLLOWING BULLISH TARGET
3439
BEARISH TARGETS
3348
EMA5 CROSS AND LOCK BELOW 3348 WILL OPEN THE FOLLOWING BEARISH TARGET
3328
EMA5 CROSS AND LOCK BELOW 3328 WILL OPEN THE FOLLOWING BEARISH TARGET
3313
EMA5 CROSS AND LOCK BELOW 3313 WILL OPEN THE SWING RANGE
3296
3281
As always, we will keep you all updated with regular updates throughout the week and how we manage the active ideas and setups. Thank you all for your likes, comments and follows, we really appreciate it!
Mr Gold
GoldViewFX

XAUUSD analysis - 1H FVG and OB setupsOn the 1H chart, price has made a sharp bullish move from the lower 1H OB zone (3,275 – 3,285) and is now hovering just below the 1H supply zone.
🔴 1H Supply Zone (OB):
3,354 – 3,368 → Price is consolidating here with no strong rejection yet.
🟢 1H Demand Zone (OB):
3,337 – 3,344 → First area to watch for potential bullish reaction.
👁 Mid-level support zone (waiting for confirmation):
3,310 – 3,320 → If price pulls back here and gives confirmation on lower timeframe, we’ll look for long setups.
📌 Trade scenarios:
1️⃣ Bullish: Wait for a retracement into 3,310 – 3,320, and if confirmed on LTF (3M–5M), go long.
2️⃣ If price drops deeper into the lower OB zone 3,275 – 3,285 and gives strong bullish reaction → potential long setup again.
3️⃣ Bearish: If price rejects the current OB zone (3,354 – 3,368) with confirmation → short entry targeting the green zones below (~3,320 or 3,310).
✅ Entry only after confirmation on lower timeframe
❌ No confirmation = no trade
GOLD (XAUUSD): Detailed Support & Resistance Analysis
Here is my fresh support & resistance analysis for Gold.
Vertical Structures
Vertical Resistance 1: Rising trend line
Horizontal Structures
Support 1: 3327 - 3344 area
Support 2: 3246 - 3275 area
Resistance 1: 3431 - 3451 area
The price is currently coiling on a trend line.
Your next bullish confirmation will be its breakout.
❤️Please, support my work with like, thank you!❤️
I am part of Trade Nation's Influencer program and receive a monthly fee for using their TradingView charts in my analysis.

Analysis for the next weekHello Trader,
I hope you are doing well and you enjoyed your weekend.
As you know the market is running in uptrend, it’s creating break of structure (BOS) again and again. The market can fall a bit and then it will continue the uptrend.
It can make another All Time High (ATH) next week. Avoid to take much risk. Follow the trend.
The market is going to open tonight, Get ready your accounts for the next week. Best wishes for all of you guys.
Gold Price Declines Amid Easing Geopolitical TensionsGold Price Declines Amid Easing Geopolitical Tensions
It has been announced that a meeting between the Presidents of the United States and Russia will take place this week. Donald Trump and Vladimir Putin are expected to meet in Alaska. This will mark the first face-to-face talks between the leaders of the two major powers since 2021, when Putin met with Biden in Geneva.
The upcoming meeting is widely seen as a potential step towards ending the full-scale military conflict in Ukraine, which began in 2022. Anticipation of the talks is easing geopolitical tensions, which is reflected in today’s downward movement of the gold price, visible on the XAU/USD chart.
XAU/USD Technical Analysis
Today, gold prices have fallen to the $3,360 area, with several bearish signals apparent on the chart:
→ The decline occurred on long bearish candles (as shown by the arrow). From a price action perspective, this suggests mounting selling pressure.
→ The MACD histogram has moved below zero, with the indicator lines pointing downward.
→ Gold has broken the upward trendline support from above (marked in blue). The breakout level, around $3,380, may now act as resistance, as sellers have asserted their dominance here.
→ From a broader perspective, the price appears to be reversing from the resistance line drawn through this summer’s highs.
Given these factors,we could assume that gold is heading towards the lower black trendline, which runs through the notable July lows and forms a channel with the upper line. However, along the way, sellers will need to overcome a key support zone in the form of a bullish Fair Value Gap (marked in purple). The upper boundary of this zone is reinforced by the 50% Fibonacci retracement level plotted from the bullish impulse points A→B.
Whether the bears can push the price through the FVG zone will largely depend on gold’s reaction to tomorrow’s US inflation data (CPI release scheduled for 15:30 GMT+3).
This article represents the opinion of the Companies operating under the FXOpen brand only. It is not to be construed as an offer, solicitation, or recommendation with respect to products and services provided by the Companies operating under the FXOpen brand, nor is it to be considered financial advice.
Gold next move (Read Description). Hello, Traders.
As you see gold has changed its direction after the NFP News. It was in down trend after the NFP News its flying to the my moon.
Gold is just flying and making breakouts of resistance areas. In my view gold wants to fly and it wants to hit buy side liquidity and then we can see the waterfall.
Gold can continue the trend and if price pullbacks it can touch the area 3365 - 3353 and then can fly.
Don’t trade against the trend, analyse the market before opening the trades.
