GOLD 1Hello to all traders. 😎😎
I hope all your deals will hit their targets. 🎉🎉
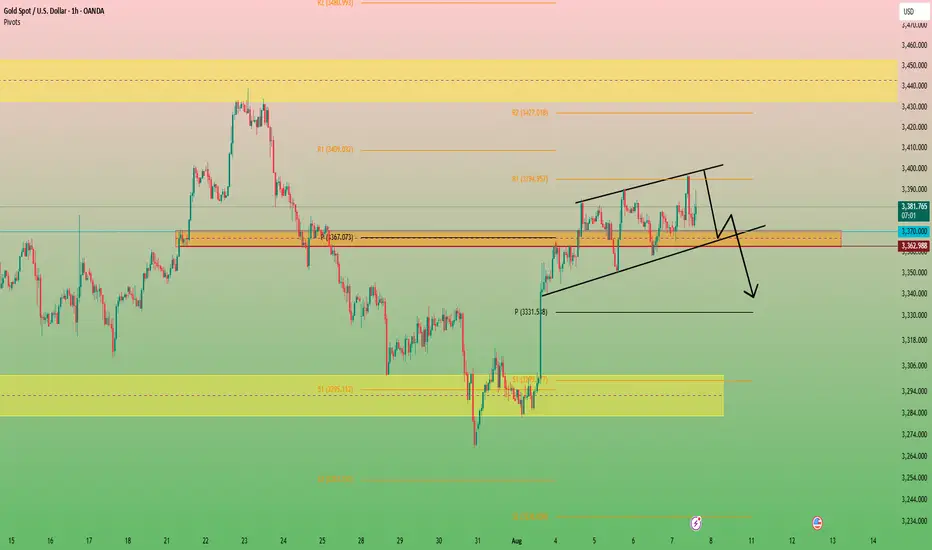
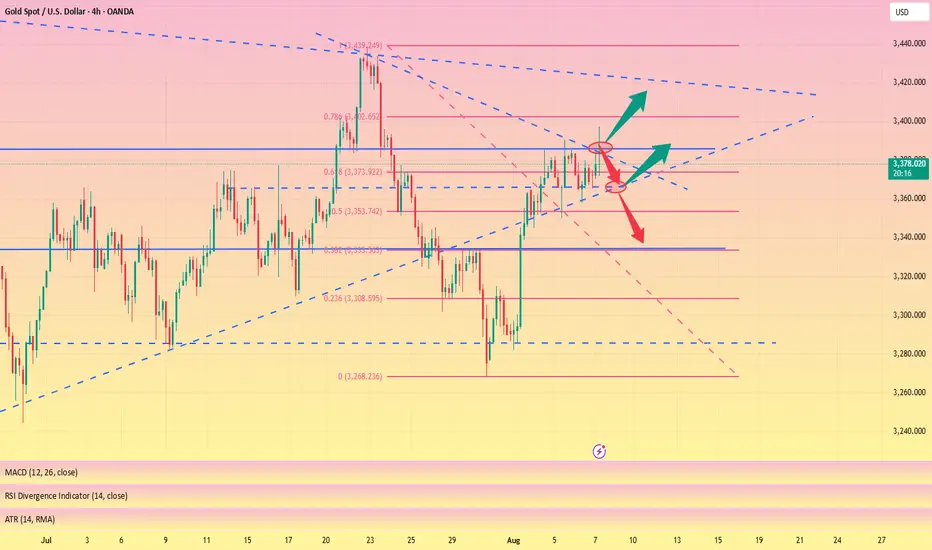
In my opinion, gold is currently moving within an ending pattern with a slight upward slope. This type of pattern is typically a reversal formation, and I believe it could lead to a drop in gold prices.
At the moment, I think gold might revisit the $3390–$3400 zone, and from there, we could see a deeper decline—first toward the bottom of the ending pattern at $3370, and if the pattern breaks, possibly down to $3340 or even lower.
However, if gold breaks above the $3400 level with strength, this analysis would be invalidated, and we could then expect a move toward the $3440 area.
⚠️⚠️⚠️⚠️Don’t forget to apply proper risk management!
What Do You Think?
Which scenario do you think is happen? **Share your thoughts!** ⬇️
Don't forget that this is just an analysis to give you an idea and trade with your own strategy. And don't forget the stop loss🛑🛑🛑
❤️❤️❤️The only friend you have in financial markets is your stop loss❤️❤️❤️
Please support me with your ✅' like'✅ and comments to motivate me to share more analysis with you and share your opinion about the possible trend of this chart with me 🙏😊
Be Happy , Ali Jamali
XAUUSD trade ideas
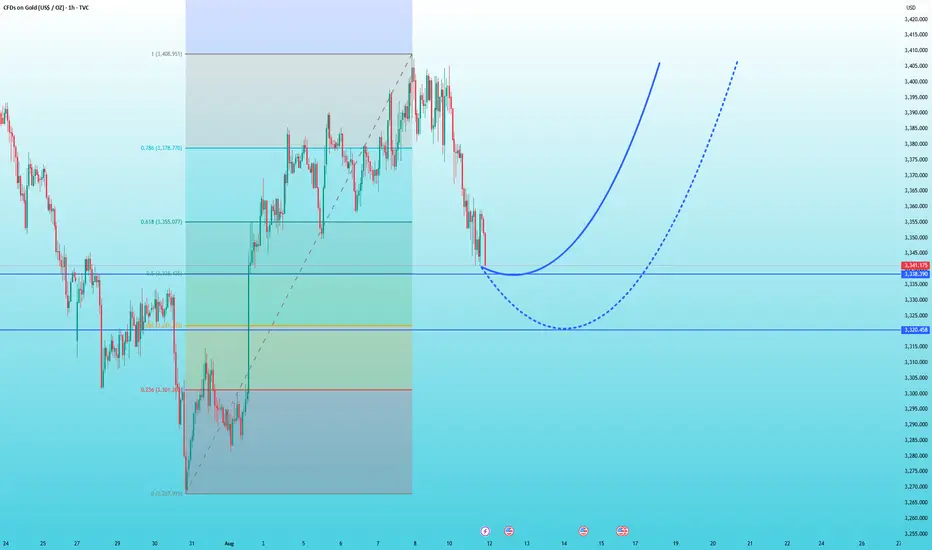
Bullish Outlook with Buying Opportunities Based on various factors, the outlook for gold prices in the medium and long term appears bullish.
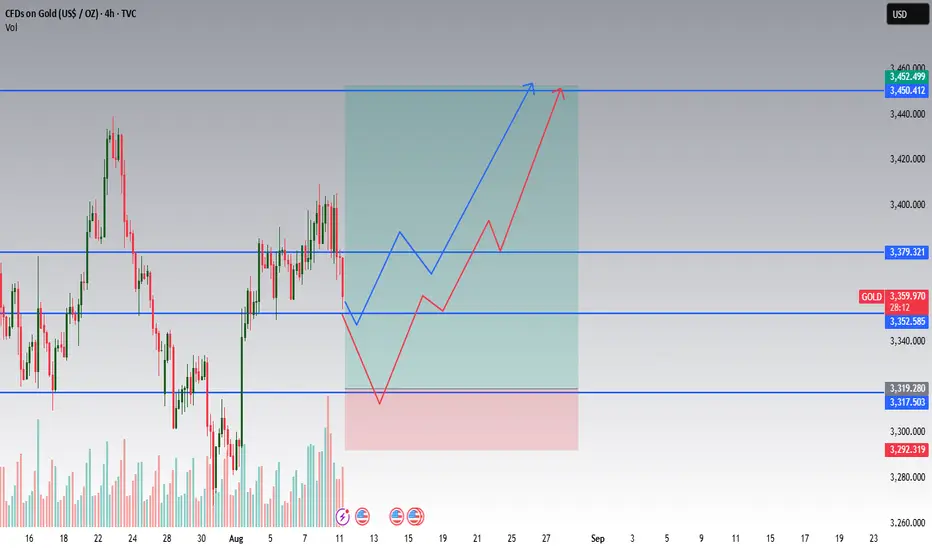
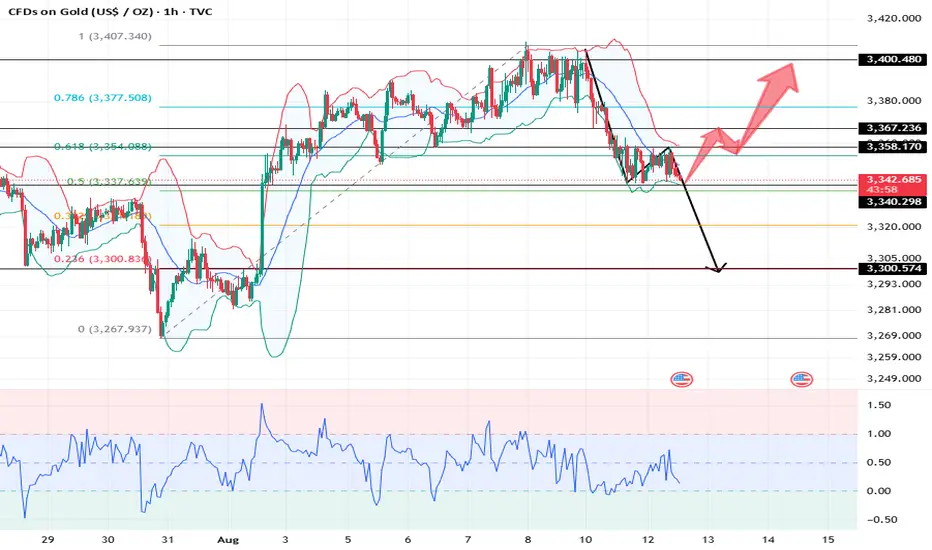
- From a technical analysis perspective, gold has the potential to move toward $3,500 and beyond, although the momentum of the recent upward trend has slightly weakened, suggesting a possible short-term price correction. If a correction occurs in the short term, it could reach the $3,346–$3,300 range, but gold is unlikely to fall below $3,268. Any pullback to these support levels could present a buying opportunity, as previously mentioned.
- Economic reports and the likelihood of interest rate cuts by the Federal Reserve (expected 50 basis point reduction by the end of 2025) due to projected global inflation above 5% enhance gold’s appeal as a non-yielding asset. Geopolitical issues, including U.S.-China trade tensions, new tariffs (e.g., 25% tariffs on Indian imports due to oil purchases from Russia), and concerns about an economic recession, have bolstered demand for gold as a safe-haven asset. Forecasts such as Goldman Sachs’ ($3,700 by the end of 2025) and J.P. Morgan’s ($4,000 by mid-2026) further support this bullish outlook.
- In the long term, factors such as the declining value of the dollar, rising investment demand (ETFs saw a 98.54% inflow increase in February 2025), and consistent purchases by central banks make gold an attractive option for investors. Therefore, as previously noted, any price pullback can be considered an opportunity to enter the market, particularly given the potential for investors to flock to gold amid unstable economic and geopolitical conditions.
Note:
This analysis is a personal opinion and not investment advice.
Good luck
NEoWave Chart
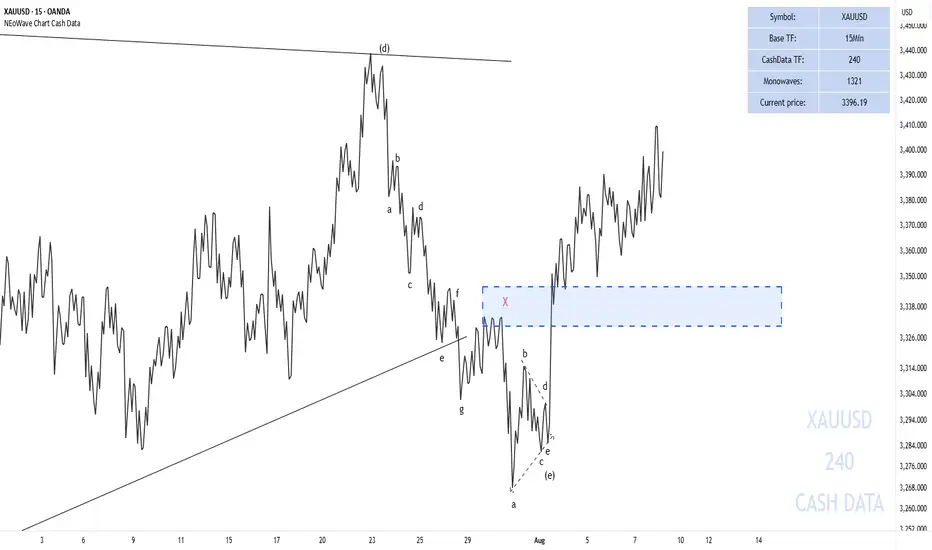
Gold can continue to rise, the correction is short-livedLast week, news of US tariffs on gold caused market volatility, sending gold prices surging to a high of 3,408.
Gold prices continued to fall today, dropping from the opening price of 3,400 to around 3,340. This $60 drop appears to be a response to the White House's clarification that the gold tariff information was false, as well as the reduction in risk aversion caused by the resumption of Russia-Ukraine negotiations on the 15th of this month.
However, regarding the gold tariff issue, my view is that the US's intention in imposing tariffs on gold is to disrupt the existing pricing mechanism, leaving it with complete control over the final price and price. While the US is not currently imposing tariffs, there's no guarantee that they won't be levied later or through other channels.
Furthermore, the resumption of Russia-Ukraine negotiations is merely a meeting between Trump and Putin on the 15th, with Ukraine and the EU once again excluded. This type of negotiation isn't very substantial, as this has happened before. Therefore, the idea that the end of the Russia-Ukraine conflict will lead to a significant drop in gold prices is not currently plausible.
Thus, from a macroeconomic perspective, the overall trend of gold remains unaffected, and the overall bullish trend remains.
I think there will not be much room for decline in this correction before the CPI data. For the support below, we can first look at the 3338 support level, and then the 3320 support level. As long as these two points stabilize, you can buy with confidence, because once there is a rebound, the profit space will be very considerable.
The triangle pattern is about to break through and hit 3400#XAUUSD
Although the price of gold was too high last night due to the rise in risk aversion, the upward momentum weakened significantly in the evening, and it fluctuated sideways at a high level. Gold is currently consolidating within a triangle pattern, with a short-term price increase reaching the triangle's boundary. A break above 3385 could lead to significant intraday gains. Meanwhile, the downside is defending short-term support at 3365. As long as this support level remains intact, the bullish trend remains intact. If the European session gives an opportunity to fall back to the 3375-3365 support area without breaking, you can consider going long and look at 3395-3405, and if it breaks, look at 3415.
GOLD 4H — CPI day. Keeping it simple.
I’m leaning bullish into CPI. If the number comes in hotter, gold usually gets an “inflation hedge” bid. No indicators, just clean levels from the chart.
Levels I care about
3450–3460: big target/resistance
3379: pivot — above it, buyers in control
3353: minor support
3317: demand / last higher low
3292: hard invalidation
How I’ll trade it
Plan A (shallow dip): If after the print price reclaims 3379 and holds on 15–30m, I’ll look long.
Stop: ~3351
Targets: 3450 first, then 3460 if momentum sticks.
Plan B (deeper sweep): If CPI first flushes into 3317 ±10 and we see a sharp rejection + higher low on LTF, I’ll buy the bounce.
Stop: ~3290 (below invalidation)
Targets: 3379, then 3450–3460.
If I’m wrong
A clean 4H close below 3292 = I’m out and waiting.
Notes
If CPI is softer than expected, USD/yields can pop and this long idea likely fails. I’ll wait 5–15 minutes after the release before committing and keep size modest.
The Rectangle Flirting with a DropThe Rectangle Flirting with a Drop" 😏📉
Like the market is saying: "Wait for me, boss… I’ll surprise you with a drop that’ll make the crowd cheer."
Tokyo? Feels like standing on the bridge at 5 AM — totally quiet. The real action starts when London comes in.
🥊 Quick Story, Boss
Right now, we’re in a small box of supply and demand.
The market is just chilling, drinking tea, waiting for London to wake up.
1. The Pattern (Price Shape)
Schabacker says: when price moves sideways after going down, most of the time it will keep going down.
This is called a bearish rectangle.
2. War Zones
Resistance: around 3380 – 3383 (price goes up there, gets smacked down).
Support: around 3370 – 3372 (price drops there, finds some buyers to stop it).
3. Volume
Tokyo is sleeping, volume is very weak.
Schabacker says: “If price breaks without volume, it means nothing.”
So, the big move didn’t come yet.
4. Trend
Price was falling before entering the box, so logic says: if support breaks, price will keep falling.
5. Market Psychology
Big traders now are selling slowly inside the box, giving their stock to beginners who think price will go up.
🎯 Schabacker’s Bottom Line
Wait for price to break 3370 with high volume.
When it happens, the drop will be fast.
🔥 Example Trade (Educational)
Order Type: Sell Stop (sell when price drops)
Entry: 3369.50
Stop Loss: 3376.50
Take Profit: 3355.50
Reason: Strong resistance above, weak volume above, main trend is down, and Schabacker says this is a drop signal.
Market Analysis: Gold Pulls BackMarket Analysis: Gold Pulls Back
Gold price started a fresh decline below $3,380.
Important Takeaways for Gold Price Analysis Today
- Gold price climbed higher toward the $3,410 zone before there was a sharp decline against the US Dollar.
- A key bearish trend line is forming with resistance near $3,355 on the hourly chart of gold.
Gold Price Technical Analysis
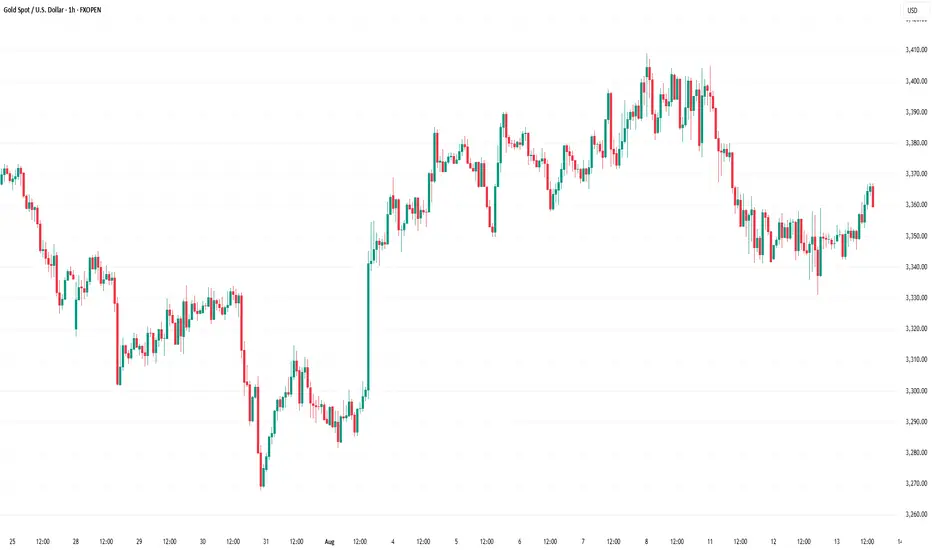
On the hourly chart of Gold at FXOpen, the price climbed above the $3,380 resistance. The price even spiked above $3,400 before the bears appeared.
A high was formed near $3,409 before there was a fresh decline. There was a move below the $3,380 pivot level. The bears even pushed the price below the $3,350 support and the 50-hour simple moving average.
It tested the $3,330 zone. A low has formed near $3,331 and the price is now consolidating losses near the 23.6% Fib retracement level of the downward move from the $3,409 swing high to the $3,331 low.
Immediate resistance on the upside is near a bearish trend line at $3,355 and the 50-hour simple moving average. The next major hurdle is near the 50% Fib retracement level.
The main barrier for the bulls could be near the $3,380 level, above which the price could test the $3,400 zone. Any more gains might call for a move toward $3,410. An upside break above $3,410 could send Gold price toward $3,425.
Initial support on the downside is near $3,330. The next key level is $3,320. If there is a downside break below $3,320, the price might decline further. In the stated case, the price might drop toward the $3,300 zone.
This article represents the opinion of the Companies operating under the FXOpen brand only. It is not to be construed as an offer, solicitation, or recommendation with respect to products and services provided by the Companies operating under the FXOpen brand, nor is it to be considered financial advice.
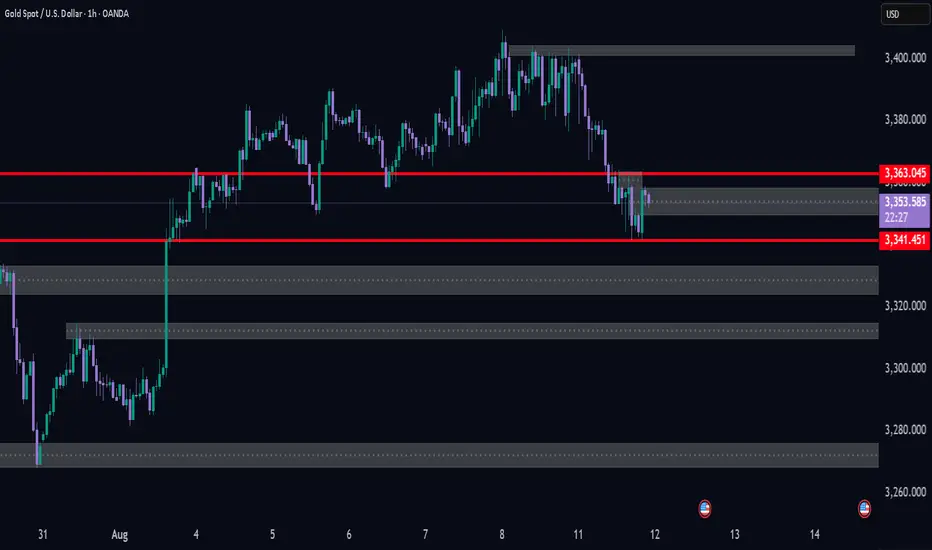
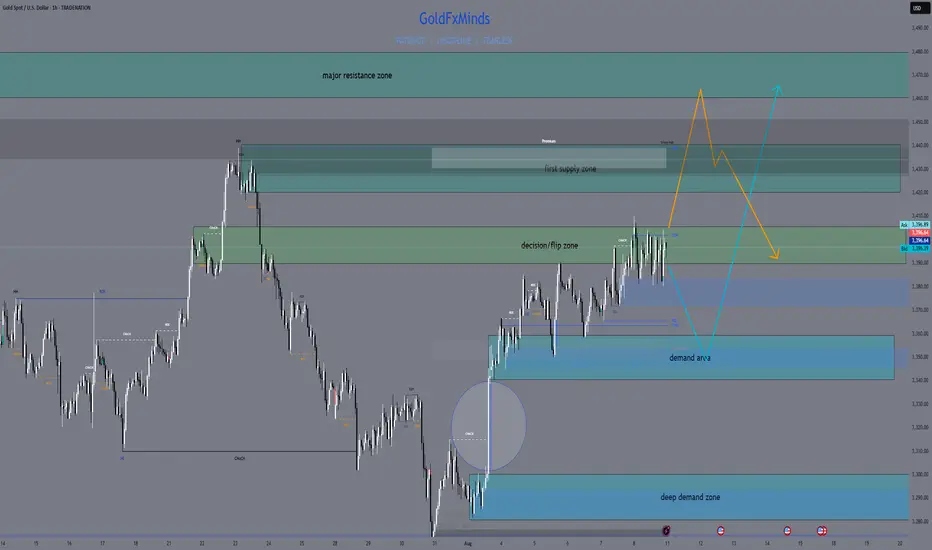
gold retracement dear users please be informed that if price break current rectangle from bottom bearish trend will continue to mentioned areas and I believe the imbalance bullish move of Friday 1st of august should cover so be careful and be patient enter on lower highs and in other hand of price break 3363 then bearish signal will be terminate and we will look for bullish trend , hope you all have a great summer.
GOLD: Local Bearish Bias! Short!
My dear friends,
Today we will analyse GOLD together☺️
The in-trend continuation seems likely as the current long-term trend appears to be strong, and price is holding below a key level of 3,375.02 So a bearish continuation seems plausible, targeting the next low. We should enter on confirmation, and place a stop-loss beyond the recent swing level.
❤️Sending you lots of Love and Hugs❤️

XAUUSD: Market Analysis and Strategy for August 12th Gold Technical Analysis:
Daily Chart Resistance: 3410, Support: 3300
4-Hour Chart Resistance: 3367, Support: 3338
1-Hour Chart Resistance: 3358, Support: 3340.
Gold continued its downward trend yesterday, erasing the gains of the previous five trading days. The chart shows significant selling pressure above 3400, with prices retreating to around 3340. Today's strategy is to focus on 3340 and 3367. We should also keep an eye on the US CPI data from the New York market, as the market generally responds to significant news to drive major moves.
For intraday trading, gold's upper resistance remains at 3365. If it fails to break through and hold above 3365, it will likely continue its downward trend. Consider selling when it rebounds to 3367-3370 and encounters resistance. Buy at the intraday low of 3340 and continue selling after it breaks below this low.
BUY:3344near
SELL:3338near
SELL:3367near
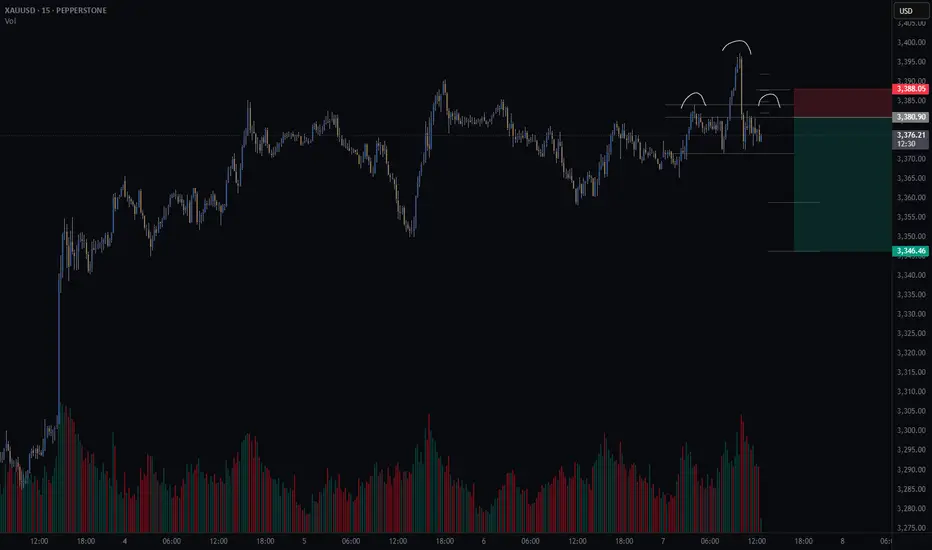
Gold short – Head and Shoulders Setting Up on 15min?There’s a potential head and shoulders pattern forming on the 15-minute chart.
📌 What I’m watching for:
A 15min candle close back inside the neckline range
Lower volume on the right shoulder vs. the left (to confirm weakening momentum)
🧠 Trade Idea (Short bias)
🎯 Entry: 3380.9
❌ Stop Loss: 3388.0
✅ Take Profit 1 (50%): 3358.9
✅ Take Profit 2 (50%): 3346.3
⚖️ Risk/Reward: 3.8R
This setup lines up with my trading method that focuses on structure, volume, and clean risk/reward.
🤔 What are your thoughts on gold today?
Are we about to roll over — or will bulls push through resistance?
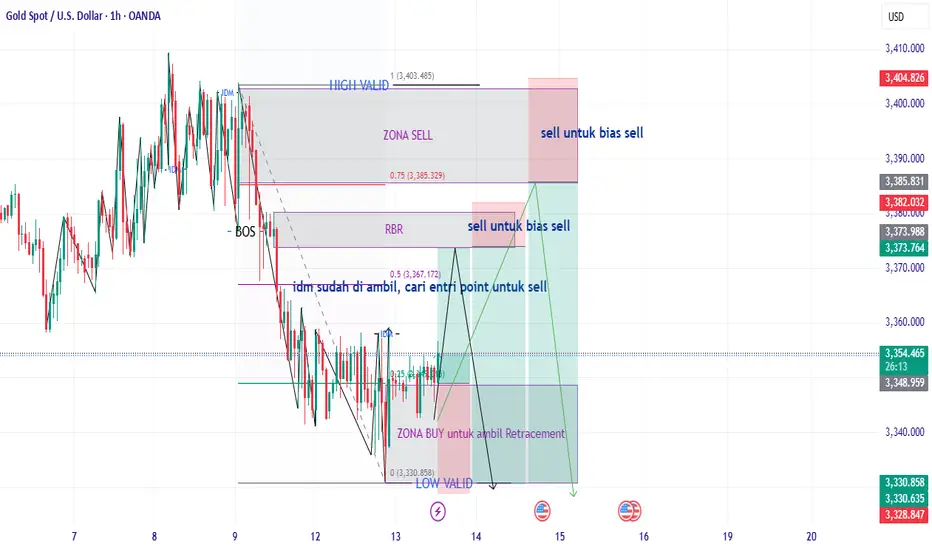
GOLD H1bias is sell, but you can take the buy retracement, then continue selling after it reaches the POI
Trading Game of the Day 11 August 2025Trading Plan:-
there is a golden note if you are patient to look for it daily ,you will be very profitable
that idea is :-
if you catch a iFVG +FVG or FVG+FVG associated with MSS in the direction of bias
enter the market after sweeping the consolidation or sweeping the retracement
Thank you

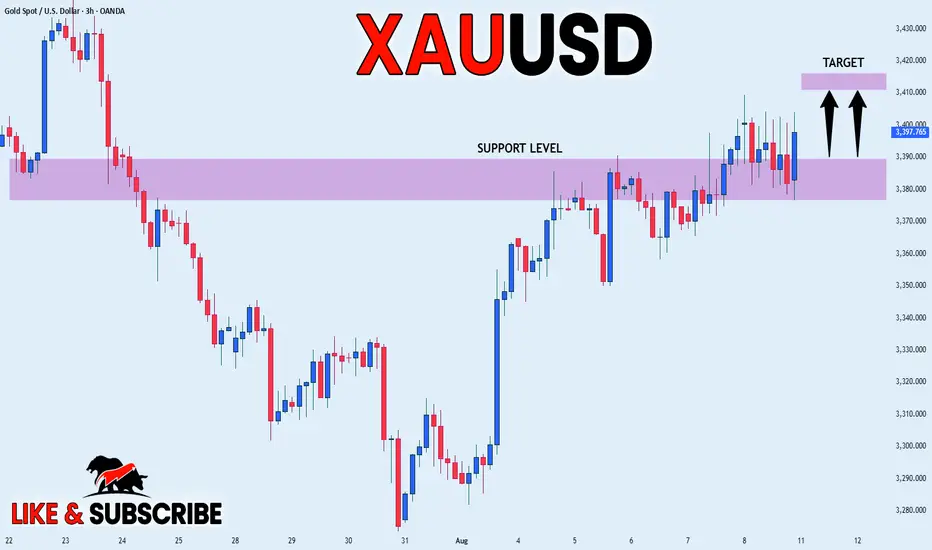
GOLD STRONG BULLISH BIAS|LONG|
✅GOLD is consolidating above
The horizonal support level
Of 3390$ while trading in a
Strong uptrend so we are
Bullish biased and we will be
Expecting growth on Monday!
LONG🚀
✅Like and subscribe to never miss a new idea!✅
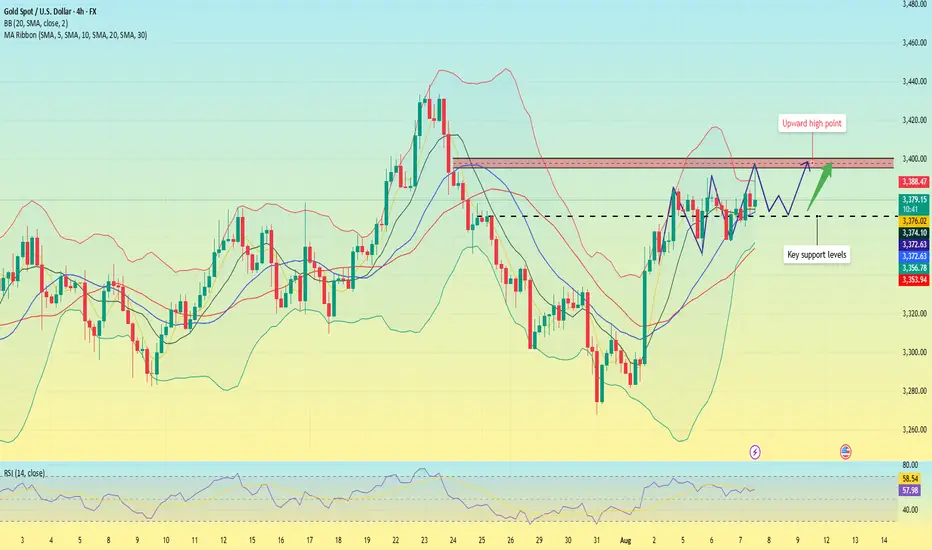
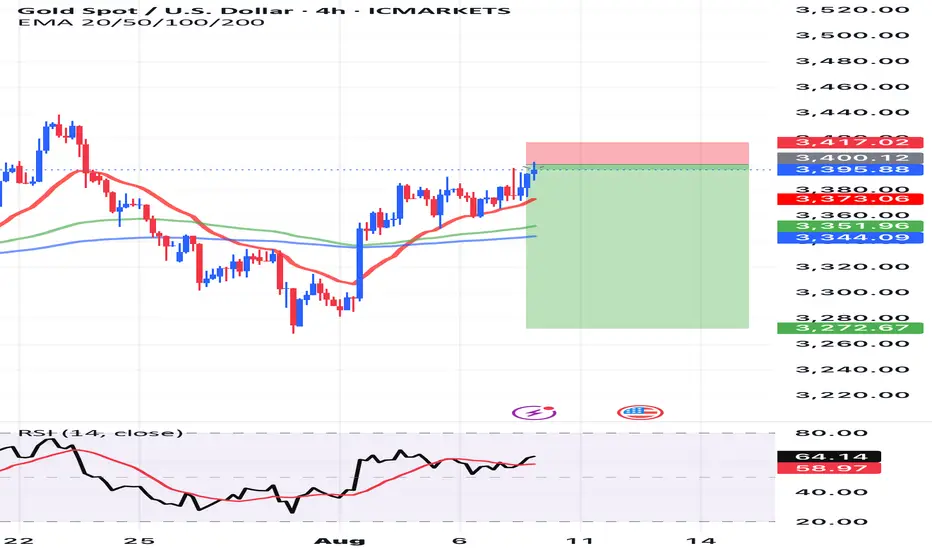
Gold is under pressure. Can the upward trend continue?On Thursday, gold rose rapidly in the European session, reaching around 3397, but failed to successfully break through the 3400 integer mark; it currently fell back slightly and fluctuated around 3375. Judging from the 4-hour chart, the price is currently running close to the middle track of the Bollinger band; since the market opened this week, the gold price has continued to run above the middle track of the Bollinger band. Despite the slight decline, it has remained within the upward trend channel and has continuously set new highs.
The current upward pressure position remains at 3390-3400, and the key support level is around 3370, which is also the crossover position of the current MA5, 10, and 20 moving averages. The RSI indicator remains above its midline, indicating that bullish momentum remains.
Quaid believes that as long as the price remains above 3370 in the US session, any pullback will be a sign of accumulating upward momentum. Gold still has the trend of hitting the 3400 integer mark.
Trading strategy:
Go long near 3370, stop loss at 3360, profit range 3380-3390-3400.
Short near 3400, stop loss at 3410, profit range 3375-3365-3355.
XAUUSD - Daily Sniper Battle PlanGood day traders 🌟
🌍 MACRO PULSE & CONTEXT
USD Sentiment: Dollar showing mixed signals as markets await fresh catalysts. No major USD movers today keeping gold in pure structural play mode. Fed remains hawkish but dovish pivot expectations keep safe-haven flows active. Gold sitting in premium territory testing institutional patience.
Key Events: Watch for any surprise USD strength that could accelerate moves through key levels. Current levels showing distribution vs accumulation battle.
📊 HTF OVERVIEW (D1 → H4 → H1)
Daily Bias: BULLISH BUT EXTENDED
Long-term trend remains bullish with higher highs intact
Price in premium territory - caution for longs
Multiple supply layers above current price creating resistance stack
H4 Bias: CONSOLIDATION IN PREMIUM
Price testing upper structural boundaries
Bull case: Hold above 3380 for continuation toward higher supply zones
Bear case: Break below 3360 for deeper correction to demand
H1 Bias: MIXED - CRITICAL DECISION ZONE
Sitting at key structural level at 3396
Breakout zone: 3390-3405 range
Direction of next move will define short-term bias
🎯 STRUCTURAL ZONES (SMC/ICT CONFLUENCE)
PREMIUM SUPPLY ZONES - STACKED RESISTANCE
🔴 3540-3560 | Weekly Nuclear Supply
Ultimate resistance - weekly structural ceiling
Major institutional distribution zone
Final target for any extreme bullish scenario
🔴 3500-3520 | Daily Major Supply
Strong daily supply block with heavy rejection history
Key institutional selling zone
Secondary target for bullish extensions
🔴 3460-3480 | H4 Supply Block
Immediate major resistance above current consolidation
Previous rejection area with bearish OB formation
First major target if bulls break above 3440
🔴 3420-3440 | H4 Near Supply
Current upper boundary resistance
Recent high rejection point
Scalp short opportunity zone
DISCOUNT DEMAND ZONES
🟢 3280-3300 | H4 Nuclear Demand
Major structural support with institutional backing
Previous breakout point turned support
High probability bounce zone if deep correction occurs
🟢 3340-3360 | H1 Key Demand
Critical pullback support level
Clean demand block with previous respect
First major support below current price
CURRENT BATTLEFIELD
⚡ 3390-3405 | Decision Zone
Critical range where price currently consolidates
Breakout either direction will dictate next major leg
Low probability zone for range entries
⚡ CURRENT ACTION PLAN
IMMEDIATE FOCUS: 3396 in critical decision zone - patience required
BULL SCENARIO ROADMAP:
Above 3405 = Target 3420-3440 first supply test
Above 3440 = Target 3460-3480 major supply
Above 3480 = Target 3500-3520 daily supply
Above 3520 = Target 3540+ nuclear supply
BEAR SCENARIO ROADMAP:
Below 3390 = Target 3340-3360 demand test
Below 3340 = Target 3280-3300 nuclear demand
Below 3280 = Major trend shift - deeper correction
ZONE INVALIDATION:
Bull case compromised: Below 3280 major demand with volume
Bear case invalidated: Above 3540 nuclear supply with momentum
BEST R:R ZONES:
3340-3360 long - Perfect H1 demand with multiple targets above
3460-3480 short - Major supply with deep correction potential
3280-3300 long - Nuclear support with massive upside potential
🎯 FINAL BATTLE SUMMARY
Gold at 3396 sits in the eye of the premium storm - multiple supply layers stacked above like a fortress, while solid demand zones wait below. This is institutional chess at its finest.
The Setup: Stacked resistance creates multiple short opportunities on any push higher, while solid demand zones below offer high R:R long setups. The market is loaded and ready for explosive moves.
The Mindset: Premium territory with multiple supply layers demands surgical precision. Don't force trades at current levels - wait for the extremes where smart money reveals their true intentions.
Next Move: Any fundamental catalyst could trigger violent moves through these stacked zones. Clean breaks of structure with institutional volume will separate high-probability setups from noise.
The beauty of this setup is the multiple layers - bulls have targets, bears have multiple ambush points. Perfect battlefield for patient snipers.
If this layered battlefield analysis brought clarity to your gold game, smash that 🚀🚀🚀, drop your bias in the comments, and follow for precision execution intel. No fluff, just pure structural warfare.
📎 Disclosure: Part of TradeNation's Influencer Program - charts used for educational analysis only.
Consolidation and indecisionA clear consolidation and indecision can be seen in that yellow-marked area, and a breakout in either direction could mark the start of a strong trend.
There’s also a chance the price could open with a gap tonight, but in any case, I believe this consolidation will break to the upside.
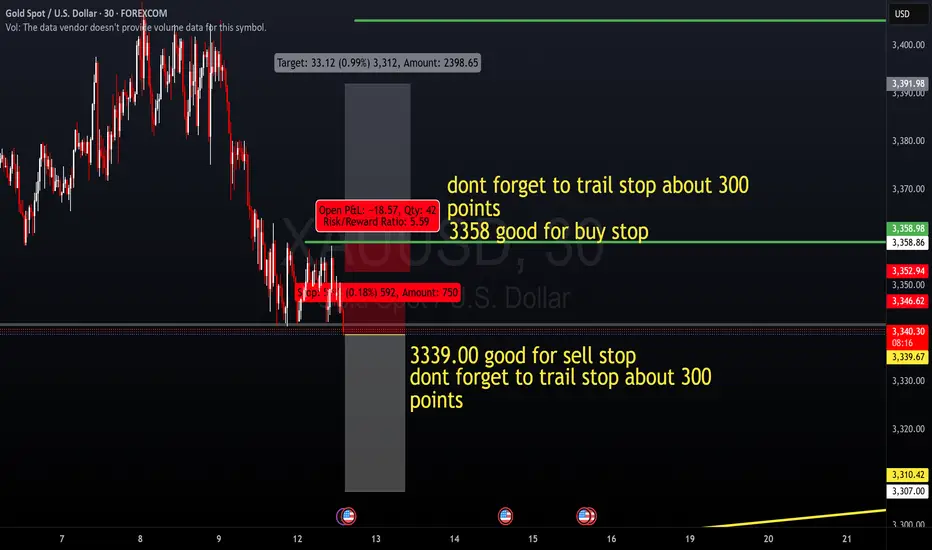
Gold potentialshi everyone, we have CPI news, and i think these prices are good for pending orders.
dont forget to trail your stop loss.
have a nice day
$GOLD: Breakout Texture🏛️ Research Notes
Original Structure
Logical Continuation
Cycle can be broken further by adding x.146 and x.886 essentially allowing us define probability density with better precision. Also, made it B&W because I care about the topology of compression and release (the outcome) more than providing subjective interpretation colors to remain objective. Specifically, if the geometry of "release" phase would match the price texture.
Validation of the structure (initial measurements) by recognizing how it resonated throughout history. (in a way prelude to what we see)
Stats Table shows geometric averaging of all swings to figure out the all time mean to be able to anticipate wave’s first limit set by typical range.
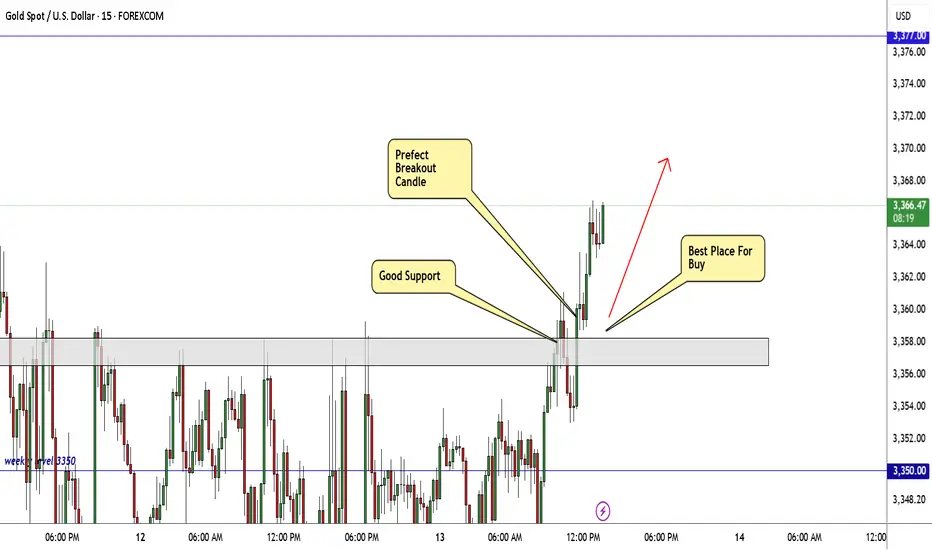
GOLD Buyers In Control Now , Long Setup To Get 200 Pips !Here is My 15 Mins Gold Chart , and here is my opinion , we finally above 3358.00 and we have a 4H Candle closure above it And Perfect Breakout and this give us a very good confirmation cuz we have not any 4H closure above this area since this week start , so we have a good confirmation now to can buy after the price go back to retest the broken area to can use a small stop loss , and we can targeting 100 to 200 pips . if we have a daily closure below this area this mean this idea will not be valid anymore .
Reasons To Enter :
1- Clear Breakout On Bigger T.F
2- Clear Bullish Price Action .
3- Bigger T.F Giving Good Bullish P.A .
4- The Price Take The Last High .
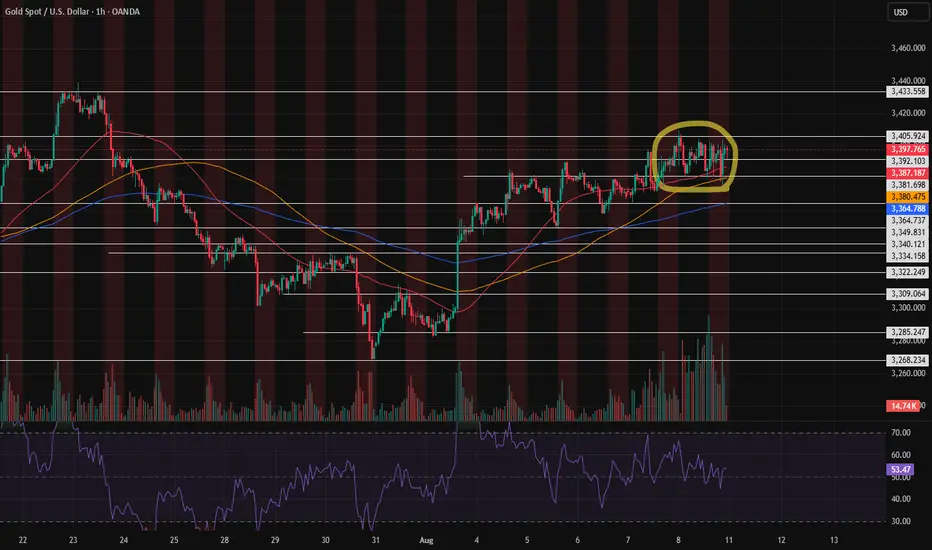
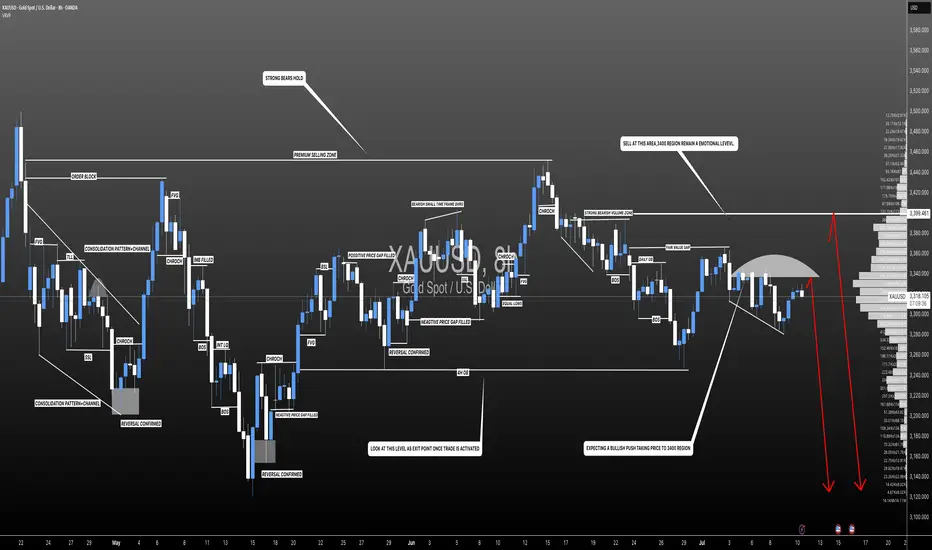
XAUUSD XAU/USD SHORT BIAS (at $3396) – Expecting a Sharp Decline
Thesis:
Gold is currently overextended at $3396, showing signs of exhaustion after a strong rally. Technical indicators and macroeconomic conditions suggest an imminent correction.
Reasons for Bearish Outlook:
1. Overbought Conditions – RSI and momentum oscillators are at extreme highs; a retracement is statistically likely.
2. Strong Resistance – Price approaching a historical supply zone; failed breakouts are common at this level.
3. Dollar Strengthening – If DXY gains strength due to Fed policy, gold could see downward pressure.
4. Bond Yields Rising – Higher yields reduce gold’s appeal as a non-yielding asset.
Target Zones:
• Immediate target: $3310–$3290
• Deeper support: $3225–$3190
Risk:
If gold breaks and holds above $3420, the short thesis may be invalidated.
XAUUSD:Swing Sell Is Highly Likely! Get ReadyWe expect a smooth drop in gold prices, with prices potentially dropping around the 3250 area. Use Accurate Risk Management.
Please like and comment!
Team Setupsfx_
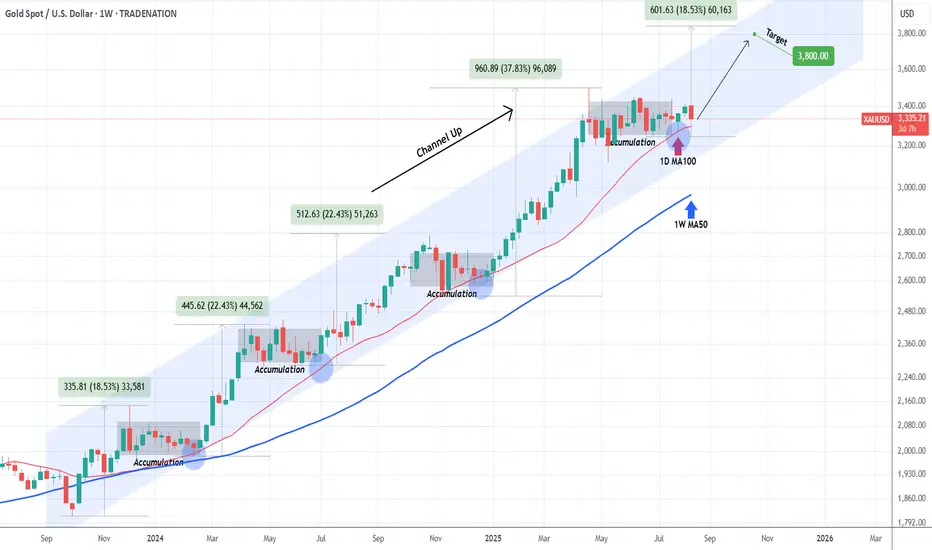
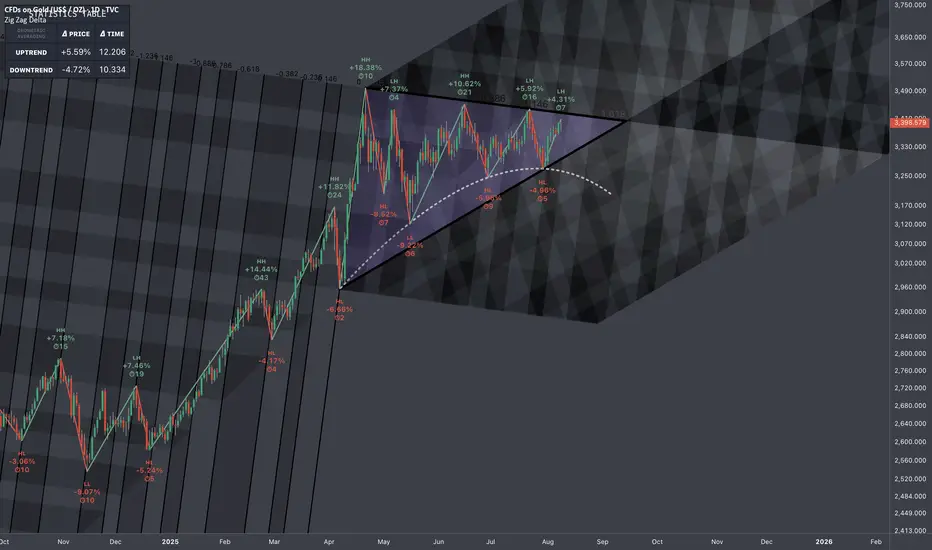
XAUUSD on the verge of price explosion to $3800.Gold (XAUUSD) has been trading within nearly a 2-year Channel Up. Despite the red start to this week, we have had a strong bullish confirmation signal prior, as the price hit and rebounded on its 1D MA100 (red trend-line).
The 1W MA50 (blue trend-line) may be the Channel's natural Support throughout all this time but its the 1D MA100 that every time it's been touched, it initiated the pattern's technical Bullish Legs.
As you can see this always takes place after an Accumulation/ Consolidation period and the minimum rise it has produced was +18.53%.
If we repeat this bear minimum, we are looking at a $3800 Target before the end of the year.
-------------------------------------------------------------------------------
** Please LIKE 👍, FOLLOW ✅, SHARE 🙌 and COMMENT ✍ if you enjoy this idea! Also share your ideas and charts in the comments section below! This is best way to keep it relevant, support us, keep the content here free and allow the idea to reach as many people as possible. **
-------------------------------------------------------------------------------
Disclosure: I am part of Trade Nation's Influencer program and receive a monthly fee for using their TradingView charts in my analysis.
💸💸💸💸💸💸
👇 👇 👇 👇 👇 👇