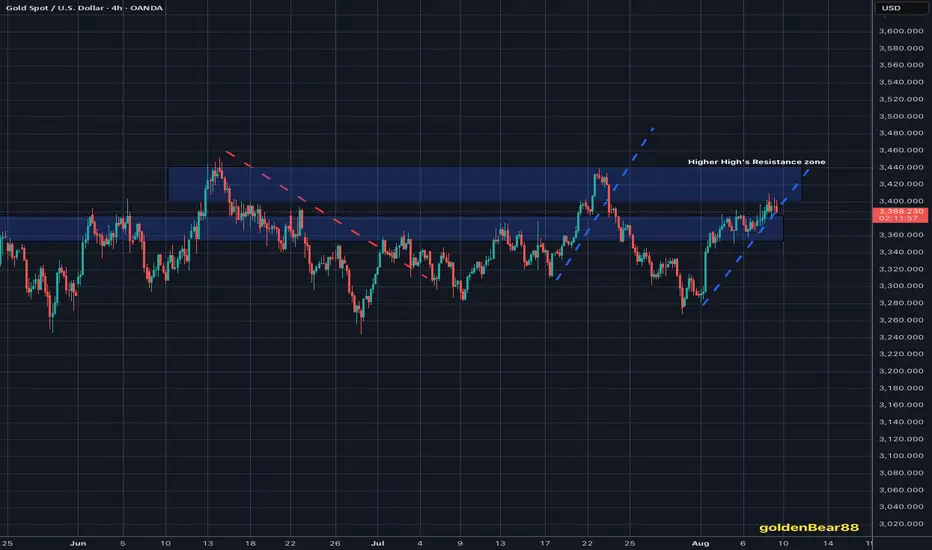
Gold steady near 3,350 after CPIHello everyone !
Gold prices remain steady around the 3,350 level, recovering notably from overnight lows following the release of U.S. inflation data.
July’s Consumer Price Index rose 2.7% year-on-year, slightly below the 2.8% forecast. However, core CPI climbed 3.1%, exceeding the 3.0% estimate and June’s 2.9% reading. These figures have reinforced market expectations for a 0.25% interest rate cut by the Federal Reserve on September 17.
The market also reacted to comments from U.S. President Donald Trump, who announced that imported gold would not face tariffs in the U.S. This decision has fueled volatility in gold over the past two sessions. Any tariff imposition on bullion could significantly impact global gold flows.
If the no-tariff policy is officially confirmed, gold prices may stabilize. However, any conflicting signals could trigger fresh price swings.
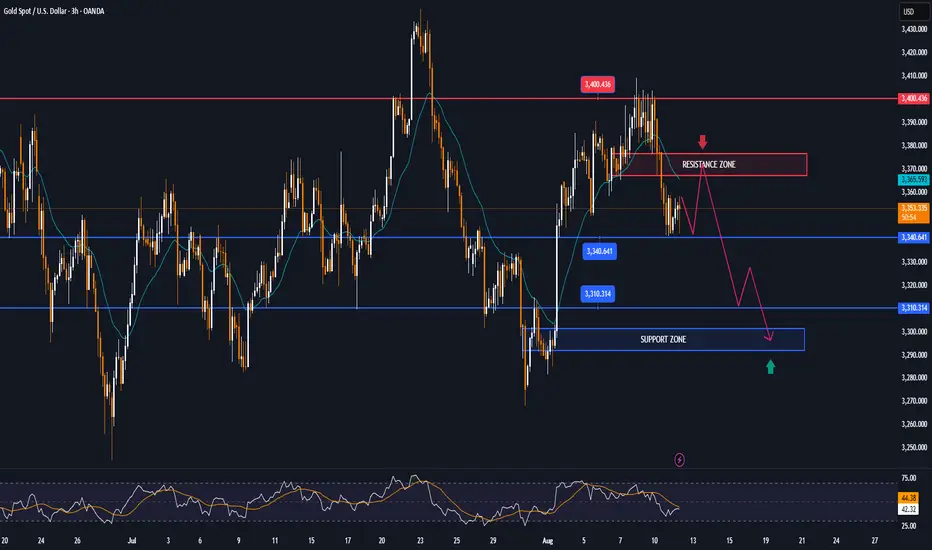
From a technical perspective, gold is consolidating in a sideways range after breaking below its trendline. The 3,360 to 3,380 zone is now acting as a strong resistance area. A strong rejection here could reignite the downtrend, targeting the 3,310 level initially, with a further drop towards the key 3,300 level.
XAUUSD trade ideas

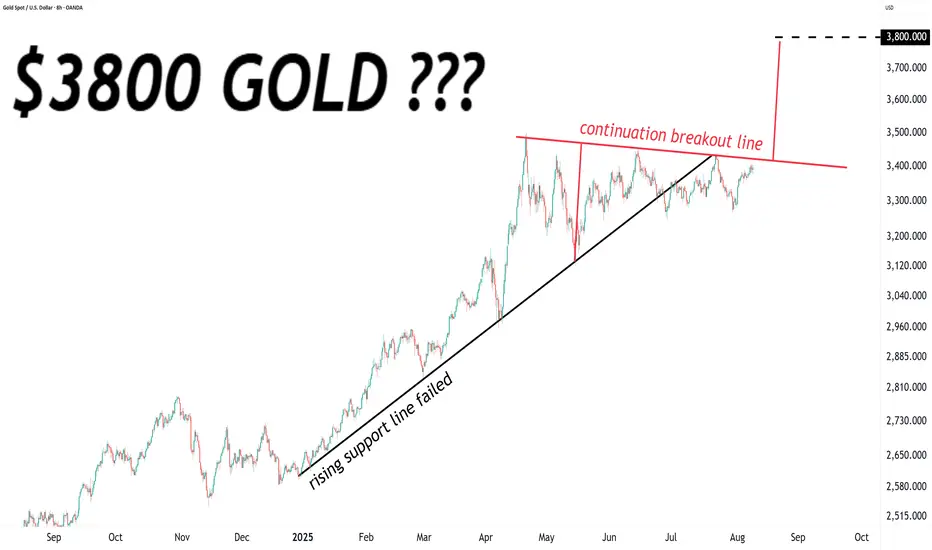
The gold chart made VERY simple.The gold chart made VERY simple.
$3800 target POSSIBLE once we get a confirmed continuation breakout.
Data week, GOLD has all the conditions to riseThis week, global financial markets will look forward to US inflation data for July (CPI, PPI), retail sales data and speeches from several Federal Reserve officials.
These important pieces of information will directly impact expectations for a September rate cut and influence the performance of the US Dollar, gold, crude oil and US stocks.
On the political front, US President Donald Trump's public pressure on the Federal Reserve and recent appointments have raised market concerns about the independence of monetary policy, while escalating tariffs continue to raise the risk of global trade conflicts.
Federal Reserve: Policy Disruption and Dovish Signals Coexist
This week, the Fed kept its target range for the federal funds rate unchanged at 4.25% to 4.50%, but the vote was split, with two officials—Vice Chair Michelle Bowman and Governor Christopher Waller—in favor of an immediate quarter-point rate cut.
TVC:DXY : Technical Pressure and Political Risk
The US Dollar Index (DXY) has fallen to around 98 this week, failing to hold above 100. Technically, a break of the July low of 96.37 could lead to a drop to 95.13 and 94.62. Despite the 10-year Treasury yield rising to 4.285%, the Dollar remains under pressure, reflecting market concerns about political risks in the United States.
If CPI is higher than expected this week, the market may feel like it is moving too fast, which could cause volatility.
Traders generally believe that Trump's tariff policies, public criticism of the Federal Reserve and uncertainty about the fiscal deficit are all weakening the medium- to long-term support for the US Dollar.
Markets will be watching closely to see if the impact of tariffs starts to show in inflation data, and if consumer spending data confirms the economic recovery. A positive reading would reinforce expectations for a rate cut, a positive signal for stocks and gold. An unexpected rise in inflation could slow the pace of Fed easing, weighing on risk assets and supporting the US Dollar TVC:DXY .
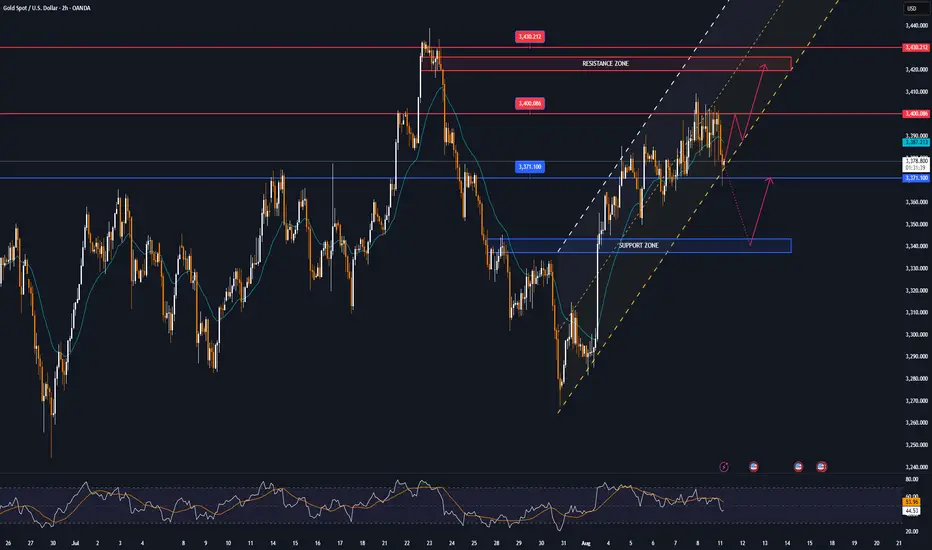
Technical Outlook Analysis OANDA:XAUUSD
Gold has been on a long bullish recovery since breaking out and holding above the $3,300 base point, and currently structurally it has not changed much with the uptrend still dominating the daily chart.
Specifically, in the short term, gold is supported by the EMA21 with the target at the $3,400 base point noted by readers in the weekly publication last week has been achieved.
Looking ahead, the horizontal support at the 0.236% Fibonacci retracement will be the nearest support to reinforce the expectation of a continued breakout of gold prices breaking through the $3,400 point towards the $3,430 – $3,450 level.
In terms of momentum, the Relative Strength Index (RSI) has moved above 50 but is still quite far from the overbought zone (80-100), indicating that there is still a lot of room for upside ahead.
Meanwhile, even if gold is sold below the EMA21, the declines are not considered a specific technical trend in the short term, as long as the support levels of 3,310 – 3,300 USD and Fibonacci 0.382% are not broken below.
Finally, in terms of position as well as technical conditions, the gold price on the daily chart currently has a technical outlook leaning more towards the upside and the notable points will be listed as follows.
Support: 3,371 – 3,350 – 3,340 USD
Resistance: 3,400 – 3,430 – 3,350 USD
SELL XAUUSD PRICE 3424 - 3422⚡️
↠↠ Stop Loss 3428
→Take Profit 1 3416
↨
→Take Profit 2 3410
BUY XAUUSD PRICE 3338 - 3340⚡️
↠↠ Stop Loss 3334
→Take Profit 1 3346
↨
→Take Profit 2 3352
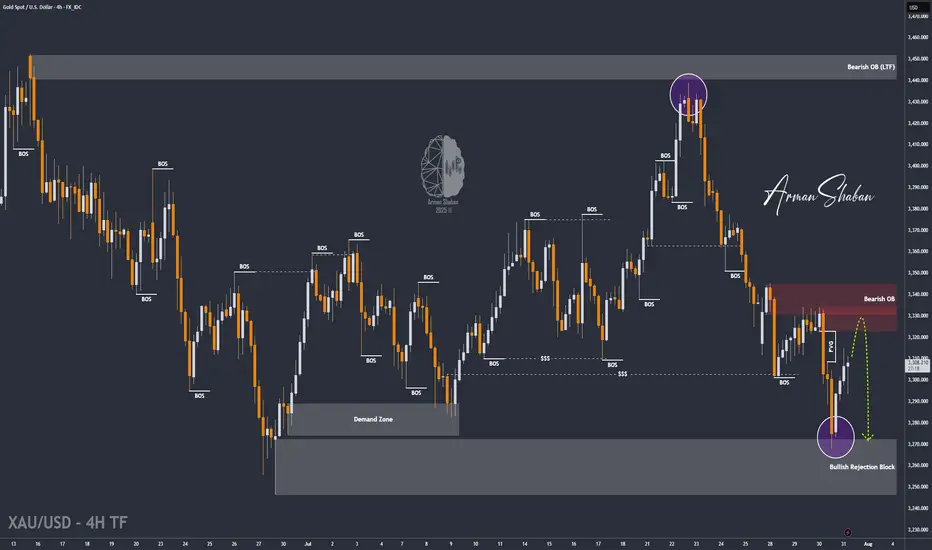
XAU/USD | Next Key Zone: Watch for Rejection at $3334! (READ)By analyzing the gold chart on the 4-hour timeframe, we can see that, just as expected, the price dropped from $3310 to $3288 in the first leg, where it hit a demand zone and bounced up to $3305, delivering a 170-pip rally. The main bearish move from $3333 to $3288 yielded 450 pips, bringing the total return on this analysis to over 620 pips!
In the second phase, gold dropped sharply again to $3268, and once more found demand, currently trading around $3307. If the price holds above $3294, we could expect further upside toward the $3322–$3334 zone. Once gold reaches this area, a strong bearish rejection is likely, with a potential return of 250 to 400 pips.
All key supply and demand levels are marked on the chart — make sure to monitor them closely and study the chart in detail. Hope you’ve made the most of this powerful analysis!
Please support me with your likes and comments to motivate me to share more analysis with you and share your opinion about the possible trend of this chart with me !
Best Regards , Arman Shaban
Daily XAUUSD OutlookGood day traders 🌟
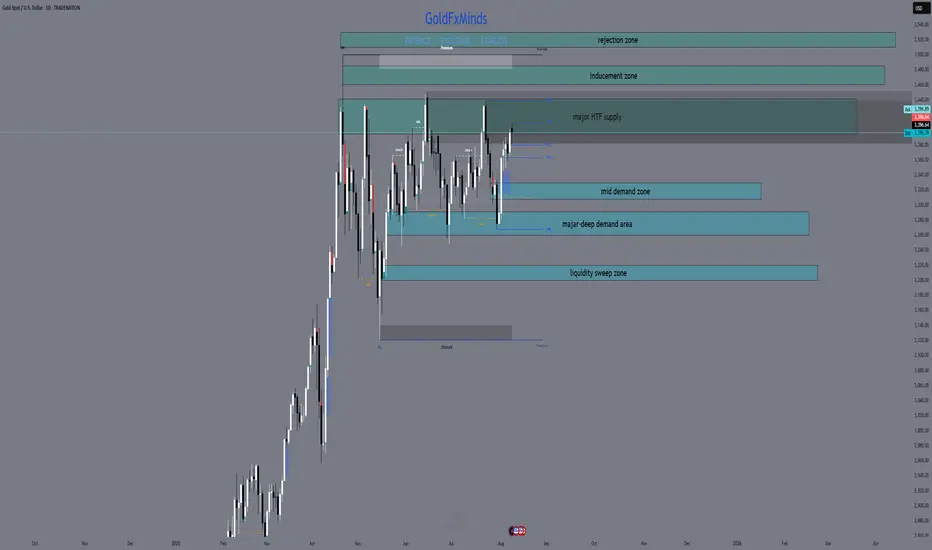
Gold opens today’s session still holding strong near the upper boundaries of its daily range, trading just beneath the dominant weekly supply zone. Buyers have kept control above the 3290 handle, while sellers continue to defend the ceiling around 3439. With a busy US data week ahead, the daily chart sets the stage for either a decisive breakout or a calculated pullback into fresh demand.
📌 Bias: Bullish — daily structure remains firmly intact above 3290, dynamic EMA flow is aligned for upside, and momentum is in buyers’ favor. Still, given we’re in premium pricing, waiting for confirmation is essential before entering fresh positions.
Macro Context
Markets are poised for volatility with US CPI, PPI, and retail sales lined up. Softer inflation data could give bulls the push to clear the 3439 ceiling, while stronger numbers may invite a retracement toward lower daily demand zones.
📊 Key Daily Zones
Immediate Resistance / Supply: 3395 – 3439 (HTF supply overlap + liquidity resting above).
Mid-Level Demand: 3330 – 3310 (recent bullish OB, intraday reload zone).
Major Daily Demand: 3290 – 3260 (untested breakout base).
📊 Key Zones
Above Current Price
Immediate Resistance / Supply: 3395 – 3439 (major HTF supply).
3460 – 3475 → H4/D1 imbalance + inducement zone.
3480 – 3490 → 1.618 Fibonacci extension from last weekly swing.
3510 – 3525 → minor HTF supply / wick rejection zone.
Below Current Price
Mid-Level Demand: 3330 – 3310 (recent bullish OB).
Major Daily Demand: 3290 – 3260 (untested breakout base).
3220 – 3200 → daily demand + liquidity sweep zone.
3155 – 3140 → daily OB + HTF BOS retest.
3100 – 3085 → HTF demand + liquidity shelf.
3040 – 3020 → deep daily demand + Fibo 0.786 retracement of May rally.
🚀 Bullish Scenario
A break and daily close above 3439 clears the path toward 3460 – 3475, with extension targets at 3480 – 3490 and 3510 – 3525.
Pullbacks into 3330 – 3310 or 3290 – 3260 with bullish confirmation may offer high-RR entries back toward the highs.
📉 Bearish Scenario
Rejection from 3439 could push price back toward 3330 – 3310 or 3290 – 3260.
A daily close below 3260 opens deeper targets at 3220 – 3200, 3155 – 3140, and potentially 3100 – 3085.
🔍 Confluence & Indicators
Dynamic EMA Flow: Bullish, price above all major EMAs.
RSI: Neutral-to-bullish, no divergence on D1.
FVGs: Unfilled gap above 3439 acts as liquidity magnet.
Fibonacci: Price near 1.272 extension, with 1.618 above at 3480–3490.
📌 Outlook Summary
Gold is coiled near the top of its range in a bullish structure. The best setups will come from either a confirmed breakout above 3439 toward higher HTF targets or a disciplined buy from demand after a healthy retracement.
💬 Your move — will gold finally push through the highs, or is a deeper pullback coming first? Share your thoughts below and let’s track the market together.
If you find these outlooks useful, hit like and follow for precision updates.
— GoldFxMinds
Disclosure: This analysis uses Trade Nation’s price feed and is for educational purposes only — not financial advice.
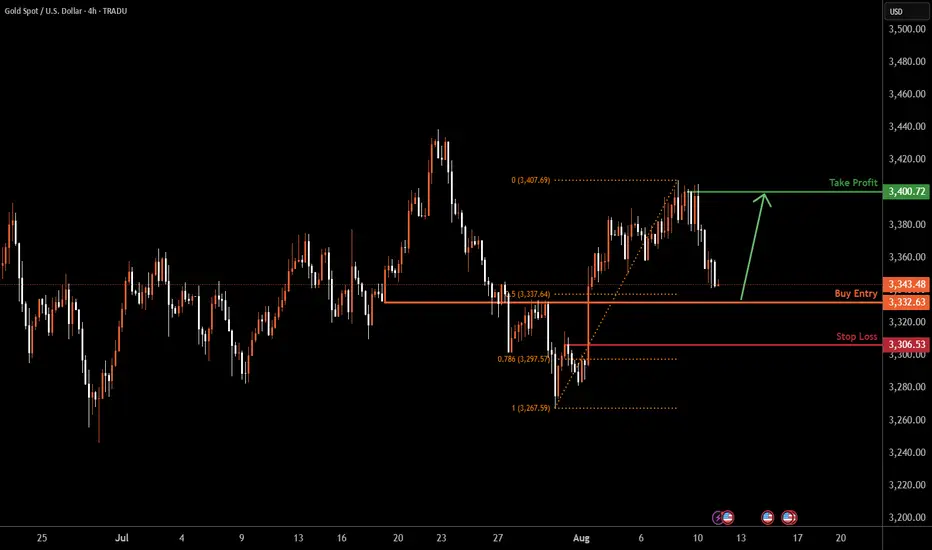
XAUUSD H4 | Bullish bounce offXAU/USD is falling towards the buy entry which is a pullback support that lines up with the 50% Fibonacci retracement and could bounce to the take profit.
Buy entry is at 3,332.63, which is a pullback support that lines up with the 50% Fibonacci retracement.
Stop loss is at 3,306.53, which is a pullback support that is slightly above the 78.6% Fibonacci retracement.
Take profit is at 3,400.72, which is a swing high resistance.
High Risk Investment Warning
Trading Forex/CFDs on margin carries a high level of risk and may not be suitable for all investors. Leverage can work against you.
Stratos Markets Limited (tradu.com ):
CFDs are complex instruments and come with a high risk of losing money rapidly due to leverage. 65% of retail investor accounts lose money when trading CFDs with this provider. You should consider whether you understand how CFDs work and whether you can afford to take the high risk of losing your money.
Stratos Europe Ltd (tradu.com ):
CFDs are complex instruments and come with a high risk of losing money rapidly due to leverage. 66% of retail investor accounts lose money when trading CFDs with this provider. You should consider whether you understand how CFDs work and whether you can afford to take the high risk of losing your money.
Stratos Global LLC (tradu.com ):
Losses can exceed deposits.
Please be advised that the information presented on TradingView is provided to Tradu (‘Company’, ‘we’) by a third-party provider (‘TFA Global Pte Ltd’). Please be reminded that you are solely responsible for the trading decisions on your account. There is a very high degree of risk involved in trading. Any information and/or content is intended entirely for research, educational and informational purposes only and does not constitute investment or consultation advice or investment strategy. The information is not tailored to the investment needs of any specific person and therefore does not involve a consideration of any of the investment objectives, financial situation or needs of any viewer that may receive it. Kindly also note that past performance is not a reliable indicator of future results. Actual results may differ materially from those anticipated in forward-looking or past performance statements. We assume no liability as to the accuracy or completeness of any of the information and/or content provided herein and the Company cannot be held responsible for any omission, mistake nor for any loss or damage including without limitation to any loss of profit which may arise from reliance on any information supplied by TFA Global Pte Ltd.
The speaker(s) is neither an employee, agent nor representative of Tradu and is therefore acting independently. The opinions given are their own, constitute general market commentary, and do not constitute the opinion or advice of Tradu or any form of personal or investment advice. Tradu neither endorses nor guarantees offerings of third-party speakers, nor is Tradu responsible for the content, veracity or opinions of third-party speakers, presenters or participants.
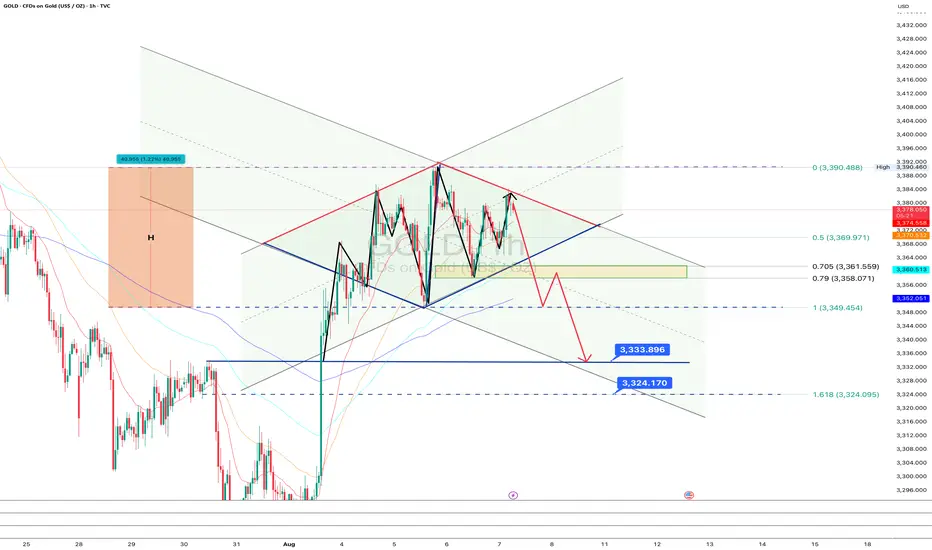
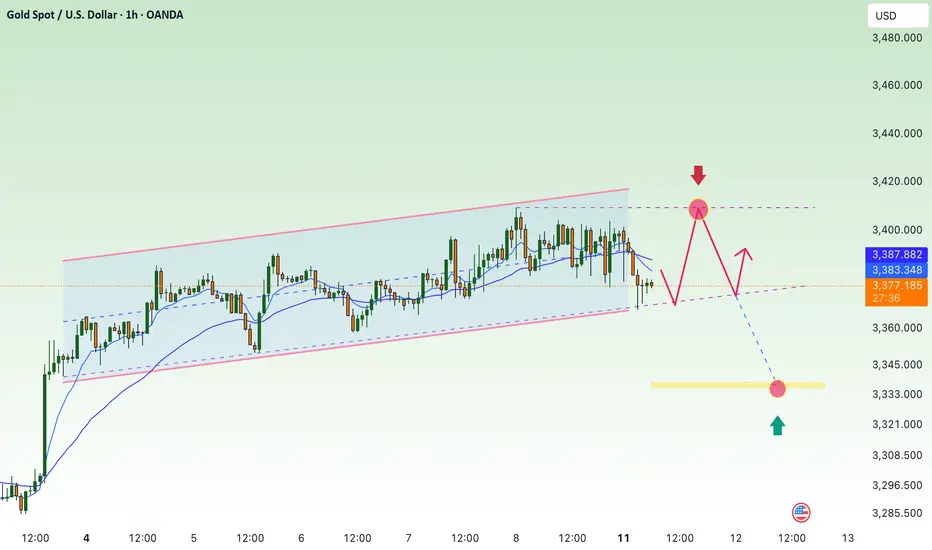
GOLD: The diamond hasn’t sparkled yet - waiting for confirmationOn the 1-hour chart of gold, a diamond pattern is forming at the top of an ascending channel. The current price is 3378, and the asset remains within the structure, without confirming a reversal yet. The key area is the 0.705–0.79 Fibo zone (3361.5–3358), which aligns with the lower boundary of the diamond. At this stage, the pattern is not complete — there's no break of the base, so the move is still pending.
Technically , the market is showing signs of momentum fading and a possible transition into a correction, but it's too early to call it without a clear break and close below 3361, which represents the lower edge of the diamond. If the bearish scenario plays out, the next targets are 3333 and 3324, projected from the pattern itself.
Fundamentally , the picture remains mixed: the dollar has stabilized temporarily, and expectations around U.S. interest rates continue to create uncertainty. Gold is reacting to all of this, but without a clear macro trigger, the upside may remain limited.
Tactical plan: Watch how price behaves in the 3361.5–3358 zone. If a reversal pattern forms, followed by a break to the downside, a short opportunity may open after a retest.- with targets at 3333 and 3324. If that break doesn't happen, and price moves higher, the diamond structure breaks to the upside, and the bearish scenario is invalidated.
As they say until the base breaks, it’s just a shiny piece of the chart, not a diamond. Watch closely, act on confirmation, not assumptions.
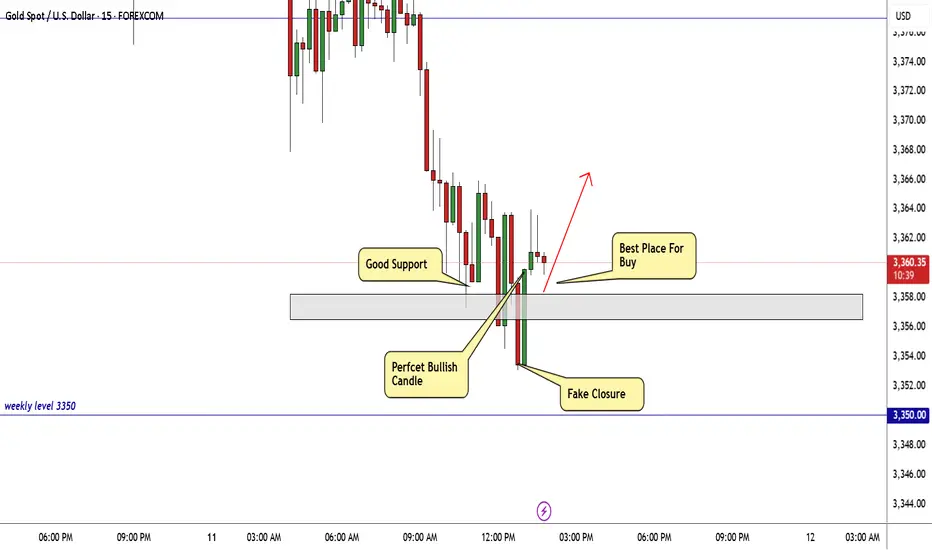
GOLD Melted , Clear Chance To Buy It Now , 150 Pips Waiting !Here is My 15 Mins Gold Chart , and here is my opinion , the price go down very hard after touch 3400.00 and melted to 3353.00 and we finally above 3358.00 and we have a 30 Mins Candle closure above it And Perfect Breakout and perfect bullish price action , so we have a good confirmation now to can buy it and we can targeting 100 to 200 pips as a small correction after this huge movement to downside in a very short period , so i will buy it to see if we have a correction for 150 to 200 pips at least .
Reasons To Enter :
1- New Support Created .
2- Bullish Price Action .
3- Bigger T.F Giving Good Bullish P.A .
4- 30 Mins Confirmation
5- Little Correction .
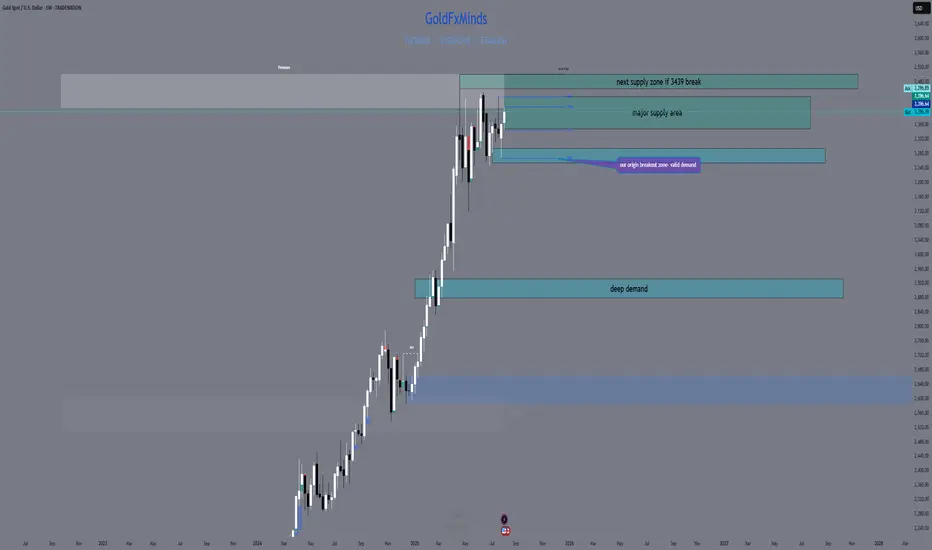
Weekly XAUUSD Outlook,August 11-15, 2025Hello traders ,
We step into a new week with gold holding its ground in the premium zone, standing just beneath the towering high of 3439. The weekly chart tells a story of persistent bullish momentum — each pullback over the past months has been shallow, showing that institutional buyers remain firmly in control.
The macro calendar is packed with potential catalysts. US CPI and PPI will be the main drivers, shaping inflation expectations and influencing the USD. Stronger readings may spark a controlled retracement, while softer data could be the trigger for gold to finally break through the ceiling at 3439. Retail Sales and Consumer Sentiment later in the week could serve as the final push to decide direction.
📊 Weekly Structure & Key Zones
Major HTF Supply: 3350 – 3439 (full wick-to-body range of the last strong sell-side push; the only true weekly supply left).
First HTF Demand: 3290 – 3260 (breakout origin, untested bullish OB).
Deep HTF Demand: 2920 – 2880 (historical liquidity pocket, unlikely without major sentiment change).
📌 Bias: Bullish — structure, EMA flow, and momentum remain in buyers’ favor, but execution requires patience as we are already in premium pricing.
🚀 Bullish Breakout Path
If we see a decisive weekly close above 3439, gold steps into clear skies. The next reference points are:
3460 – 3475 → imbalance + inducement zone on H4/D1.
3480 – 3490 → 1.618 Fibonacci extension of the last weekly swing.
Beyond this, fresh mapping will be required on daily structure.
📉 Bearish Retracement Path
A rejection from 3439, especially if reinforced by strong USD data, could pull price back into 3290 – 3260 for a potential reload. Only a weekly close below 3260 would shift the bias toward the deeper 3100–3050 area.
🔍 Confluence & Indicators
Dynamic EMA Flow: Fully bullish, EMAs stacked in buy order.
RSI: Holding in bullish territory, no weekly divergence.
FVGs: Small unfilled gaps above 3439 act as liquidity targets.
Fibonacci: Price currently reacts near 1.272 extension; 1.618 remains above.
📌 Outlook Summary
The bulls still have the upper hand, but this is a premium zone where patience matters. The best plays will come from either a disciplined pullback into demand or a confirmed breakout toward 3480–3490.
💬 Your turn — what’s your call? Are we about to see new highs, or will gold take a breath first? Share your thoughts below.
If you enjoy these outlooks, don’t forget to like and follow for precision updates.
— GoldFxMinds
Disclosure: This analysis uses Trade Nation’s price feed and is for educational purposes only — not financial advice.
GOLD ROUTE MAP UPDATEHey Everyone,
Great start to the week with our chart idea playing out, as analysed.
We got our Bullish target 3370 hit and now waiting for ema5 lock to confirm gap to 3392. Failure to lock will see lower Goldturns tested for suport and bounce, inline with our plans to buy dips.
We will keep the above in mind when taking buys from dips. Our updated levels and weighted levels will allow us to track the movement down and then catch bounces up.
We will continue to buy dips using our support levels taking 20 to 40 pips. As stated before each of our level structures give 20 to 40 pip bounces, which is enough for a nice entry and exit. If you back test the levels we shared every week for the past 24 months, you can see how effectively they were used to trade with or against short/mid term swings and trends.
The swing range give bigger bounces then our weighted levels that's the difference between weighted levels and swing ranges.
BULLISH TARGET
3370 - DONE
EMA5 CROSS AND LOCK ABOVE 3370 WILL OPEN THE FOLLOWING BULLISH TARGETS
3392
EMA5 CROSS AND LOCK ABOVE 3392 WILL OPEN THE FOLLOWING BULLISH TARGET
3416
EMA5 CROSS AND LOCK ABOVE 3416 WILL OPEN THE FOLLOWING BULLISH TARGET
3429
EMA5 CROSS AND LOCK ABOVE 3429 WILL OPEN THE FOLLOWING BULLISH TARGET
3439
BEARISH TARGETS
3348
EMA5 CROSS AND LOCK BELOW 3348 WILL OPEN THE FOLLOWING BEARISH TARGET
3328
EMA5 CROSS AND LOCK BELOW 3328 WILL OPEN THE FOLLOWING BEARISH TARGET
3313
EMA5 CROSS AND LOCK BELOW 3313 WILL OPEN THE SWING RANGE
3296
3281
As always, we will keep you all updated with regular updates throughout the week and how we manage the active ideas and setups. Thank you all for your likes, comments and follows, we really appreciate it!
Mr Gold
GoldViewFX

Gold rebound is weak, beware of further declineThe CPI data released this week was lower than market expectations, which is considered positive news. However, since it was the same as the previous reading, gold prices only rebounded briefly before entering another period of volatile consolidation.
From the 4-hour chart, gold prices have already broken through support levels. If they fail to break back above 3370 in the short term, they may continue to test the bottom.
Gold's rebound is weak in the short term, and it's trending downward. The K-line indicator is showing a bearish pattern, and the MACD indicator has formed a death cross.
Therefore, if you want to trade short, wait for a rebound around 3360. Set a stop-loss at 3370, with a target of 3340 and then 3330.
XAUUSDExpecting a BEARISH XAUUSD Throughout the week, looking at a BULLISH Dollar Index. XAUUSD will have to break the lows it previously created on lower timeframes before we join the actual SELLS.
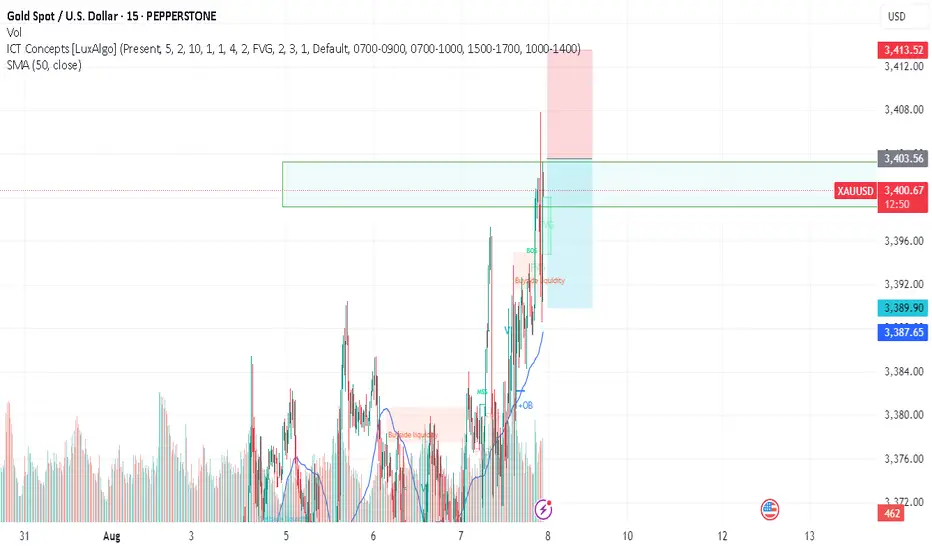
Gold failed to deliver values above #3,400.80 benchmarkTechnical analysis: Double rejection on #3,402.80 - #3,405.80 (former Medium-term Support belt now turned in Short-term Resistance) has proved to be the upside barrier for Gold and the Bull cycle of #Q2 now continues. Daily chart should Technically deliver #3,352.80 benchmark Support test, as the Descending Channel has aggressively invalidated almost all former local Lower levels. The expected #3,352.80 psychological benchmark test came earlier so the Price-action should now either dip straight to #3,352.80 benchmark or gradually rise once again within Neutral Rectangle before soaring / rising again. Regardless of the outcome, as I mentioned on my remarks on the Medium to Long-term the Ascending Channel is very strong and decisive to engage multi-Month Bullish cycle on Gold ahead. At this pace the maximum possible upside extension is #3,377.80 and then wall of Resistance zones towards #3,400.80 Weekly High’s. This is undisputed Bullish Long-term trend and total Buying domination. Underlying trend rains fully Bullish as well and that explains why Gold remains heavily pressured on Intra-day basis only.
My position: I am expecting Gold to either test #3,352.80 benchmark or even #3,342.80 and then relief rally towards #3,362.80 - #3,365.80 Resistance belt or above. I will continue Buying the dips on Gold.
GOLD - been waiting for 2 weeksTeam, I have been waiting GOLD for two week to short at 3404-3410
i just woke up and missed the short
Price current at 3401 - I am shorting NOW
Target 1 at 3386 - take 70% volume and BRING STOP LOSS TO BE
Target 2 at 3365
LETS GO
Gold extending Buying sequenceAs discussed throughout my Tuesday's session commentary: "My position: I will keep Buying every dip on Gold from my key entry points / #3,357.80 is one of them expecting final push above the Resistance zone towards #3,400.80 benchmark."
If you have been Buying every dip as per my suggestion you would be in excellent Profits now. I have been Buying Gold from my #3,357.80, #3,367.80, #3,372.80 and #3,378.80 key entry points (last batch of Buying orders closed with Target late U.S. - early Asian session last night).
Technical analysis: Gold is under unprecedented Volatility (however with Bullish underlying trend) with Gold (Xau-Usd Spot) and the Futures price on a tight spread. This is of course the product of heavy speculation in the Metals market, fuelled by the expectation that the Fed’s new talks will be accepted. Needless to mention, this environment is Gold friendly. Technically I do see current aggressive decline in form of a correction as not sustainable however I cannot approach current configuration Technically since these are Fundamentally driven sessions but I do expect a slight pullback back towards #3,352.80 - #3,357.80 only for Gold to soar even more, as the main Support and Higher High’s High’s / Low’s cluster is nearby (#3,357.80 - #3,367.80). Despite Bond Yields stabilization, the continuous Low’s on DX on parabolic decline are adding Buying pressure on Gold and limiting all Selling advance which I am utilizing to it's maximum with my set of Buying orders.
GOLD → The rally following weak NFP data may continueFX:XAUUSD is moving into distribution (rally) on the back of unexpected NFP data released on Friday. The dollar is plummeting...
Fundamentally, the gold market is getting support from an influx of funds after the unexpectedly weak NFP report. Against this backdrop, Trump said that the employment data had been “rigged” to make him look bad...
I believe that the situation is somewhat different: the president's administration failed to control this moment, hoping to see positive dynamics. Powell now has a small trump card to control his actions. The reduction in interest rates will most likely be postponed until the fall.
Technically, on D1, gold is rebounding from the support of the global trading range, forming a local bullish trend that coincides with the global one.
Resistance levels: 3362.8, 3383, 3433
Support levels: 3345, 3334
Gold is exiting the local downward channel, breaking through resistance at 3334 and 3345. Consolidation is forming, and by the end of the session, the price will break through resistance at 3354.75. The market is quite strong. Focus on two levels: 3362.8 and 3354.7. At the opening of the session, the price may attempt to break through the resistance level of 3362.8. If gold consolidates above this level, growth may continue. If not, then before further growth, the market may test the support level...
Best regards, R. Linda!

Gold price accumulates above 3340⭐️GOLDEN INFORMATION:
Gold (XAU/USD) eased toward $3,390 in early Asian trading on Monday, as a modest rebound in the U.S. Dollar weighed on the precious metal ahead of Tuesday’s U.S. inflation report.
A firmer Greenback, coupled with a broader risk-on mood, kept prices capped below the key $3,400 psychological level. However, growing expectations for a Federal Reserve rate cut in September continue to offer underlying support for the non-yielding asset.
On Saturday, Fed Governor Michelle Bowman noted that recent soft employment data reinforced her concerns about labor market fragility and bolstered her view that three rate cuts could be appropriate in 2025. Markets are now pricing in an 89% probability of a September rate cut, with at least two reductions expected by year-end.
⭐️Personal comments NOVA:
At the beginning of the week, gold price slightly decreased below 3380. It is still mainly accumulating, waiting for an increase reaction to return to 3400 and move sideways.
⭐️SET UP GOLD PRICE:
🔥SELL GOLD zone: 3428- 3430 SL 3435
TP1: $3418
TP2: $3408
TP3: $3392
🔥BUY GOLD zone: $3336-$3338 SL $3331
TP1: $3345
TP2: $3357
TP3: $3370
⭐️Technical analysis:
Based on technical indicators EMA 34, EMA89 and support resistance areas to set up a reasonable BUY order.
⭐️NOTE:
Note: Nova wishes traders to manage their capital well
- take the number of lots that match your capital
- Takeprofit equal to 4-6% of capital account
- Stoplose equal to 2-3% of capital account
GOLD MARKET ANALYSIS AND COMMENTARY - [Aug 11 - Aug 15]This week, the international OANDA:XAUUSD price has been almost flat, fluctuating only within the range of 3,345 USD/oz to 3,408 USD/oz. Notably, every time the gold price exceeds 3,400 USD/oz, it is pushed down below this level by profit-taking pressure.
Next week, the US Bureau of Labor Statistics will release its July Consumer Price Index (CPI) on Tuesday. Accordingly, the CPI in July is forecast to increase to 2.8% compared to the same period last year, from 2.7% in June. According to many experts, this increase in inflation is not strong enough to make the Fed delay cutting interest rates at its meeting in September. Therefore, strong fluctuations in the annual CPI figures will strongly affect the Fed's interest rate cut expectations.
If the CPI in July rises above the 3% threshold, it will reduce expectations of the FED cutting interest rates in September, helping the USD increase, pushing gold prices down next week. Conversely, if the CPI in July falls below forecasts, it will push gold prices up sharply next week.
In addition to CPI data, the US also announced retail sales for July. The US economy is driven by consumption, so if retail sales decline sharply, it will also negatively impact the USD, thereby pushing gold prices up next week and vice versa.
With the current context and the above economic data, it is likely that gold prices next week will continue to move sideways, with no strong fluctuations.
📌In terms of technical analysis, the level of 3,350 USD/oz is the first support level, followed by the area of 3,285 - 3,300 USD/oz. Meanwhile, the level of 3,450 USD/oz is a strong resistance level, surpassing this level, the gold price next week has the opportunity to challenge 3,500 USD/oz. However, this possibility is not highly appreciated.
Notable technical levels are listed below.
Support: 3,371 – 3,350 – 3,340USD
Resistance: 3,400 – 3,430 – 3,350USD
SELL XAUUSD PRICE 3452 - 3450⚡️
↠↠ Stop Loss 3456
BUY XAUUSD PRICE 3349 - 3351⚡️
↠↠ Stop Loss 3345
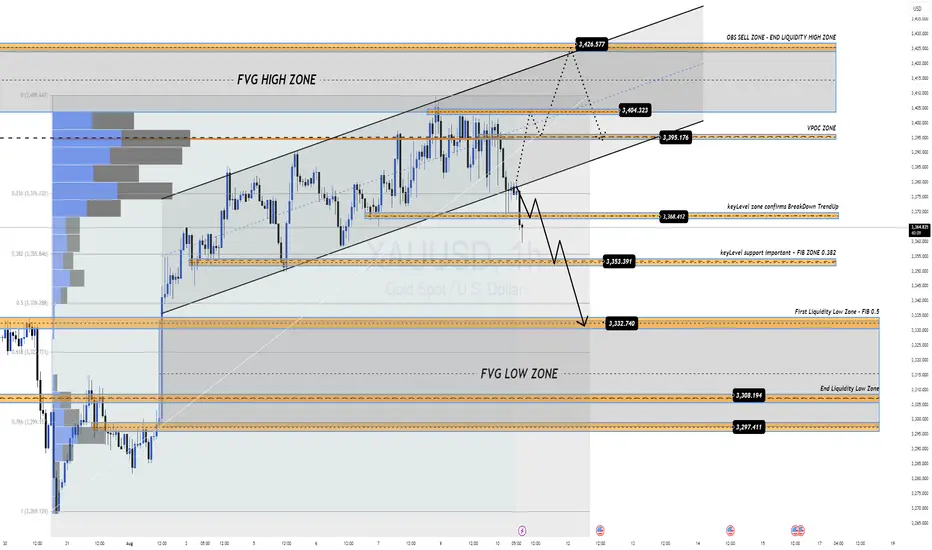
My first take on XAUUSDI see this last fall as a very clear sweep of liquidity (the recent lows. After that i see an impulsive push away from this zone giving me a change of character. Left behind is an FVG on hopurly chart that aligns within the kill zone on my Fibonacci tool. and that is where i would enter. I would expect price to mitigate this FVG. Another confluence is that we created many IFVG's on the way up showing balanced price action. Only one more confluence i would have liked is a HTF order block from the liquidity sweep but only have one on the 5 minute. i will monitor. First tp is that internal liquidity from the move, second tp is the external liquidity where we have had consolidation and a few failed attempts to break above this opening gap fvg. thanks for looking. any comments welcome,

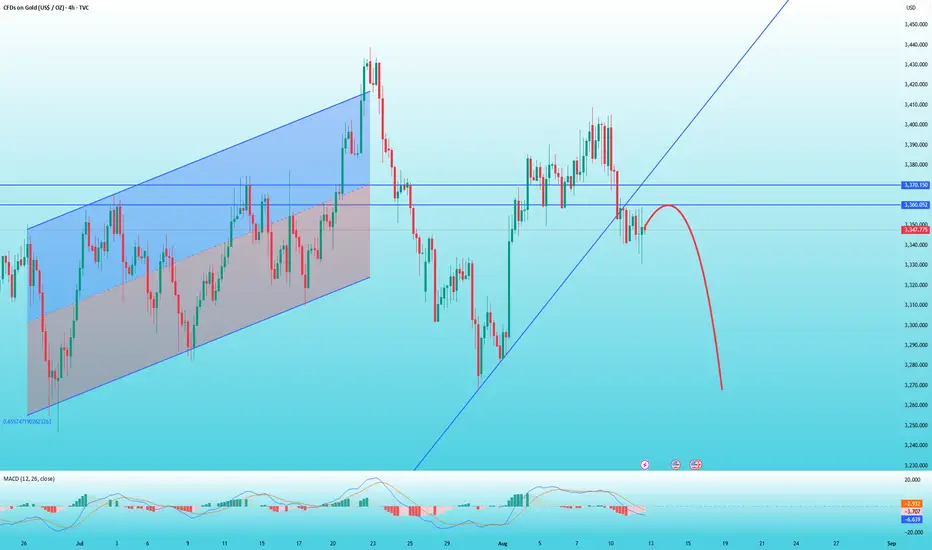
Will We See a Break Down or a Sharp Rebound to Key Resistance?XAUUSD – Will We See a Break Down or a Sharp Rebound to Key Resistance? | MMFlow Trading 🔥
Market Overview
Gold dropped sharply at the start of the week as profit-taking hit the market and late-week FOMO buyers from last week were stopped out.
Buy-side momentum has clearly slowed, and sellers are waiting for a confirmed breakdown from the rising channel to target lower liquidity zones around 335x and 333x.
At present, price is reacting around the 336x – 337x key support with an H1 long-wick candle showing buying pressure.
Trading Outlook
We need a clear breakdown confirmation (candle close with volume) before executing a short entry.
If price holds and fails to break, we could see a rebound back towards major resistance zones 339x – 340x – 342x.
This week is loaded with high-impact USD data – CPI & PPI – both strong inflation indicators that could put short-term pressure on gold if data comes out USD-positive.
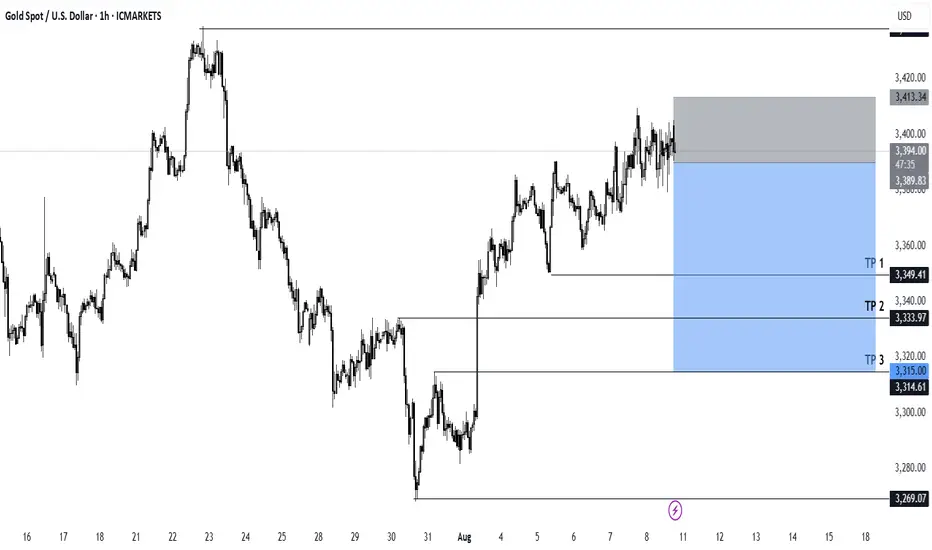
📌 Trading Plan
BUY SCALP
Entry: 3353 – 3351
Stop Loss: 3345
Targets: 3358 → 3362 → 3366 → 3370 → 3375 → 3380
BUY ZONE
Entry: 3332 – 3330
Stop Loss: 3325
Targets: 3336 → 3340 → 3345 → 3350 → 3360 → 3370 → 3380
SELL SCALP
Entry: 3394 – 3396
Stop Loss: 3400
Targets: 3390 → 3385 → 3380 → 3370 → 3360
SELL ZONE
Entry: 3425 – 3427
Stop Loss: 3430
Targets: 3420 → 3415 → 3410 → 3405 → 3400 → 3390 → 3380
⚠ Risk Management Notes
This is a high-impact news week – expect false breakouts before and after CPI/PPI releases.
Avoid oversized positions into news; keep risk tight.
If price breaks above 3430 with strong volume, the current sell setup is invalid → wait for a new market structure before re-entering.
GOLD hesitates, inflation data day in focusOANDA:XAUUSD came under pressure on Monday (August 11) and recovered slightly this morning, Tuesday (August 12). US President Trump made it clear that he would not impose tariffs on gold imports, erasing earlier market concerns about disruptions to the global gold supply chain. Investors are now turning their attention to US inflation data, due to be released this week, to gauge the Federal Reserve's interest rate outlook.
Tariff doubts dissipated
Trump tweeted: "There will be no tariffs on gold!" without providing further details. The announcement brought relief to the global gold market.
As a global gold transit and refining hub, Switzerland was once considered the "biggest victim" but Trump's latest statement essentially eliminated that risk.
Investor focus shifts to inflation
As the tariff uncertainty fades, traders will turn their attention to other market factors, the most important of which is the Federal Reserve's interest rate outlook.
• If US inflation data comes in higher than expected, this could give the Federal Reserve reason to pause its rate cut in September, which would put pressure on gold prices;
• But if the data is mild or even weak, this is expected to support gold prices as market expectations of lower interest rates are further reinforced.
Market Outlook
In the short term, gold is entering a correction phase after tariff concerns are resolved, and price movements may be more influenced by US dollar and inflation data.
If inflation remains low and the US Federal Reserve (Fed) sends a dovish signal, gold prices are expected to maintain high support levels; however, if inflation exceeds expectations and the US dollar strengthens, gold prices may face the risk of a deeper correction.
In the medium to long term, gold remains valuable as a safe haven and an asset allocation channel amid global economic uncertainty and the possibility of low interest rates.
The market expects core CPI to rise to 3.0% year-on-year in July, up from 2.9% in June. The pass-through of tariff costs could spur a rebound in goods inflation.
• If the data beats expectations, the Federal Reserve could delay a rate cut.
• Conversely, a weaker reading would increase the odds of a rate cut in September, with futures currently implying an 87% chance.
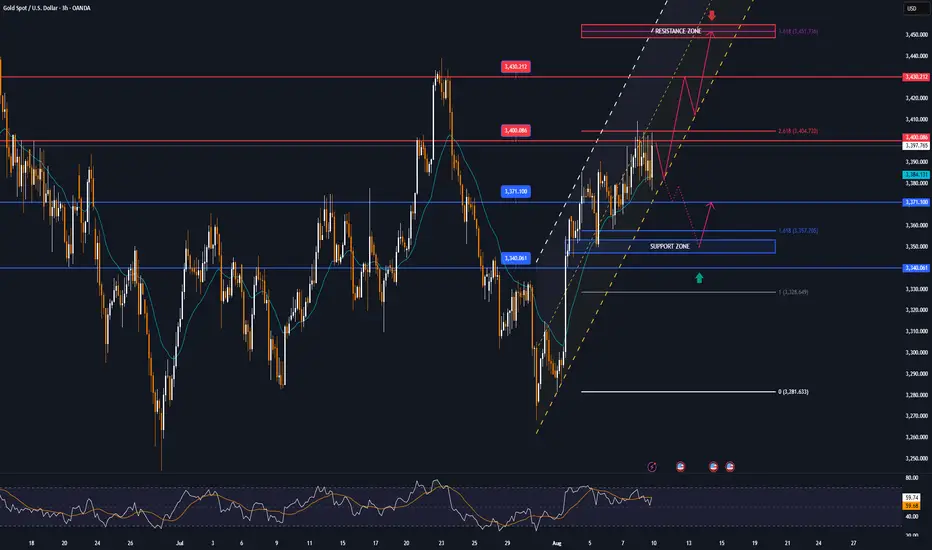
Technical Outlook Analysis OANDA:XAUUSD
Gold recovered, operating around the EMA21, showing that the overall market sentiment is still hesitant to wait for a breakthrough impact from the fundamental side.
In the short term, gold is under technical pressure from the EMA21, and the 0.236% Fibonacci retracement level, and for gold to have all the conditions for a continued bullish expectation, it needs to break above the said Fibonacci retracement level, after which the short-term target is the raw price point of 3,400 USD.
If gold continues to break the raw price point of 3,400 USD and operates above this level, the possibility of a new bullish cycle will be opened with the next target at 3,430 USD - 3,450 USD.
On the other hand, gold is still above $3,300, which does not allow the conditions for a bearish cycle to appear. That means as long as gold remains above the original price point of $3,300 and the 0.382% Fibonacci retracement level, it can still increase in the short term.
In case gold sells below $3,300, it will be eligible for a bearish cycle, the target then will be $3,246 in the short term, more than the 0.50% Fibonacci retracement level.
On the momentum front, the RSI hovers around the 50 mark, indicating a hesitant market sentiment, but an upward bend from 50 would be a positive signal for upside potential.
For the day, the overall outlook remains bullish and the key points to watch are listed below.
Support: $3,340 – $3,310 – $3,300
Resistance: $3,371 – $3,400
SELL XAUUSD PRICE 3377 - 3375⚡️
↠↠ Stop Loss 3381
→Take Profit 1 3369
↨
→Take Profit 2 3363
BUY XAUUSD PRICE 3298 - 3300⚡️
↠↠ Stop Loss 3294
→Take Profit 1 3306
↨
→Take Profit 2 3312
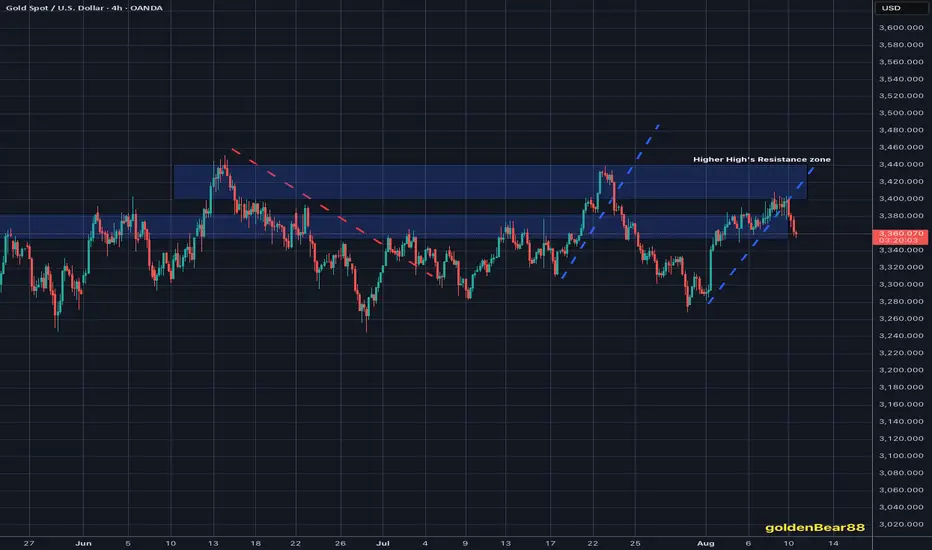
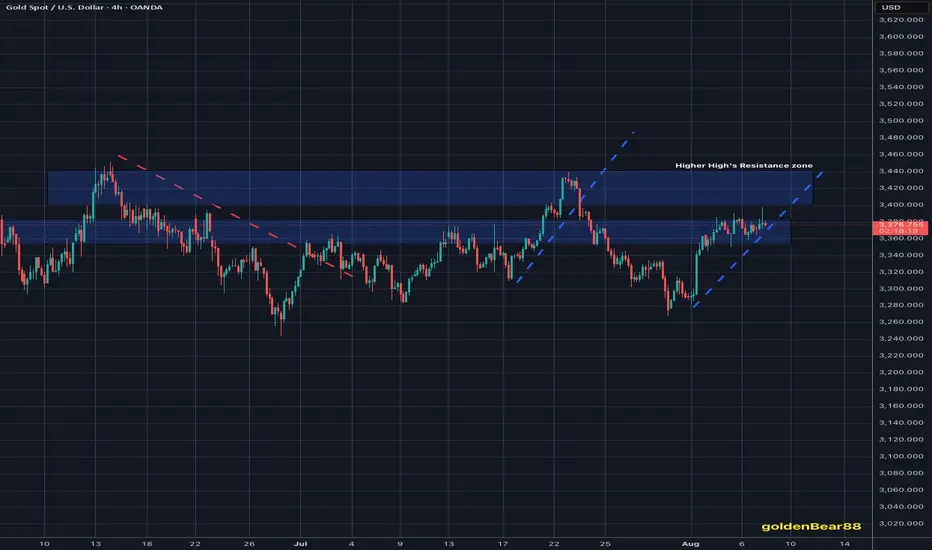
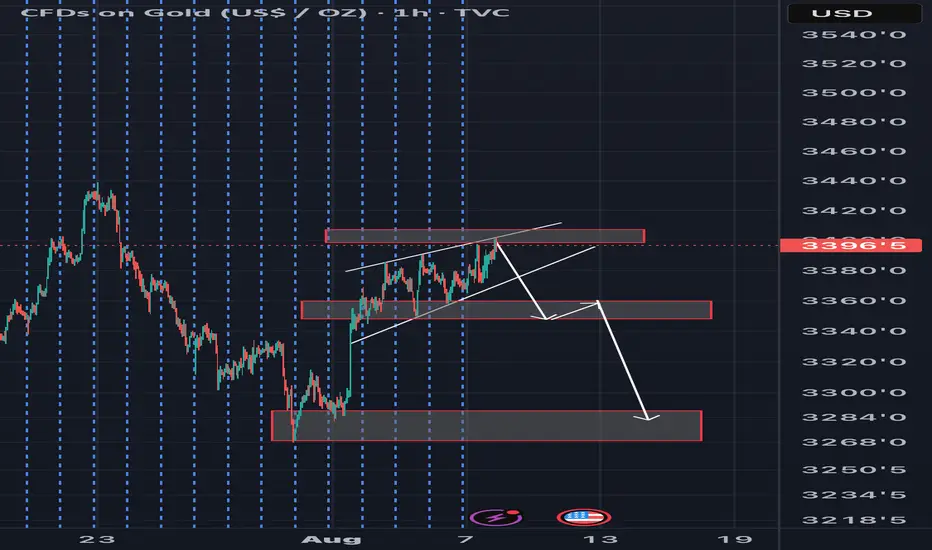
Gold still looking bearish . Gold still looking bearish and respecting the upper trend line . My analysis is just as simple as previous ones hence easy to comprehend .
This is still a sell in as much price holds below the upper trend line . A break below the lower trend line will lead price to 3340s and a break below this again takes us to last weeks low at 3280s - 3270s . Still bearish biases until upper trendline is broken completely .
My #3,400.80 Medium-term Target deliveredAs discussed throughout my yesterday's (and many other analysis) commentary: If you have been Buying every dip as per my suggestion you would be in excellent Profits now. I have been Buying Gold from my #3,357.80, #3,367.80, #3,372.80 and #3,378.80 key entry points (last batch of Buying orders closed with Target late U.S. - early Asian session last night).
Technical analysis: Gold is under unprecedented Volatility (however with Bullish underlying trend) with Gold (Xau-Usd Spot) and the Futures price on a tight spread. This is of course the product of heavy speculation in the Metals market, fuelled by the expectation that the Fed’s new talks will be accepted. Needless to mention, this environment is Gold friendly. Technically I do see current aggressive decline in form of a correction as not sustainable however I cannot approach current configuration Technically since these are Fundamentally driven sessions but I do expect a slight pullback back towards #3,352.80 - #3,357.80 only for Gold to soar even more, as the main Support and Higher High’s High’s / Low’s cluster is nearby (#3,357.80 - #3,367.80). Despite Bond Yields stabilization, the continuous Low’s on DX on parabolic decline are adding Buying pressure on Gold and limiting all Selling advance which I am utilizing to it's maximum with my set of Buying orders.
Technical analysis: Gold is Trading on my predicted values as I really don’t mind current consolidation candles within newly formed Hourly 1 chart's Neutral Rectangle. Price-action has made marginal High's on Hourly 4 chart with #3,409.80 (local High's I mentioned earlier that can stall the uptrend) showcasing strong durability. If #3,400.80 benchmark however gets invalidated on High Volume (the last #3-session horizon had been really strong however ahead of local Resistance zone test very anemic) then I can call a test of the #3,427.80 Higher High's extension which represents my next Short-term Target. Gold is extremely Overbought however there are no signs of uptrend exhaustion as I don’t see any firm reason why #3,400.80 benchmark wouldn’t be re-tested within #2-session horizon. Remember, Weekly chart (#1W) still needs a slightly Lower Price (mentioned on previous remarks) before further uptrend as I mentioned that Gold dips only to rise more (Buying accumulation). DX is testing my Higher Low’s heavy Resistance zone as I haven’t got any reservations or doubts regarding its correlation to Gold.
My position: I have re-Bought Gold from #3,382.80 many times throughout yesterday's session and did final aggressive set of Buying orders on #3,388.80 calling for #3,400.80 benchmark late U.S. session which was delivered. I have closed all on #3,400.80 benchmark utilizing current upside push to it's maximum however Gold extended the rise towards #3,409.80 even. I stayed awake and re-Bought #3,395.80 few times since I knew Price-action will be circling #3,400.80 mark and consolidate. I will call it for this week and take early weekend break as I am more than satisfied with my Profits.