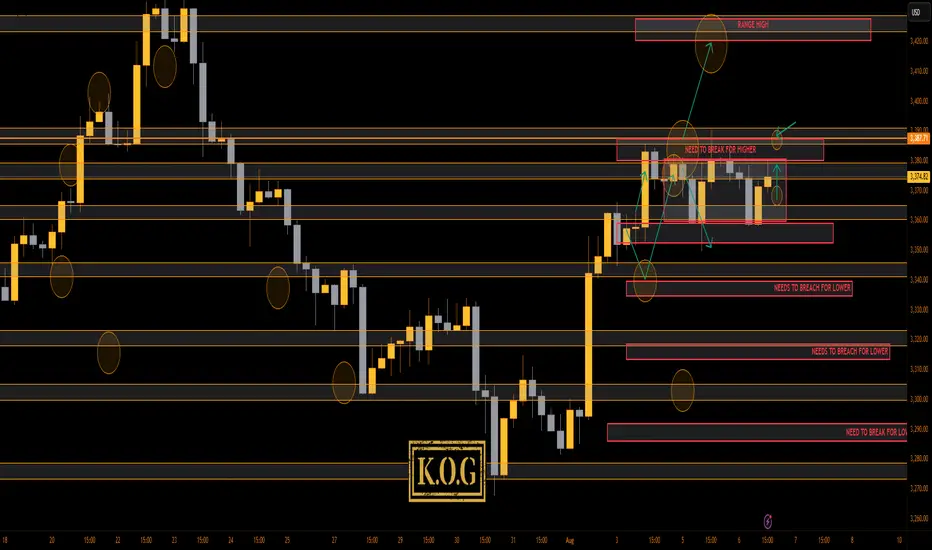
THE KOG REPORT - UpdateEnd of day update from us here at KOG:
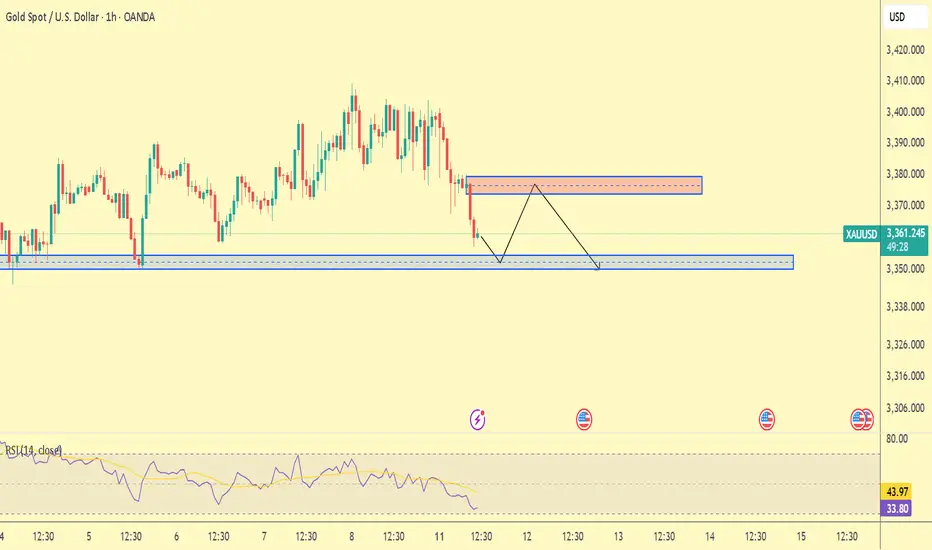
As anticipated in the morning review, low volume day which resulted in this range still in play and price just making the sideways up and down move.
That's where we stand at the moment with no break above the red box for higher pricing at the moment. We managed to bag 3 decent set ups of 50pips each but we didn't get the move we wanted.
We have highlighted the key areas now and if you look closely on the hourly, we're in slight triangle formation. The range has also been drawn on the chart so we'll wait for the break out now.
Support here 3365, while resistance stands at the 3385 level.
Not much more to report on gold unless we break above that red box.
As always, trade safe.
KOG
XAUUSD trade ideas
GOLD STYLEgold is findig some power to rise up, little liquidity that finded. i thounght after touch top target we have downside agaqin. good luck
How to correctly grasp the gold trading opportunities?At present, the suppression of 3410 is still quite strong. After testing the resistance, a short-term long-short reversal was formed, and it retreated and broke the 3380 low support. It is expected to test the 3360 and 3345 moving average supports below today. After falling below the 3380 bullish starting point, the short-term trend will temporarily be mainly downward. Only when it is close to the low support can a new layout be made. Therefore, wait patiently for the low point to be retreated and stabilized before considering going long on gold.
Gold long from 3344Looking for longs at around this region.
Waitinng for asian session to open and then i will see if it sweeps the 3340 level or it does reverse from here without sweeping ,regardless longs look good from here.
Financial markets are set to receive a slew of important newDomestic gold prices fell due to the impact of world gold prices. In the international market, after closing the week at a high level, today's gold price suddenly reversed and plummeted when opening the new trading week.
Gold prices fell contrary to the forecast of analysts and investors when they expected the precious metal to continue to increase this week.
This week, the market is waiting for a lot of economic information such as the meeting to announce Australia's interest rate decision; the US consumer price index (CPI) report for July; the US producer price index... The data of this information is expected to affect the gold price.
This morning, the USD index (DXY) in the international market recovered to 98.1 points, also creating pressure to reduce gold prices.
Gold Trade Plan 12/08/2025Dear Traders,
i expect price will start upward movement from 2 Level`s Area !
Level 1 : 3340-3344
Level 2 : 3322-3326
First Target : 3370
Second Target : 3400
Sl : below 3300
Regards,
Alireza!
Regards,
Alireza!

Gold support has been confirmed, buy with confidenceThe most anticipated outcome for the gold market this week is tomorrow's CPI data. After today's pullback during the Asian and European trading sessions, the current price has reached support levels. Before the CPI release, I believe volatility will be minimal, with a high probability of limited fluctuations.
The chart shows that 3350 is a key support level. After several hours of testing, 3350 has stabilized, so we can buy at this level, with the initial target being 3360, followed by 3380.
Gold delivering excellent ProfitsAs discussed throughout my yesterday's session commentary: "My position: I just Bought #3,345.80 Support potential reversal and my third set of Buying orders are running in excellent Profit calling for #3,357.80 Resistance test extension. This is my last set of orders ahead of CPI numbers today. I will Trade after the news. Gold is Trading in Neutral Rectangle and Price-action will pick a side soon / until then, Neutral Rectangle will always offer Trading opportunities inside."
I have engaged another set of Buying orders after #3,345.80 set of Buying order hitting their Target on #3,357.80, and I have waited for another push to the downside where I can re-Buy Gold and opportunity appeared on #3,343.80 where I went full force set of Buying orders, closing all on #3,350.80 (Profit was already excellent since I had #14, #10.00 Lot Buying Volumes engaged). I am utilizing Neutral Rectangle nicely as advised that I will within my recent remarks. Well done if you followed!
Technical analysis: Gold is delivering decent Neutral Rectangle action but such may be already over due DX once again in continuation of Selling sequence which may add Buying pressure on Gold. Only if #3,339.80 gets invalidated (less likely), I will contemplate Selling the market as at the moment / Hourly 1 chart’s reveals only Buying opportunities. I didn't expect today’s E.U. session movements to be relevant, as I await full Buying confirmation on U.S. session. Current Support zone test is so far unsuccessful.
My position: Indeed I had Selling signals and pointers on my instruments however Selling current Bearish bias on DX can only backfire, therefore I have engaged set of Buying orders on #3,353.80 which are running currently in Profit and will only continue Buying throughout yesterday's session with both Swing and Scalp orders from my key entry points. #3,377.80 is Resistance to monitor if #3,367.80 gives away to the upside.
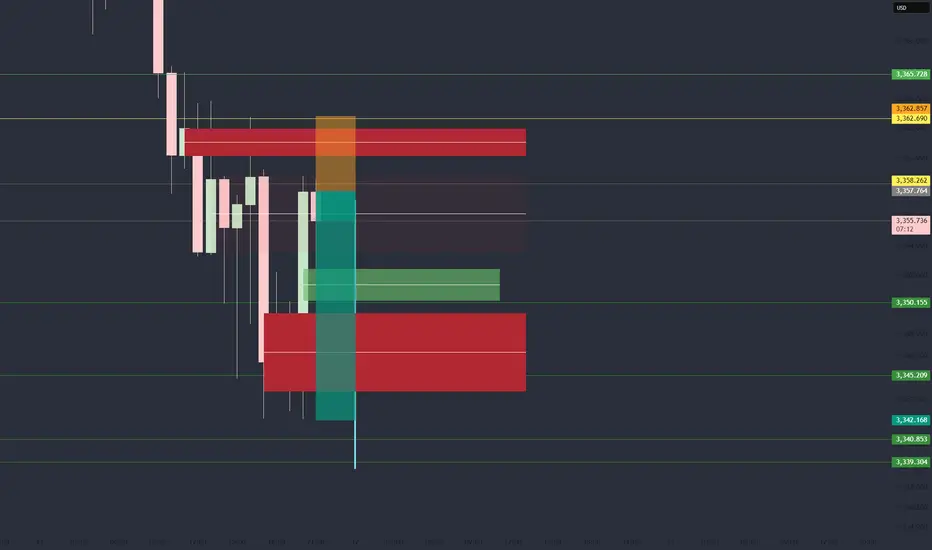
GOLD DAY END SELLStoploss is based on 4h wick window
Red rectangles are block that keep price squished
Ideally see this hour close at >50% of previous buy body
and make a clean daily body candle, which then tomorrow oscillates or pushes further down
GOLD LONG FROM SUPPORT
GOLD SIGNAL
Trade Direction: long
Entry Level: 3,359.88
Target Level: 3,392.28
Stop Loss: 3,338.21
RISK PROFILE
Risk level: medium
Suggested risk: 1%
Timeframe: 4h
Disclosure: I am part of Trade Nation's Influencer program and receive a monthly fee for using their TradingView charts in my analysis.
✅LIKE AND COMMENT MY IDEAS✅

Gold Trade Plan 11/08/2025Dear Traders,
Market will be Range , and i expect price move between 3255-3280 Today,
No News ,No big movement !!
Regards,
Alireza!
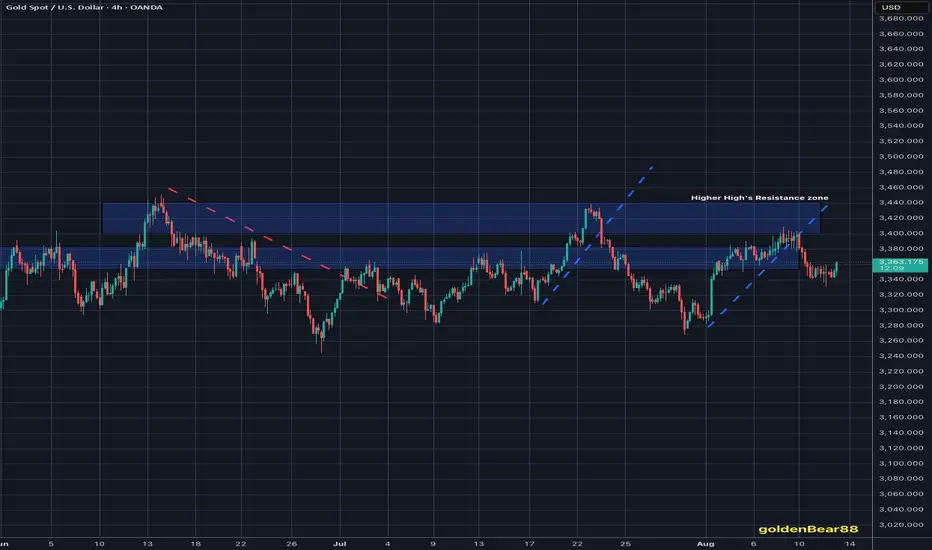
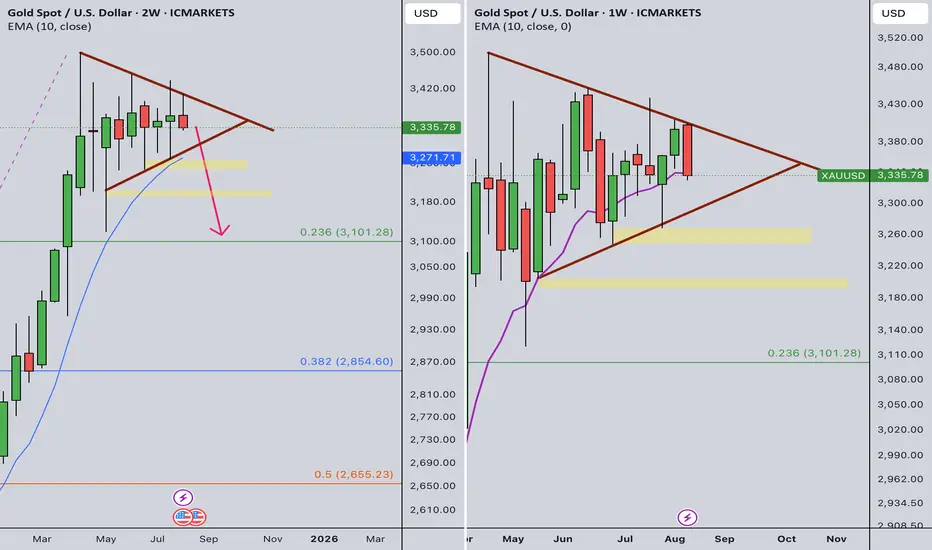
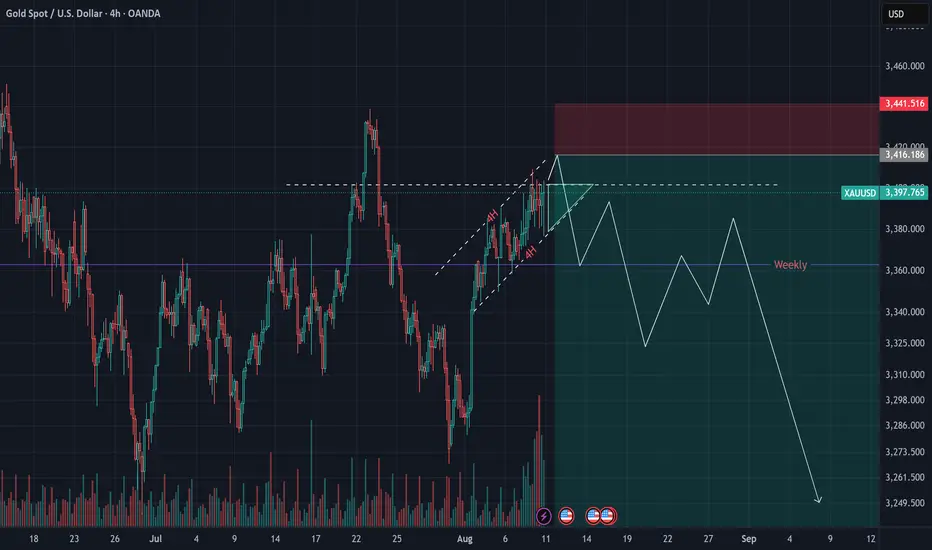
Gold Weekly Summary and Forecast 8/17/2025Gold did fall from 3400 as predicted last week. In 2W TF, it also formed a bearish bar. The bearish structure is still valid and gold should be on its way to 3k.
On the other hand, in 1W TF, I have also identified the triangle structure. Normally this structure can be either way. It can be a continuation signal or trend reversal, which depends on which line is broken.
Therefore, it is crucial to see how next week's bar will be closed. If it closes under the support line, the bearish trend will be confirmed.
For next week's trading strategy, I am expecting the price to at least touch the support line, which is around 3295.
XAUUSD Analysis todayHello traders, this is a complete multiple timeframe analysis of this pair. We see could find significant trading opportunities as per analysis upon price action confirmation we may take this trade. Smash the like button if you find value in this analysis and drop a comment if you have any questions or let me know which pair to cover in my next analysis.

Gold on Bearish Technicals but Fundamentals prevailsTechnical analysis: Gold is extending the sideways action, following the continuation of the former Hourly 1 chart’s Ascending Channel, as Bond Yields and DX are Trading on losses for the #2nd straight session (DX comfortably Trading below the Hourly 4 chart’s Resistance zone and Bond Yields on spiral downtrend), current environment is certainly (Fundamentally) Gold friendly (should spike upwards) and even with Bearish Technicals aiming for #3,327.80 Support extension or below, Buyers are always appearing and Gold printed miraculous recovery even though DX (strongest correlation at the moment) is comfortably Trading below the Resistance zone which is confirming my thesis that Bullish (at least for Gold) Fundamentals are here to stay. Spot how Gold's strong Selling level of the #3,362.80 - #3,372.80 one is far from fair symmetrical manner with disastrous side Swings on DX as the strongest correlation so far. Gold should be Neutral / Bearish on Short-term, but Gold is well known as relief asset (should soar as relief) with Inflation rising and Money supply chart’s maxing the ATH is DX losing with every candle, Gold can be timed for upswing anytime.
My position: I have Sold Gold throughout yesterday's session from #3,370.80 session High's, and once again from #3,360.80 towards #3,352.80 benchmark. I was aware that this morning's dip towards #3,342.80 will continue unless #3,348.80 and #3,352.80 benchmark are recovered, now as those got invalidated to the upside, Bullish Short-term trend is restored as I aim #3,400.80 benchmark.
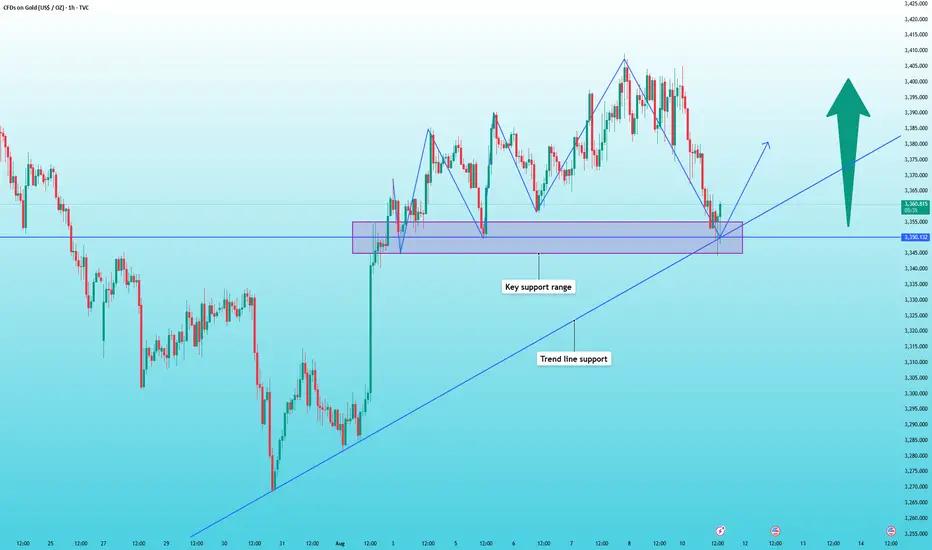
Gold Market Weekly Outlook📊 Gold market opens ahead of weekly candle formation, sweeping through imbalance at the 3360’s. The weekly stance remains bullish, with momentum building toward a potential break of the 3420’s supply zone.
🟡 Key Watch Points:
Imbalance Cleared: 3360’s
Weekly Target: 3420’s
Bias: Bullish continuation if price holds above 3360’s
Gold (XAU/USD) Analysis – August 10, 2025We’ve been waiting for gold to break above the 3400 level for quite some time.
Despite multiple tests and deep wicks into this zone,
I don’t expect the coming week to bring a fresh high for gold.
With price compression between 3390 – 3400,
I anticipate that the market will be selling gold this week.
We should also expect a stop hunt on sellers before the drop.
My preferred short entry zone remains 3415 – 3430,
with a probable target around 3200,
making this risk-reward setup attractive.
XAUUSD Gold Trading Strategy August 15, 2025:
Spot gold prices edged down from intraday highs in Asia on August 14, 2025, approaching the $3,330/ounce area. Earlier, the US Dollar Index weakened to a two-week low of 97.839, along with falling US Treasury yields, pushing gold prices back up.
Fundamental news: The market is now pricing in a 97% chance of the US Federal Reserve cutting interest rates in September, with an increasing likelihood of one or even two more rate cuts before the end of the year. Lower borrowing costs and falling yields tend to support gold as the metal does not pay interest.
Technical analysis: After breaking out of the rising channel yesterday, gold prices have approached the old bottom of $3,330, and there is a high possibility of forming a bullish flag pattern on the H1 chart. However, this model needs a lot of time to create enough strength. We will mainly trade in the current bullish flag model.
Important price zones today: 3325 - 3330 and 3355 - 3360.
Today's trading trend: BUY hold.
Recommended orders:
Plan 1: BUY XAUUSD zone 3325 - 3327
SL 3322
TP 3330 - 3340 - 3350 - 3360 - OPEN.
Plan 2: SELL XAUUSD zone 3358 - 3360
SL 3363
TP 3355 - 3345 - 3335 - 3325.
Wish you a safe, successful and profitable weekend trading day.🌟🌟🌟🌟🌟

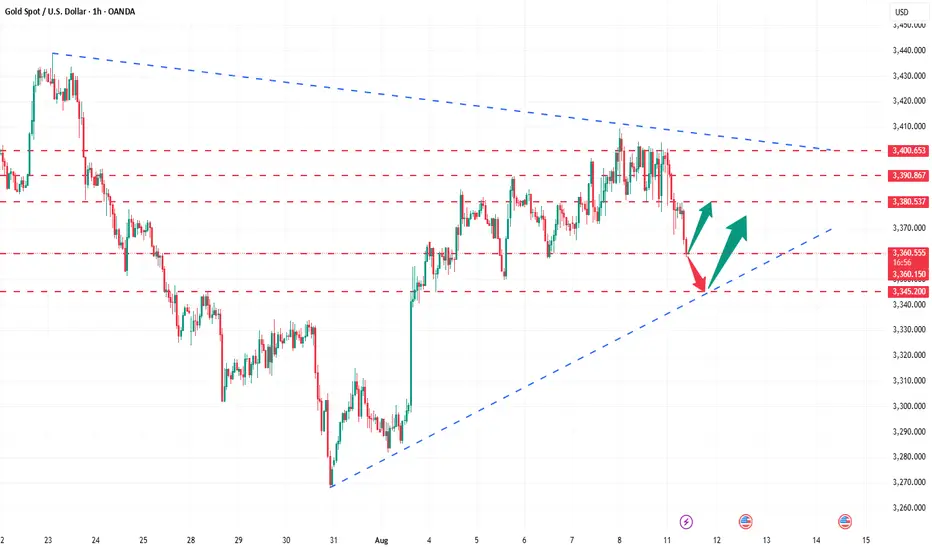
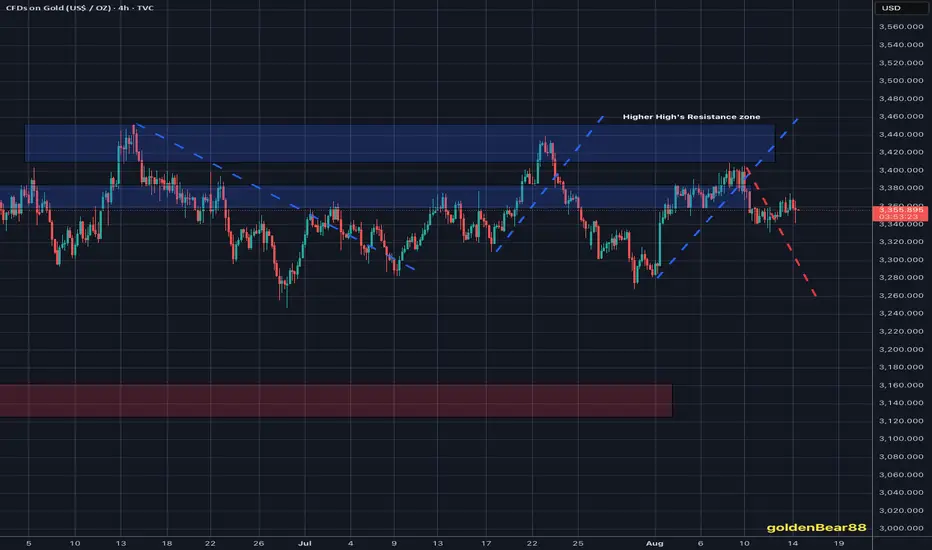
Gold volatility Continues in the 3250-3450 RangeGold’s role as a safe haven in times of stress, whether geo-political or tariff related has kept prices riding a rollercoaster up and down between range highs at 3450 and range lows at 3250 since the start of June.
It’s popularity with central banks, led by China, as a diversification asset away from the US dollar has also helped to underpin prices on dips, with the PBOC reporting purchases of the popular metal for 9 straight months in a row.
This week that volatility has continued as prices slipped 2% from opening levels around 3400 on Monday to register a low of 3331 before rebounding back 1% higher again. The reason for the drop, confirmation from President Trump that Gold imports won’t be subject to tariffs, providing clarity to a situation that had caused chaos across global markets into the end of the previous week.
However, looking forward, with Gold currently trading around 3360 again, there are several drivers in play for traders to focus on. The first, is the on-going situation surrounding Federal Reserve (Fed) interest rate cuts. This can be an important consideration given that as a general rule Gold tends to benefit from a lower interest rate environment and vice versa. This is due to it not being an interest-bearing asset when owned.
After an in-line US CPI reading on Tuesday, traders have begun to consider the possibility of a potential jumbo 50bps (0.5%) rate cut when the Fed meet next on September 17th. More impetus has been given to this viewpoint after US Treasury Secretary Scott Bessant stated via Bloomberg TV on Wednesday that he believes US interest rates should be 150-175bps (1.5-1.75%) lower, even adding his weight to the possibility of a 50bps cut in September.
Secondly, President Trump and President Putin meet in Alaska on Friday for a face to face summit to discuss what it would take to achieve an extended ceasefire or even peace in Ukraine. This meeting takes place after a big week of diplomacy from European nations who wanted to make their own viewpoints known, including Ukraine’s unwillingness to give up territory to make a deal happen.
The potential headlines from this meeting, alongside the outcome of today’s US PPI (factory gate inflation) release at 1330 BST could have an influence on the direction of Gold prices into the weekend.
Technical Update: Range Parameters Clearly Set
A sideways range in price action typically forms when there is a balance between both buyers and sellers. Price strength is capped at a level where sellers are found to halt the advance and push prices lower. Price declines are then limited by buyers who provide support at lower levels, leading to a recovery in price. This back-and-forth activity creates a stable range until a breakout occurs.
This would appear to be the current backdrop for Gold
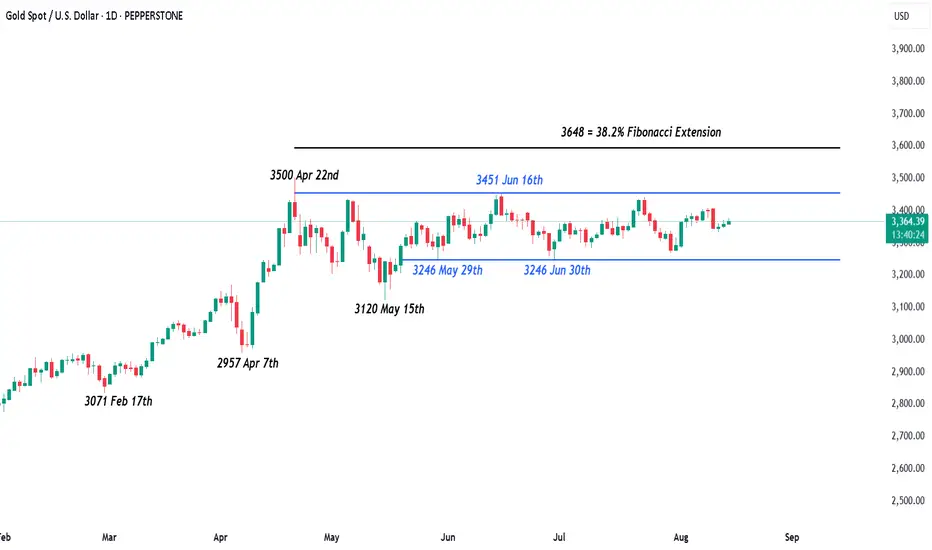
As the chart above shows, recent attempts at Gold price strength have been capped by 3451, which is equal to the June 16th recovery high. This level has limited upward price movement and triggered subsequent weakness. Based on this activity, 3451 possibly represents the upper boundary of Gold’s sideways trading range.
As also shown on the chart above, price weakness has followed the failure to break above the 3451 resistance level. However, buyers have also consistently re-emerged around 3246, which is equal to the May 29th and June 30th price lows, successfully holding declines and triggering a price recovery. This price action suggests 3246 currently marks the lower boundary of Gold’s sideways trading range.
It is impossible to predict when, or even if, a breakout from a sideways range will occur. In the case of Gold, confirmation of a breakout would require a close above the 3451 resistance level, or below the 3246 support. Until then, the range remains intact.
While it does not guarantee a sustained phase of price strength, a successful close above the 3451 resistance level may be viewed by traders as a positive signal for Gold, potentially opening the door for further price strength.
A successful close above the 3451 resistance level could signal a potential move toward 3500, the April 22nd all-time high. If this level is also breached, the next resistance may be 3648, which is equal to the 38.2% Fibonacci extension level.
To the downside, a closing break below the 3246 support, which marks lower limits of the current sideways range, would likely be needed to suggest a break lower from the range.
A successful close below the 3246 support level could lead traders to anticipate further downside risks. If confirmed, this could open the way for a test of 3120, which is equal to the May 15th low support, and potentially extend even further toward 2957, the April 7th low, should that level also be breached.
The material provided here has not been prepared accordance with legal requirements designed to promote the independence of investment research and as such is considered to be a marketing communication. Whilst it is not subject to any prohibition on dealing ahead of the dissemination of investment research, we will not seek to take any advantage before providing it to our clients.
Pepperstone doesn’t represent that the material provided here is accurate, current or complete, and therefore shouldn’t be relied upon as such. The information, whether from a third party or not, isn’t to be considered as a recommendation; or an offer to buy or sell; or the solicitation of an offer to buy or sell any security, financial product or instrument; or to participate in any particular trading strategy. It does not take into account readers’ financial situation or investment objectives. We advise any readers of this content to seek their own advice. Without the approval of Pepperstone, reproduction or redistribution of this information isn’t permitted.
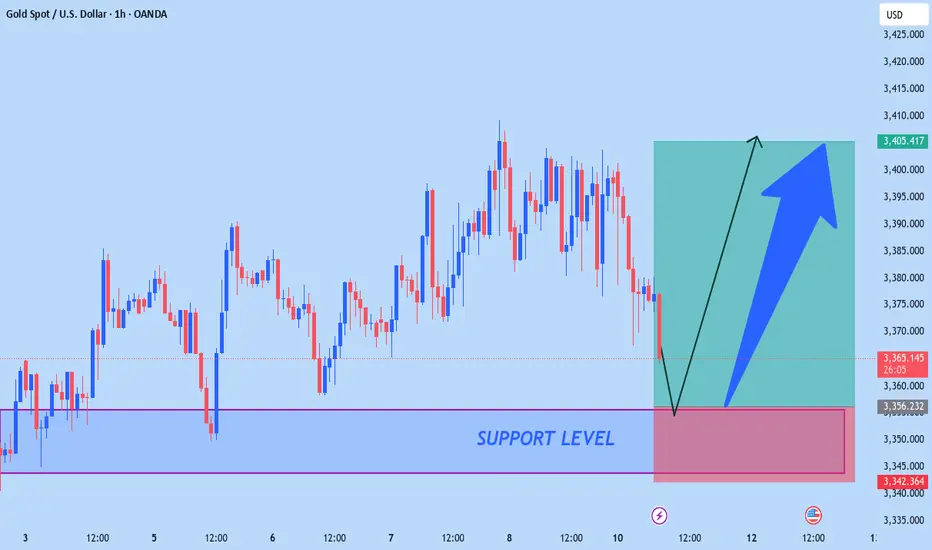
XAUUSD CAN FLY HIGHAccording to H1 analysis Gold market is in falling pressure from morning so wait for good opportunity market will be back from SUPPORT LEVEL if you want to go LONG position then go from SUPPORT LEVEL it is best for you use proper money management
TRADE AT YOUR OWN RISK
REGARD ALBERT
XAUUSDDon't take trades until the end of the summer.
Longterm 5K.
Short/Midterm its going to 3.500 but for the moment we locked inside of a consolidation.
The market it's waitting for news for start new moves.

Gold (XAU/USD) Technical Analysis – August 11, 2025📊 Gold (XAU/USD) Technical Analysis – August 11, 2025
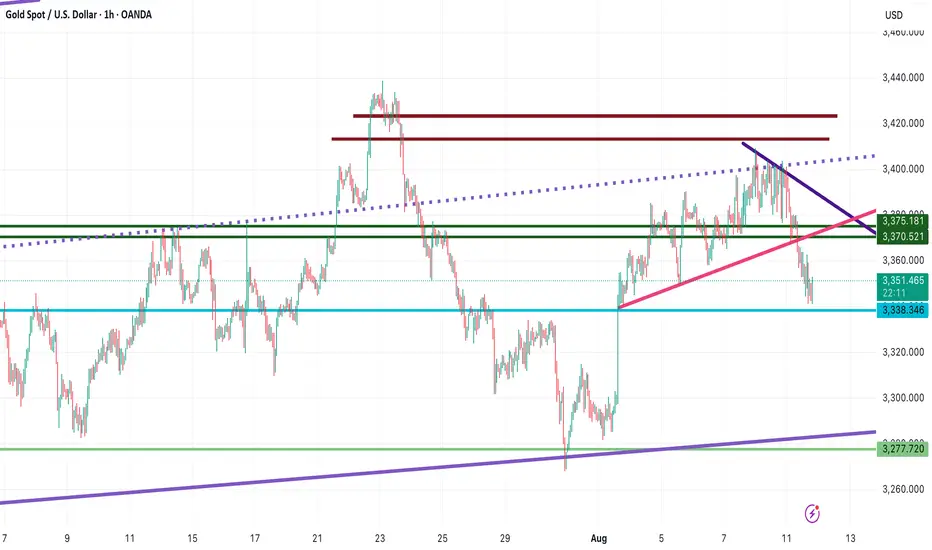
As anticipated in my previous analysis, gold dropped precisely from the midline of the channel and the descending trendline, showing a strong bearish rejection. Currently, the price is hovering near the $3,338 support.
🔹 Bullish Scenario:
If this support holds and we see strong bullish confirmation candles, gold could start a rebound. The first upside target is $3,359, followed by $3,370 and $3,375, which aligns with the broken ascending pink trendline, suggesting a potential pullback retest. If this level is broken, the next target will be the descending blue trendline.
🔹 Bearish Scenario:
If the $3,338 support breaks, the next key level to watch is $3,332, followed by $3,312 and finally the channel bottom support.
📌 Summary:
Gold is now at a critical decision point. Watch for confirmation signals at $3,338 to determine whether we get a bullish pullback or further downside movement.
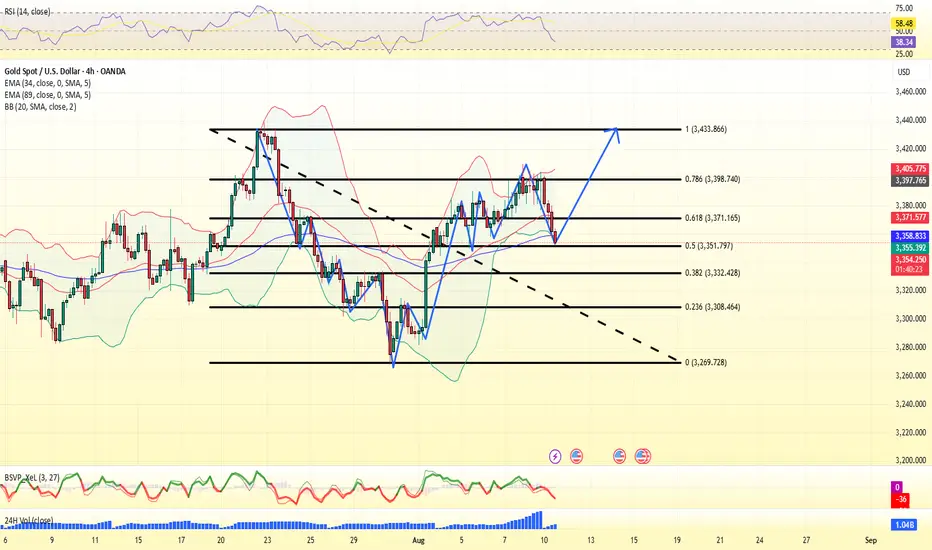
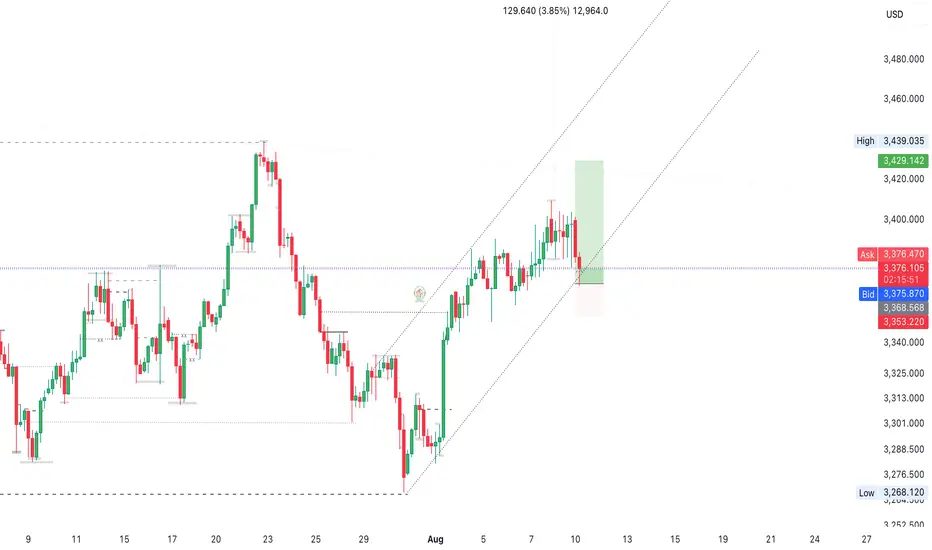
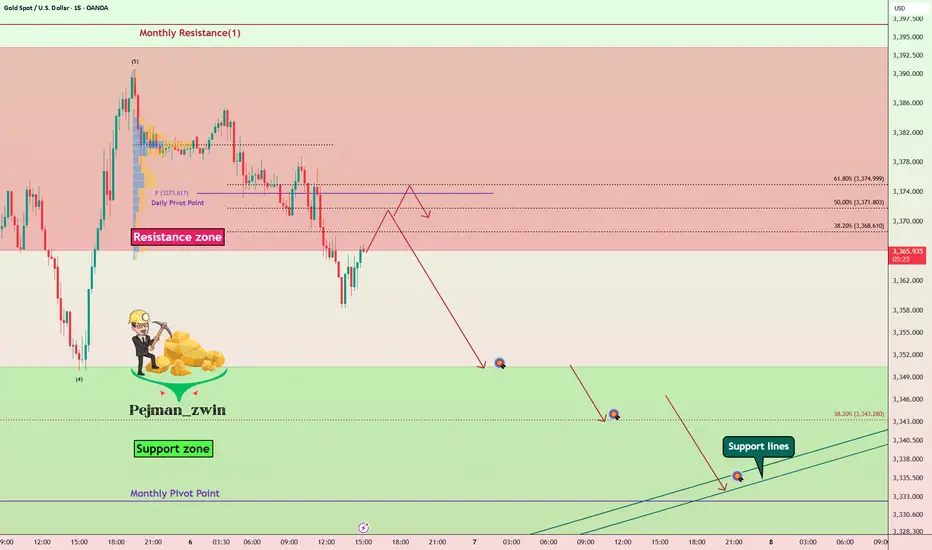
Gold Roadmap — Short termGold ( OANDA:XAUUSD ) rose to $3,383 as I expected in yesterday's idea .
Gold is currently moving in the Resistance zone($3,393-$3,366) .
In terms of Elliott Wave theory , it seems that Gold has completed 5 impulse waves , and we should wait for corrective waves on the 15-minute time frame .
I expect Gold to start declining from one of the Fibonacci levels and fall to at least $3,351 .
Second Target: $3,344
Third Target: Monthly Pivot Point/Support lines
Note: Stop Loss (SL) = $3,392
Gold Analyze (XAUUSD), 15-minute time frame.
Be sure to follow the updated ideas.
Do not forget to put a Stop loss for your positions (For every position you want to open).
Please follow your strategy; this is just my idea, and I will gladly see your ideas in this post.
Please do not forget the ✅ ' like ' ✅ button 🙏😊 & Share it with your friends; thanks, and Trade safe.
GOLD - short below , single support.#GOLD... stay in range even during CPI
so now we have single supporting area 3343-45
Keep close and only short below that otherwise not.
Good luck
Trade wisely
