XAUUSD: Market analysis and strategy for July 1.Gold technical analysis
Daily chart resistance 3400, support 3250
4-hour chart resistance 3374, support 3300
1-hour chart resistance 3355, support 3330
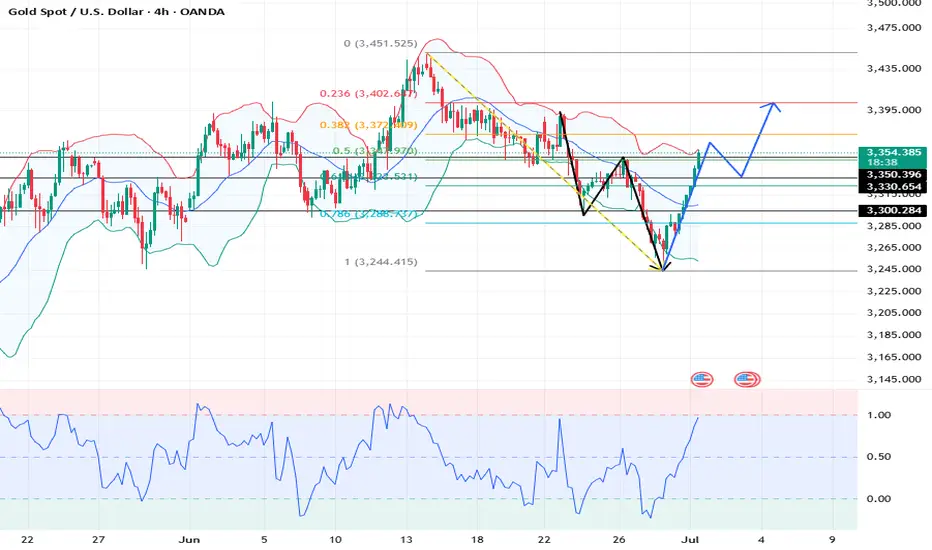
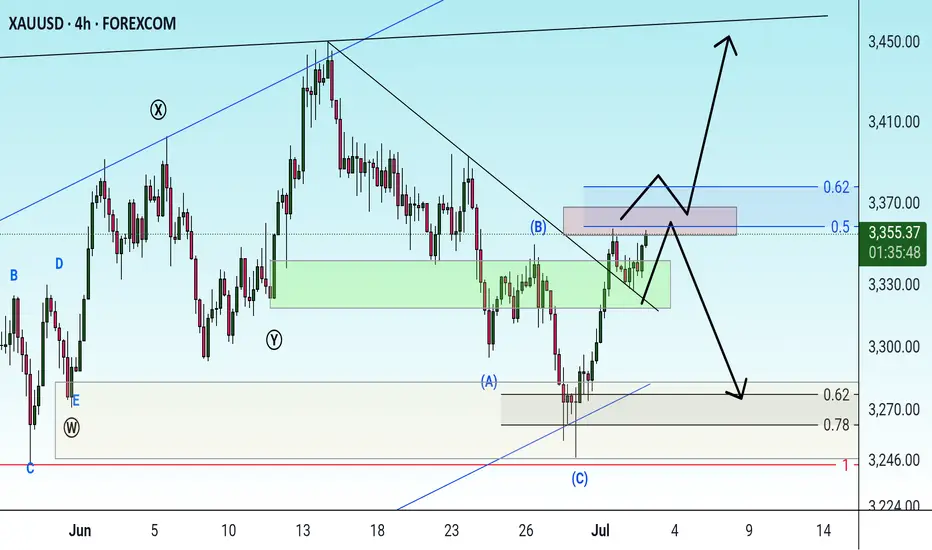
4-hour chart bearish, but 1H chart has reversed bullish. Technically, gold formed a double bottom support near 3247 and has entered the B wave rebound, but beware of the C wave decline that may start at any time.
Gold price accelerated upward after breaking through the key resistance of 3300. 3300 is the 0.50 position of the previous decline. Today's market rose slowly by 50 dollars without a callback. The bullish rally will continue at least until the second half of the NY market before a callback occurs.
The risky approach is to follow the trend and buy at the current price. The safe way is to wait for the callback to around 3325~3330 before buying.
BUY: 3350
BUY: 3330
XAUUSD trade ideas
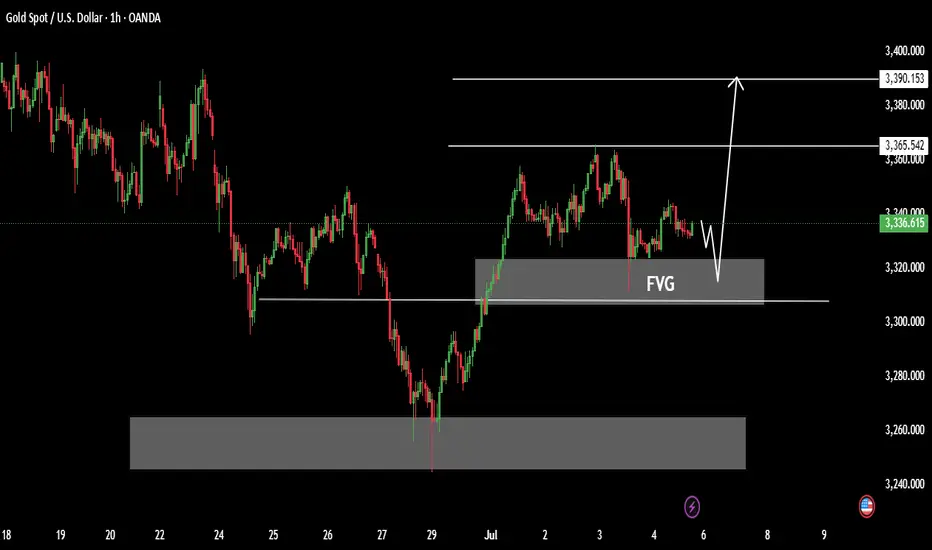
Gold (XAUUSD) short trade idea based on 1H chart 🪙 GOLD (XAUUSD) SHORT SETUP – Liquidity Grab Play 📉🔥
Here’s a potential short setup forming on Gold (1H timeframe):
🔹 Liquidity Sweep:
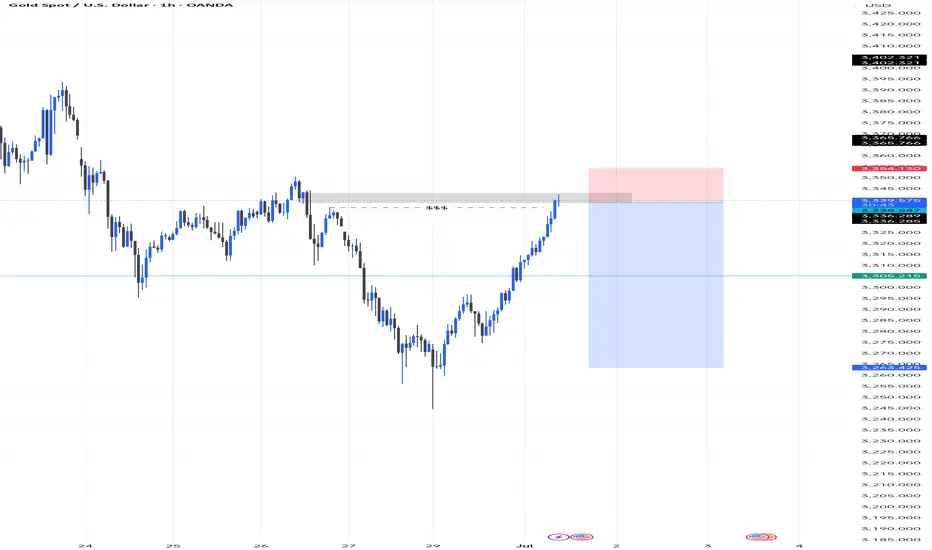
Price just tapped into a key supply zone after an aggressive bullish move, grabbing liquidity above recent highs (marked $$$). This is a classic setup for a potential reversal or retracement.
🔹 Premium Zone Entry:
The short position is taken right after price tapped the supply zone between 3340–3354, showing early signs of exhaustion.
🔹 Trade Setup:
Entry: Near 3341.30
SL: Just above supply at ~3354.13
TP: Down near the recent demand/imbalance at 3263.42
RRR: High reward potential with minimal risk.
🔹 Confluence Factors:
Price filled imbalance with strong momentum.
Reversal likely if no continuation above supply.
Key psychological levels and liquidity engineered below price.
📊 Execution Plan:
Watch lower timeframe confirmations (M15/M5 rejection or engulfing).
Manage stop based on how price behaves around 3350.
⚠️ As always, risk smart. Let the market confirm your bias before committing fully.
Note: wait for confirmation
Gold on relief rallyAs discussed throughout my yesterday's session commentary: Quick update: No Swing orders today, only aggressive Scalps similar to Scalp orders I mentioned above from my key re-Buy points. If #3,300.80 is recovered, newly formed Bullish structure will push for #3,313.80 and #3,327.80 test. If #3,300.80 benchmark is preserved, I will still keep Buying (Scalp only however). I will have Gold's major move revealed after today's session."
Technical analysis: I have been aware that another failed attempt to invalidate #3,272.80 - #3,278.80 local Support zone will most likely result into firm rejection and yet another push towards #3,302.80 psychological benchmark and ultimately the #3,327.80 level which represents Short-term Resistance line which is now invalidated to the upside (as discussed above already). Keep in mind that the current Bullish Short-term set-up can offer a great opportunity for those who missed the last rally to enter at almost (# +1.00%) of the Price so many Sellers which were liquidated will now engage multiple Buying orders so Buying pressure will be significantly Higher. Gold is extending the Trade nicely inside the healthy Hourly 4 chart's Ascending Channel and after failed Support zone reversal. Price-action has even more probabilities now to test #3,352.80 psychological benchmark. Gold is Fundamentally Bullish as well due Tariffs announcement.
My position: I have engaged #4 Scalp orders throughout yesterday's session (all in Profit) and will continue to do so however on the other side (Buying) from my key entry points. Keep in mind that overall trend remains Bullish and Trade accordingly.
XAUUSD Gold Weekly solid Bullish zone Gold weekly Forecast lets see how the price will plays out open and see and send your feedback about Gold.
After the breaking Price could catch there support after pull back top but last week on Friday due to the low volume price could not move Highly Gold stabilized after correction after the falling weekly from 3366 Gold price found demand again in Asia on Friday but US Budgets risk due to the holiday could increase,
Technically Price range in last week 3357 to 311 there is important level and Bullish zone,
Resistance zone 3365 / 3390
Support Levels 3325 /. 3311
it is important situation for you traders to use trade long-term hope you can find more details in the chart POs Support with like and comments for more analysis.
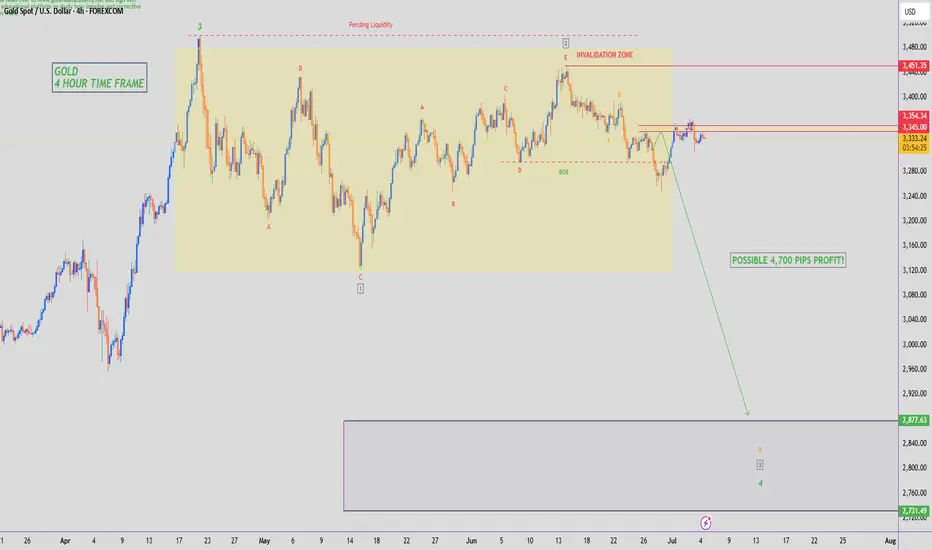
GOLD - SHORT TO $2,800 (UPDATE)Gold closing the week below our 'premium resistance zone', running roughly 170 PIPS in profit. Hope you all are in sells & running in profit like my Gold Fund investors as this was called live for you.
Don't forget we could also have a possible liquidity zone sitting just above $3,400 like I told you all earlier this week. Just something to be careful of & stay prepared in advance.
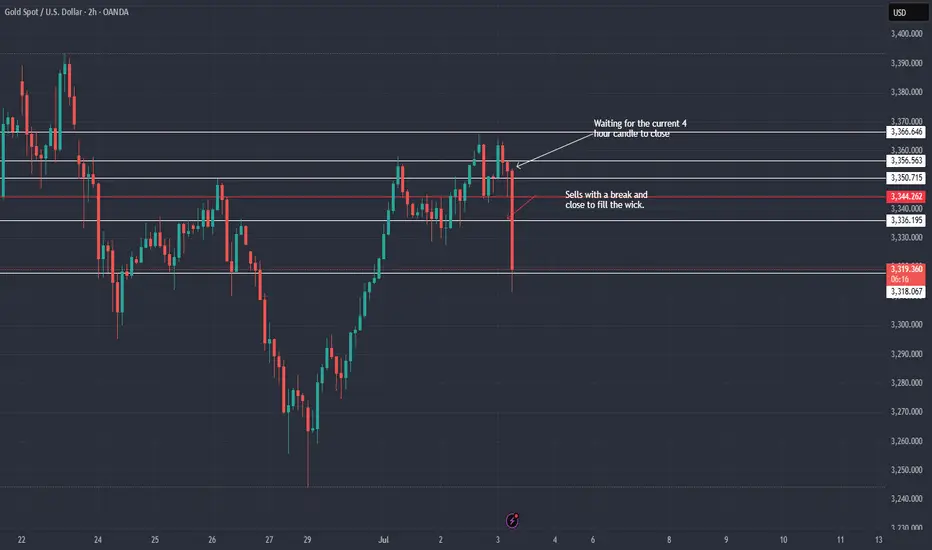
XAU / USD 2 Hour ChartHello traders. Although I didn't take the trade, you can see the analysis was spot on. A shout out to Big G. I am not trading today, but I will post another chart in a bit. We have the NY open in half an hour or so, let's see how that plays out. Most of the news was good for the US dollar. If you wonder where to watch the numbers to trade spot gold, I use forex factory calendar. Be well and trade the trend.
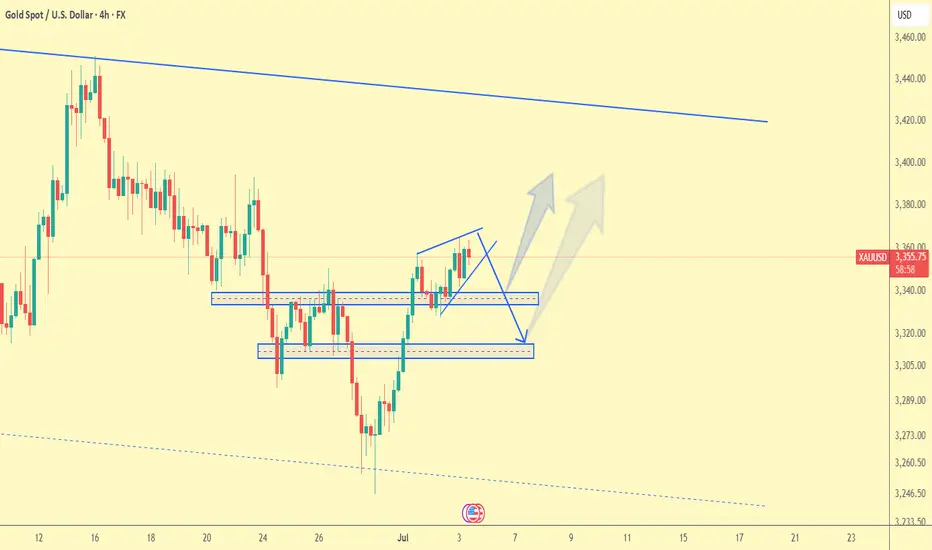
Gold Trade plan 03/07/2025Dear Trader,
On the 4H chart of XAU/USD, a rising wedge pattern is forming, which is typically a bearish reversal signal. After a significant upward movement, price is currently testing the 3360–3365 resistance area. If the lower boundary of the wedge breaks, the price is likely to drop toward the key support zones:
First support zone: 3330–3340
Second support zone: 3305–3315
If buyers defend these areas, a rebound to the upside may occur. But if the second support also breaks, deeper bearish pressure is likely.
Scenarios:
Bullish: If the price holds above 3365, it may rally toward 3380–3400 resistance.
Bearish: A breakdown from the wedge and loss of 3330 support could trigger a move down to 3310 or lower.
Regards,
Alireza!
XAUUSD 15M Outlook XAUUSD M15 Outlook 🚀⤴️
* Entry: ~3342 📊
* Take Profit: ~3350
* Take Profit: ~3357
* Stop Loss: ~3335
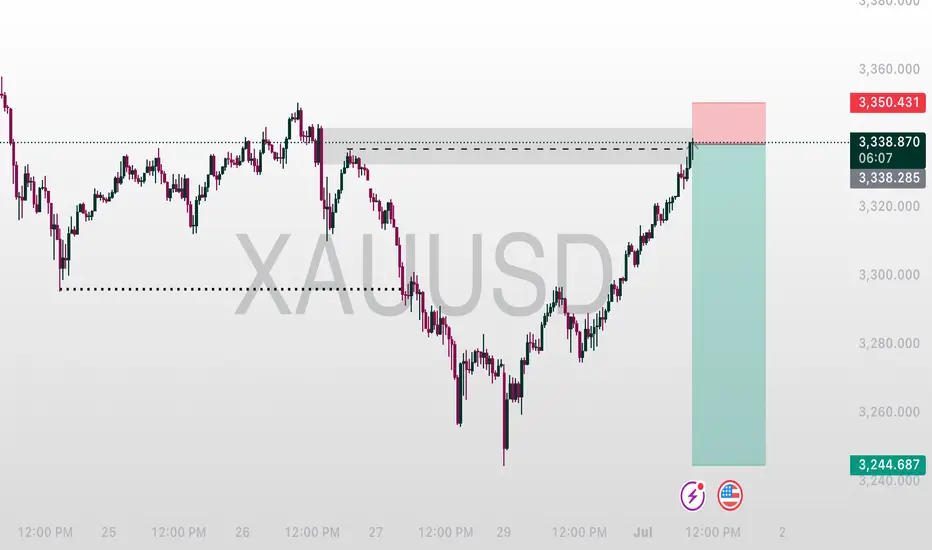
XAUUSD – Fresh Bearish Setup After TP HitWelcome to Velatrix Capital.
Last week’s short position on Gold has just hit Take Profit.
Based on current structure and momentum, we remain bearish-biased and have already entered a fresh short trade from a key resistance level.
This setup aligns with our internal system’s confluence logic and is now active.
🔍 Trade Parameters
• Timeframe: 1H
• Direction: Sell
• Entry: 3310.11
• Take Profit: 3266.76
• Stop Loss: 3324.51
• Risk/Reward: 1:3
Note: This is not financial advice. This is a real trade taken by our team based on a structured, repeatable trading model.
Use it as insight. Not as instruction.
🔔 Follow Us
We don’t chase hype.
We build edge.
Follow for raw setups, structured strategies, and institutional-grade breakdowns.
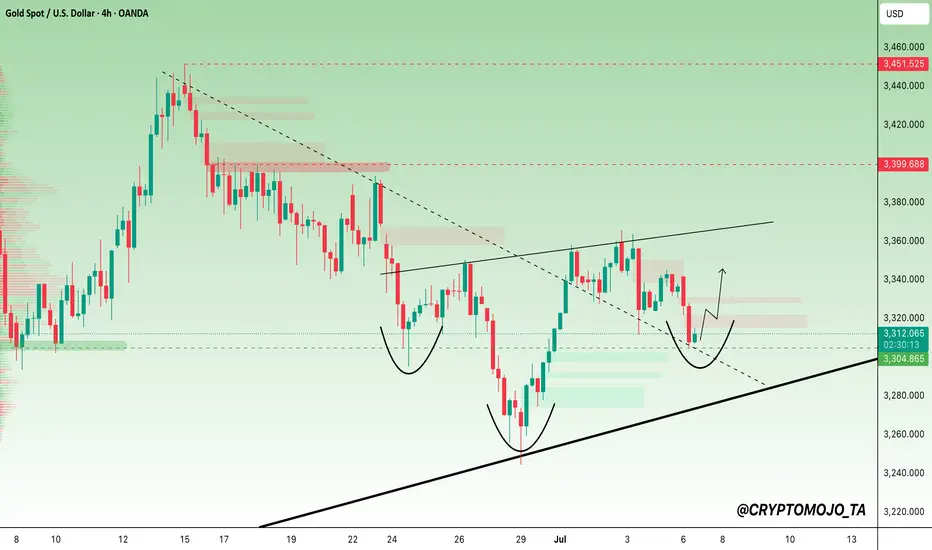
GOLD Eyes Breakout: Inverse Head & Shoulders in PlayGOLD is showing signs of a major bullish reversal!
The chart is clearly forming an inverse head and shoulders pattern, which often marks the end of a downtrend and the start of a new move up.
Buyers stepped in strong around the $3,305 zone multiple times, defending key lows and building a solid base. Now, the right shoulder is taking shape, and a break above $3,350–$3,357 could trigger the breakout.
📌 Key Resistance: $3,350 / $3,357 / $3,399
📌 Support: $3,304 (critical trendline)
If price flips $3,357 into support, bulls could target $3,399 and eventually $3,448 in the next leg.
The structure looks clean, with all eyes on the neckline breakout.
DYOR, NFA
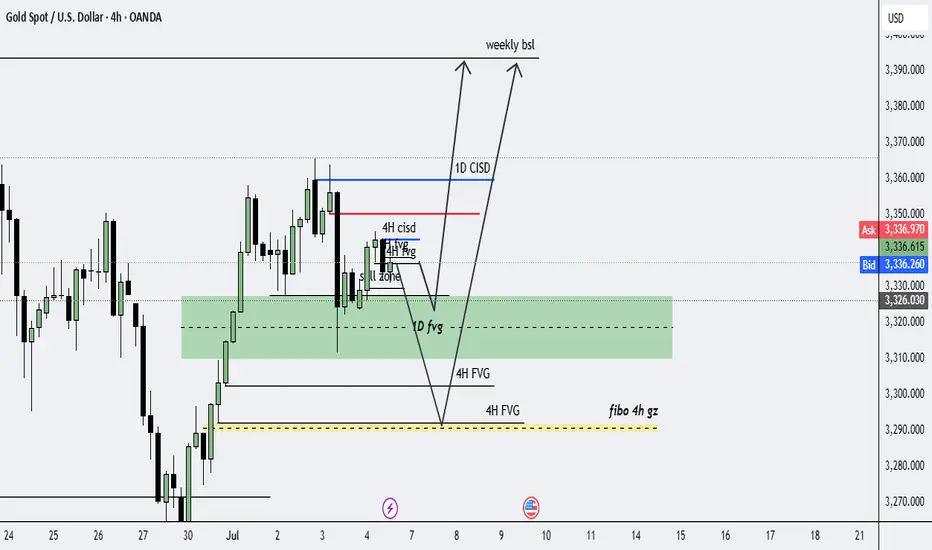
gold to 3393weekly ssl is taken so our weekly bias is bullish just wait for correction to 3290/3293 and wait for confirmation bullish setup to go long good luck
GOLD ON break and retest ,we have seen market reacting before my preferred sell zone.
trading is 100% probability
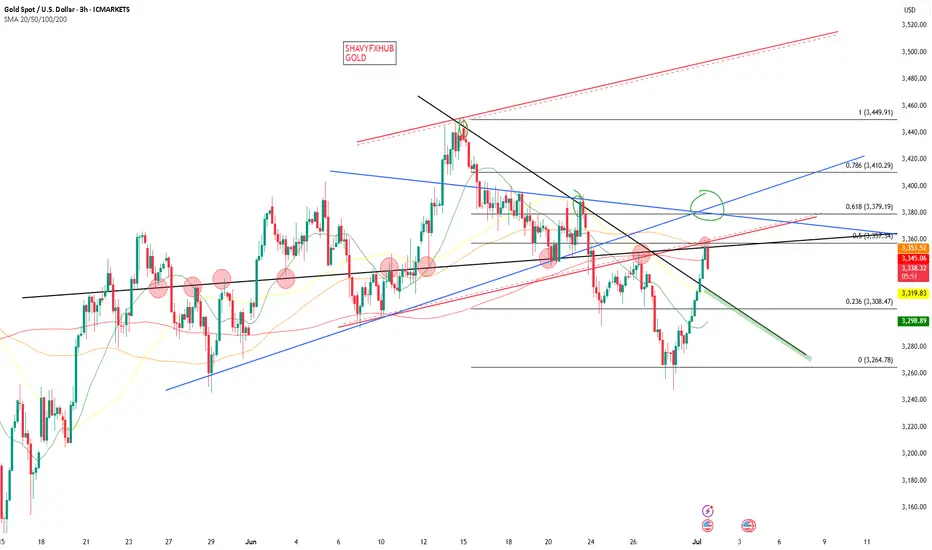
GOLD SELL IDEAPrice mitigated the 3244 liquidity and retraced into the 3344 OB. Using the RTO approach, we can take the sell from this premium back into the 3244 liquidity before looking for a buy from the 3215 zone targeting 3500.
Always use a confirmation entry and risk management.
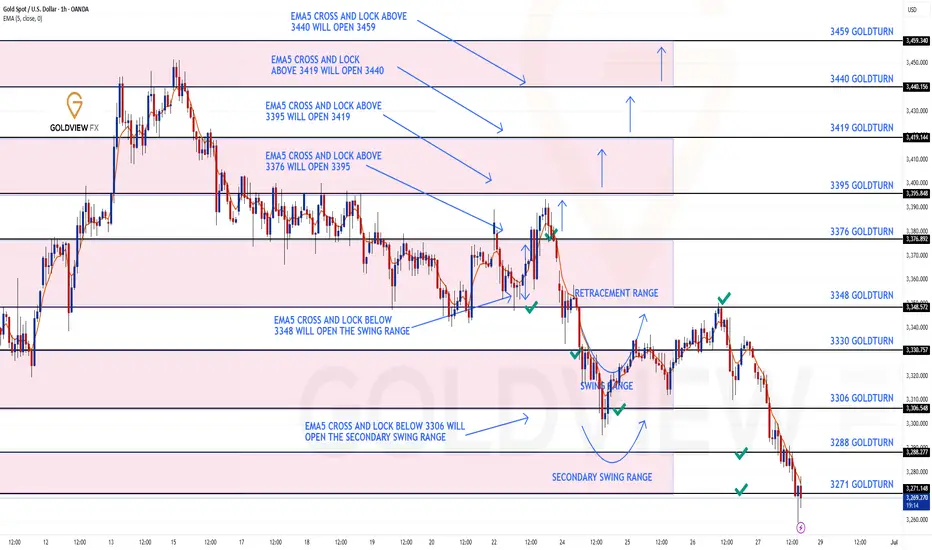
GOLD ROUTE MAP UPDATEHey Everyone,
A fantastic close to the week as our analysis once again played out level to level with precision!
As a follow-up from yesterday's post:
- The swing range completed the move into 3348, as expected.
- However, we had no further EMA5 lock above, confirming rejection back into the swing range.
- This was followed by an EMA5 cross and lock below 3306, opening the secondary swing range.
- That range played out perfectly today, hitting both 3288 and 3271 targets.
We’re now seeing a bounce off those levels giving the 20 to 40 pips, and we will now be observing to see if the full secondary swing is completed.
It's Friday, and it's been a PIPTASTIC week across the board. Well done to everyone following the plan and sticking to the levels.
QUICK RECAP
BULLISH TARGET
3376 - DONE
BEARISH TARGETS
3348 - DONE
EMA5 CROSS AND LOCK BELOW 3348 WILL OPEN THE SWING RANGE
3330 - DONE
3306 - DONE
EMA5 CROSS AND LOCK BELOW 3306 WILL OPEN THE SECONDARY SWING RANGE
3288 - DONE
3271 - DONE
We’ll be back now on Sunday with our multi-timeframe analysis and trading plans for the week ahead. Thanks again for all your likes, comments, and follows.
Wishing you all a fantastic weekend!!
Mr Gold
GoldViewFX
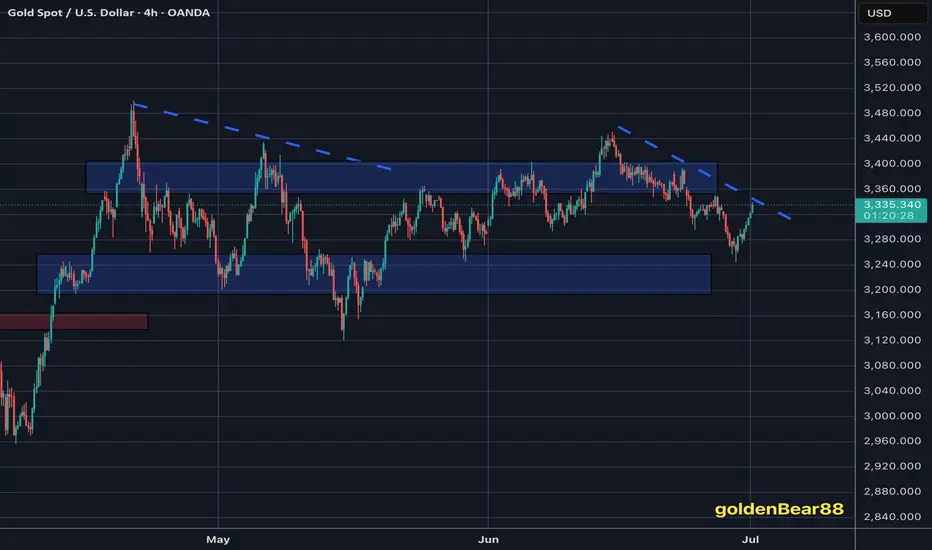
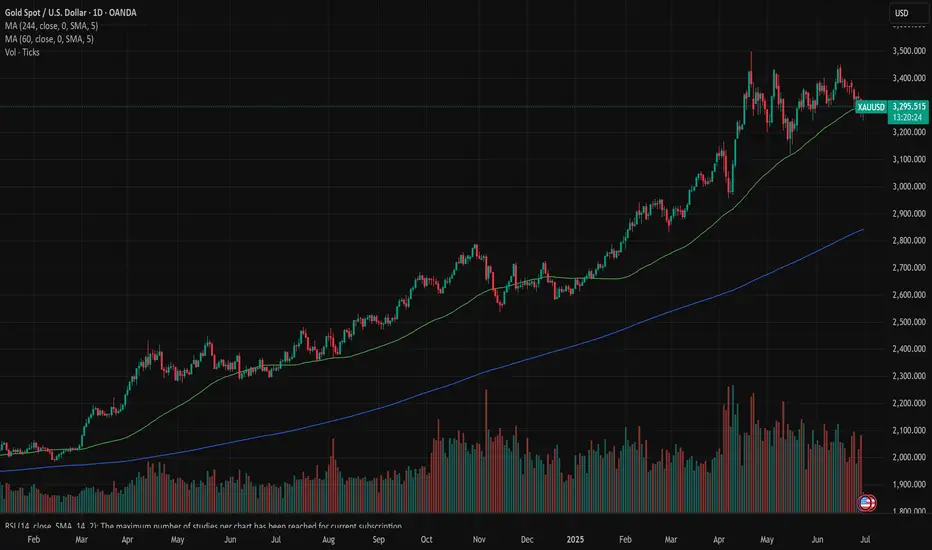
Gold: eased on tariffs dealAs geopolitical and economic tensions are slowly settling down, the price of gold eased its road toward the higher grounds. During the previous week, gold was traded with a bearish sentiment, dropping from the level of $3.395 down to $3.262. The main causes behind the drop in the price of gold are related to decreased tensions in the Middle East, as well as, settlement of the trade tariffs deal between the U.S. and China. Although the details of this deal was not disclosed publicly, still, the market reacted positively to the news. Investors moved funds from safe-haven assets toward the equity and the crypto market, as riskier ones in a quest for higher returns.
The RSI took the down path, ending the week at the level of 41. The indicator is currently clearly on the road toward the oversold market side. The price of gold breached the MA50 line during the previous week, which was acting like a support line for the price of gold during the previous period. The MA200 continued with an uptrend, following the MA 50 line. There is a high distance between two lines, so the potential cross is still not in the store for the price of gold.
Charts are pointing that the gold is on the easing road currently, with a potential for further correction in the coming period. The RSI is indicating that the oversold market side might be reached in the coming period, which means that the price could further ease. The bottom of the current correction might be $3.180, which was the highest level in mid April this year. Still, some short reversals are quite expected on this road, in which sense, Monday might start with a short attempt for higher grounds. In this sense, the $3,3K level might be tested.
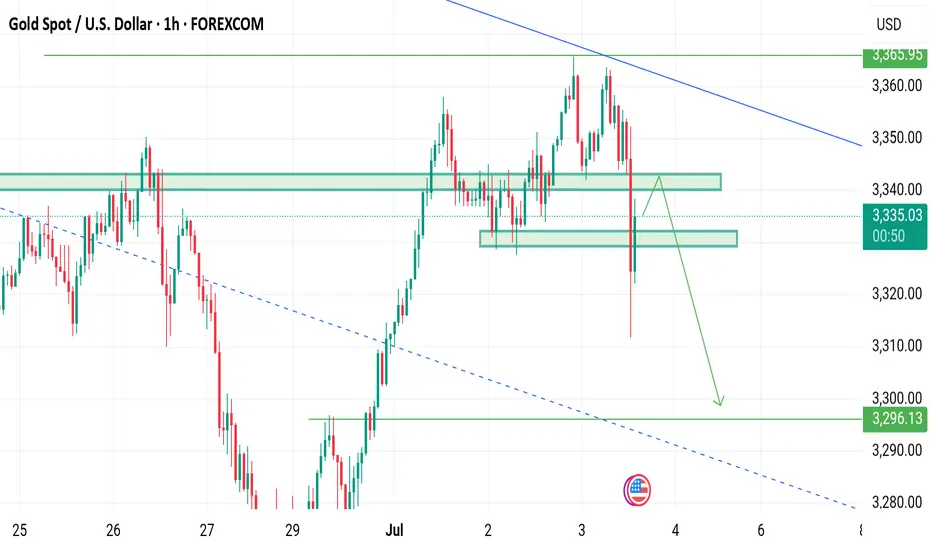
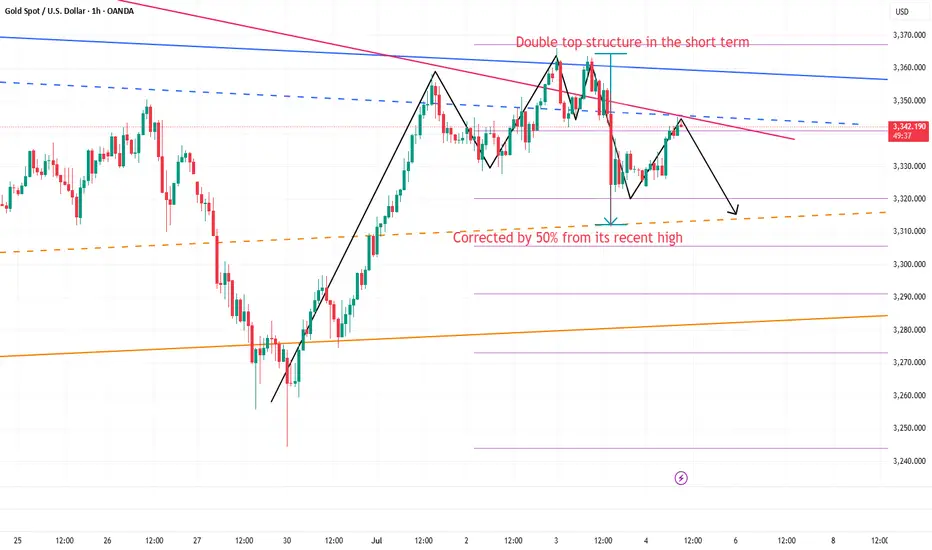
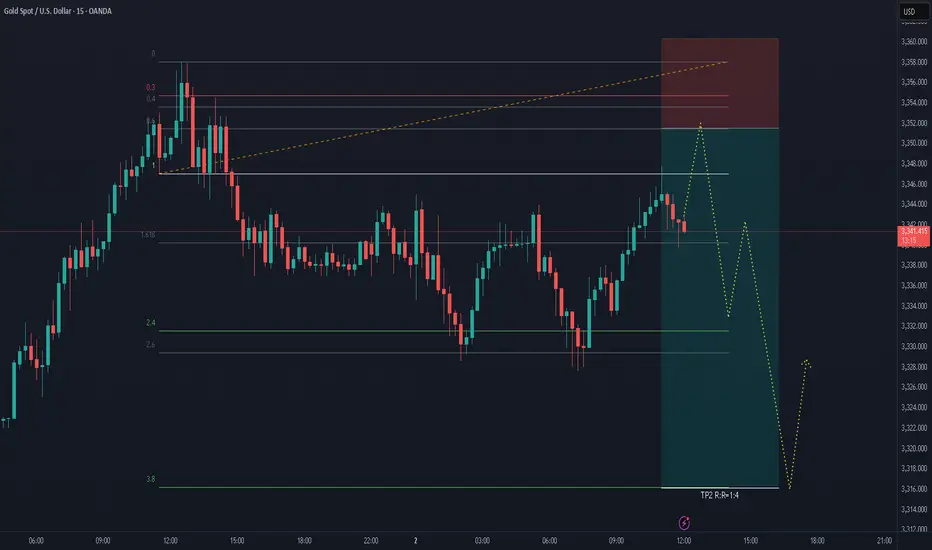
Still short gold before breaking 3355After the release of NFP yesterday, gold began to fall sharply from 3352, reaching a low of around 3312; although it has gradually rebounded above 3340, the time span is not short, so the rebound is not strong; and the double top structure successfully constructed by gold in the 3365-3360 area in the short term still plays a technical suppression role in the short term, greatly weakening the rebound potential; and with the decline of gold yesterday, I think before gold recovers the 3352 starting point, gold will also be under pressure in the 3345-3355 area in the short term. If gold cannot successfully break through this area during the rebound, gold is expected to retest the 3330-3320 area again.
Because of the US Independence Day, the gold market will be closed in advance today. It is expected that gold will not have a breakthrough today, so it may be difficult to break through the 3345-3355 area in the short term, so we can still continue to maintain the trading rhythm of shorting gold in terms of trading.
So I think shorting gold still has a lot of profit potential. We can short gold with 3345-3355 area as resistance and look to the target area: 3335-3325-3315.
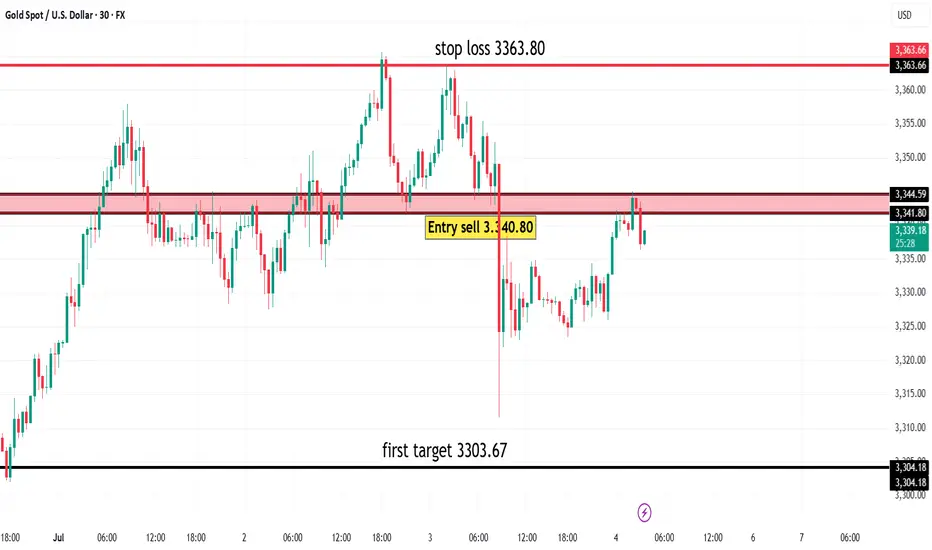
XAU/USDgold in frame 30 mins is good opportunity to sell from 3,340
with stop 3,352
target is 3303.67
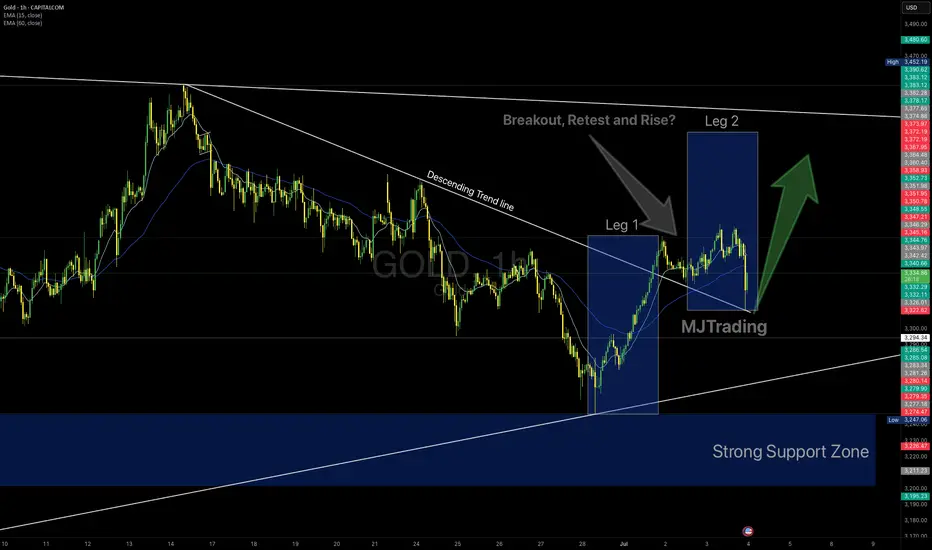
GOLD 1H – Breakout Retest or a Fragile Bullish Hope?👆🚀Boost it if you like it... (Thank you) 🚀👆
Gold has finally broken out above the descending trendline that has capped price for weeks. We’ve already seen Leg 1, an impulsive rally from the strong support zone, and a textbook retest of the broken trendline.
If bulls hold this level, a Leg 2 continuation could unfold.
Key Factors to Watch:
✅ Strong demand zone fueling the first leg up
✅ Clean breakout and retest of descending resistance
✅ Price still hovering around EMAs (15/60)
⚠️ However, the structure is fragile – lack of follow-through could trap late buyers
⚠️ If price loses the retest area decisively, sellers may reclaim control
Trading Insight:
This is a fascinating setup for bulls—but don’t fall in love with it. Stay adaptive. The market doesn’t owe us a second leg higher. Manage risk carefully and remember: probabilities, not certainties.
Trade Safely...
#MJTrading
#Gold #XAUUSD #TradingView #TechnicalAnalysis #BreakoutTrading #SupportResistance #PriceAction
GOLD BEFORE AND AFTERGOLD ,we shared 2 zone ,daily and 4hr buy floor ,the daily was giving us 3322-3318 and 4hr/3hr 3336-3344 and 4hr came and played into a perfect retest of a broken descending trendline and we are holding lower layer hoping that london market could take us to 3400 soon.
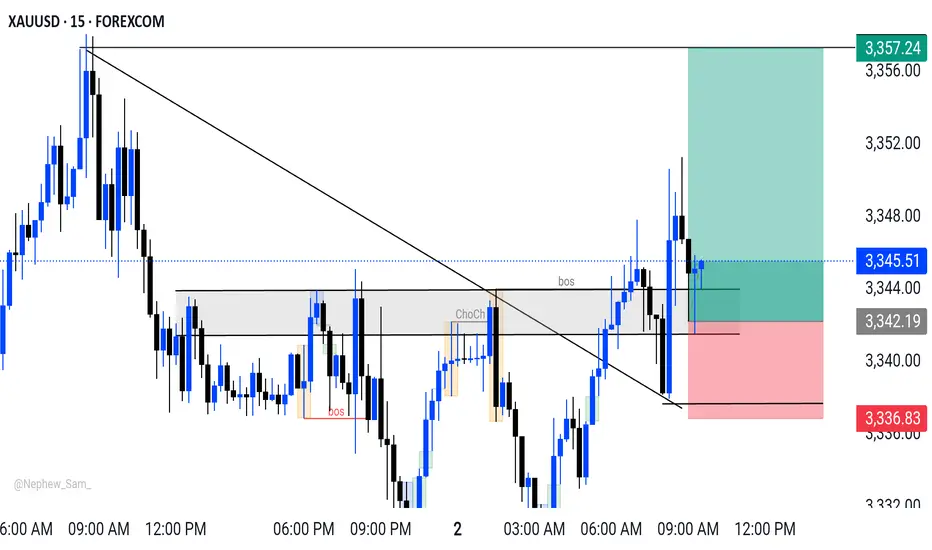
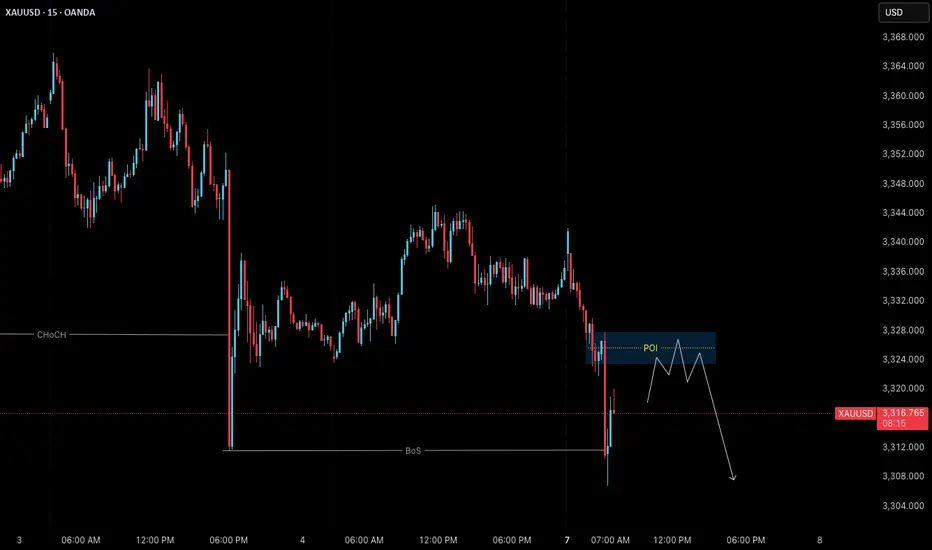
Gold (XAUUSD) – July 7 | Watching 3326 POI for Short Setup🟡 Gold (XAUUSD) – July 7 Bias | Short Setup Developing at 3326 POI
The Gold market remains in a pullback phase on the H4 timeframe , and price may still revisit the 3280 H4 order block before resuming its broader uptrend.
On the M15 timeframe, structure has now shifted clearly.
After an initial Change of Character (ChoCh) , we’ve seen a confirmed Break of Structure (BoS) , placing M15 officially in a downtrend .
✅ Why This Matters:
With both ChoCh and BoS complete, we no longer treat this move as a potential liquidity grab — it now reflects a valid structural reversal in the short term.
But instead of reacting impulsively, we study this shift as a live example of structure-based price action — and how entry zones form after confirmation.
🔍 M15 Order Block in Focus:
• 3323.500 – 3327.800 → Valid M15 POI for short setups
→ This is where we expect price might retrace before resuming its move
→ We’ll observe this zone for M1 confirmation (ChoCh + micro BoS) before taking any action
🎯 Target Zone:
• 3280 – H4 Demand
→ A clean structure-based target aligned with higher timeframe pullback
→ Our model requires minimum 1:3 RR , anchored to price structure
🔁 Key Takeaways:
• H4: Pullback phase remains intact
• M15: Downtrend confirmed (ChoCh + BoS complete)
• Execution plan: Observe 3326 POI; respond only if structure confirms again on M1
• No anticipation. No prediction. Just process.
📖 This is structure-based learning in real time.
We don’t chase setups — we observe shifts.
Let structure teach you. Let price confirm it.
The chart is the mirror.
📘 Shared by @ChartIsMirror
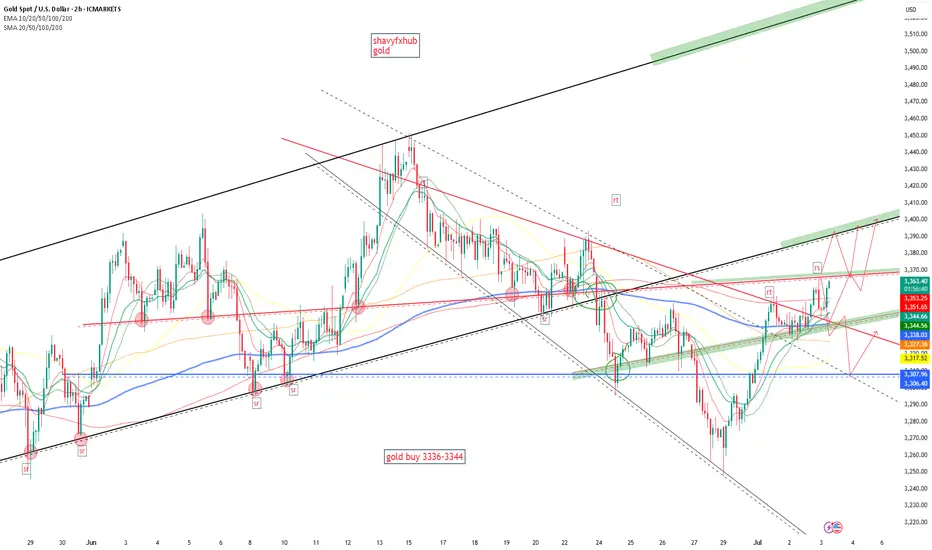
Check the trend Given the price behavior within the current resistance range, possible scenarios have been identified. It is expected that after some fluctuation within the current resistance range, a trend change will take place and we will witness the beginning of a downtrend. With consolidation above the resistance range, an uptrend will be likely.
Daily live trade with XAUUSD in 15m/30m/1h 20250702Daily live trade with XAUUSD in 15m/30m/1h 20250702
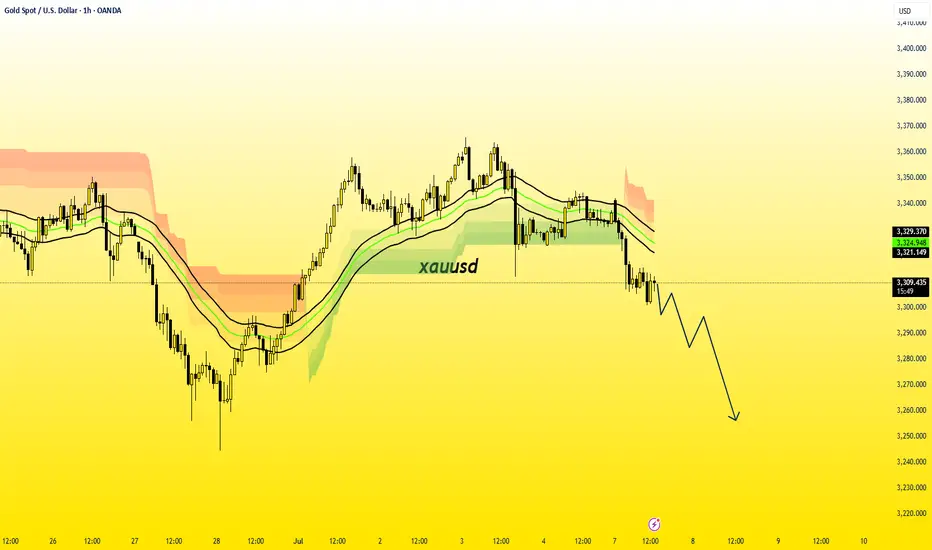
XAUUSD on Falling swingH4 Timeframe Analysis
Gold is currently holding falling pattern and Drop on Fundamentals .
ISM news is comming just after 5 mins.
What's possible scanarios we have?
im expecting that gold needs one more drop correction at atleast 3315-3305 area market will join the 3290 then 3280 milestone.
Exceptional case:
If the H4 candle remains above 3345 then keep your eyes at 3365 then 3380.
#XAUUSD