XAUUSD Showing Mild Recovery, What’s Next?Hello everyone, it's great to be back!
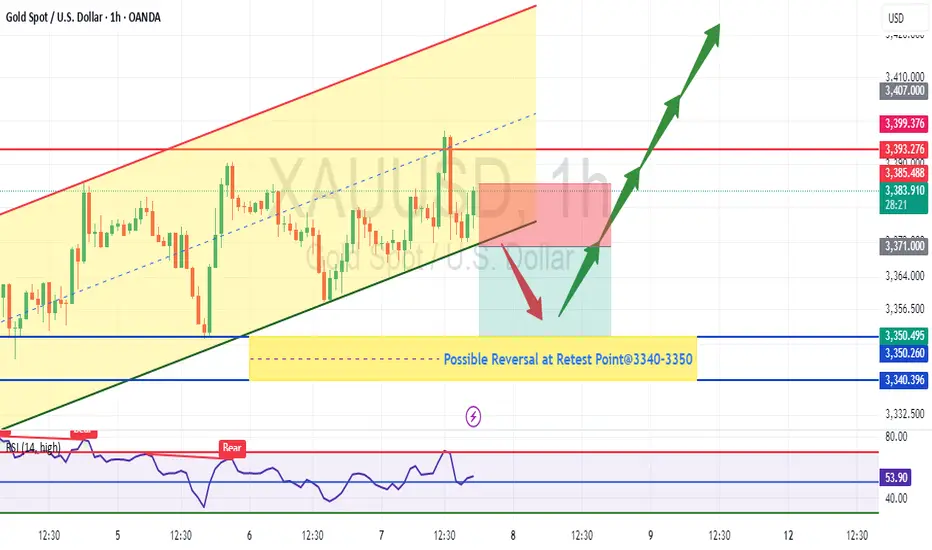
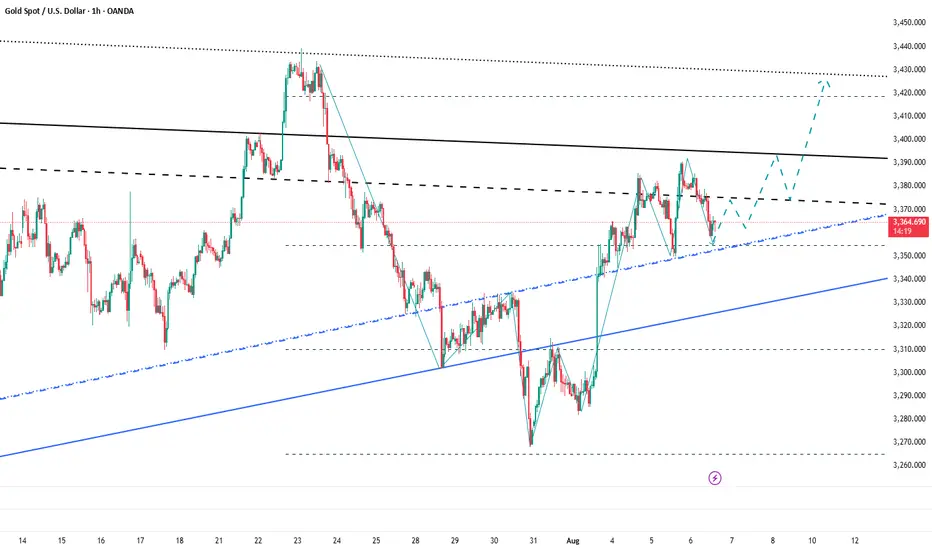
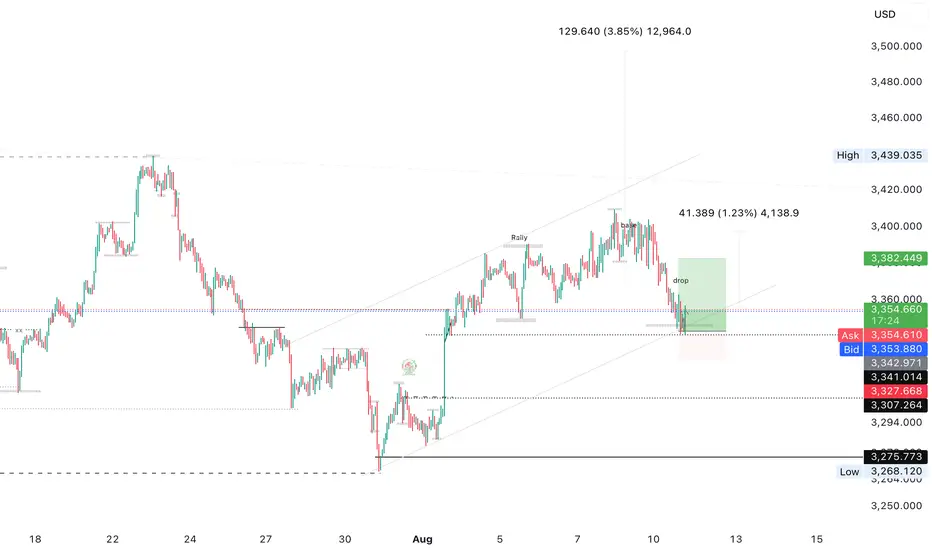
As of writing, OANDA:XAUUSD is experiencing a mild recovery from the lows, currently moving around the 3360 USD level. The precious metal has formed a new support zone and is bouncing after touching the trendline. If this level is well-utilized, the target could extend to test 3380 USD (intermediate resistance) and potentially the psychological level of 3400 USD.
Looking at the outlook: Today, key economic indicators, including Core PPI (Core Producer Price Index), PPI (Producer Price Index), and Unemployment Claims will be released. Forecasts suggest that Core PPI and PPI will increase by 0.2%, while Unemployment Claims are expected to drop to 225K.
If PPI is high, this could lead the Fed to maintain high interest rates, putting downward pressure on gold. However, if Unemployment Claims rise, gold could benefit from its safe-haven role and continue to rise (two opposing factors). Therefore, it’s important to monitor these developments for a clearer direction on gold.
Based on this information, I’m leaning towards a recovery in gold, but what do you think?
XAUUSD trade ideas
GOLD (XAU/USD) Weekly Open Analysis – H2 Structure# 🟡 GOLD (XAU/USD) Weekly Open Analysis – H2 Structure
**Date:** 2025/08/11
**Timeframe:** 2H (Heikin Ashi)
**Style:** Smart Money Concept (SMC) + Supply/Demand + Price Action
---
## 📊 Market Context
At the weekly open, gold price has started trading above the **upper parallel channel** where last week's close was printed. This level acts as a short-term **bullish bias zone**.
Simultaneously, the **Dollar Index (DXY)** opened at lower levels, showing signs of weakness. Historically, a falling DXY often supports upward movement in gold, and we may see a reaction as mapped in the chart.
---
## 🔍 Key Technical Levels
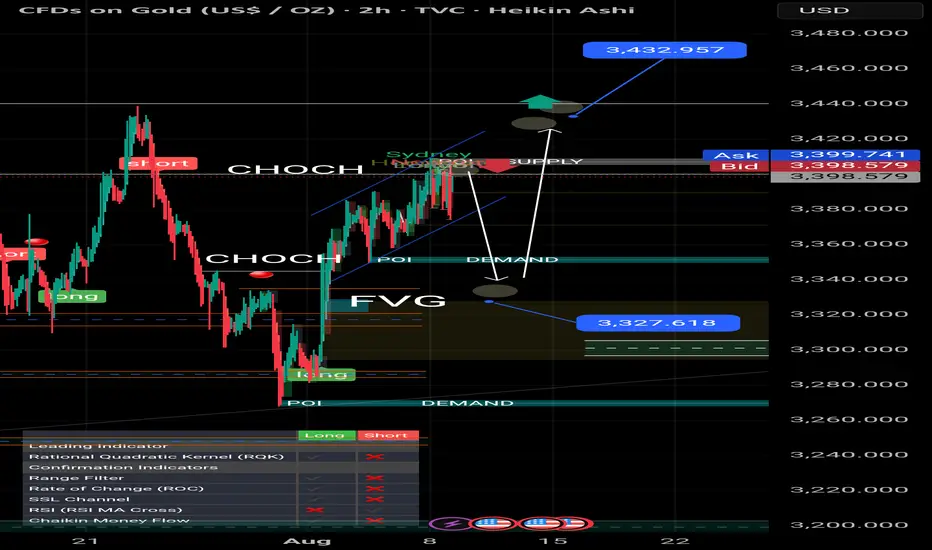
- **Upper CHOCH Breakout Zone:** ~**3,399 – 3,400**
- **Major Supply Zone:** ~**3,440 – 3,445**
- **Demand Zone #1:** **3,345 – 3,350** (POI)
- **Demand Zone #2:** **3,320 – 3,330** (FVG completion)
- **Final Demand Floor:** **3,260 – 3,265**
---
## 📈 Bullish Scenario (Primary)
1. **Condition:** CHOCH breakout above **3,400** with a bullish BOS confirmation.
2. **Entry Zone:** Retest near **3,399 – 3,402** after breakout.
3. **Targets:**
- 🎯 TP1: **3,420**
- 🎯 TP2: **3,432**
- 🎯 TP3: **3,445** (Major Supply)
4. **Invalidation:** Close back below **3,395** after breakout attempt.
---
## 📉 Bearish Scenario (Alternative)
1. **Condition:** Price fails to break the upper CHOCH and rejects from **3,399 – 3,400**.
2. **Expected Move:** Drop towards **Demand Zone #1** (**3,345 – 3,350**).
3. **If Demand #1 Fails:** Continuation towards **Demand Zone #2** (**3,320 – 3,330**).
4. **Final Target in Deep Drop:** **3,260 – 3,265** (lowest demand line in chart).
---
## ⚠️ Analysis Validity
> This analysis remains valid **as long as the upper CHOCH is not broken to the upside**.
> If the CHOCH breaks and a bullish BOS forms, the bearish path will be invalidated, shifting the focus to the upside targets.
---
📌 **Note:** Always combine with DXY monitoring – a significant DXY rally could limit gold’s bullish potential.
#XAUUSD #GoldAnalysis #SMC #SupplyDemand #CHOCH #BOS #TradingView
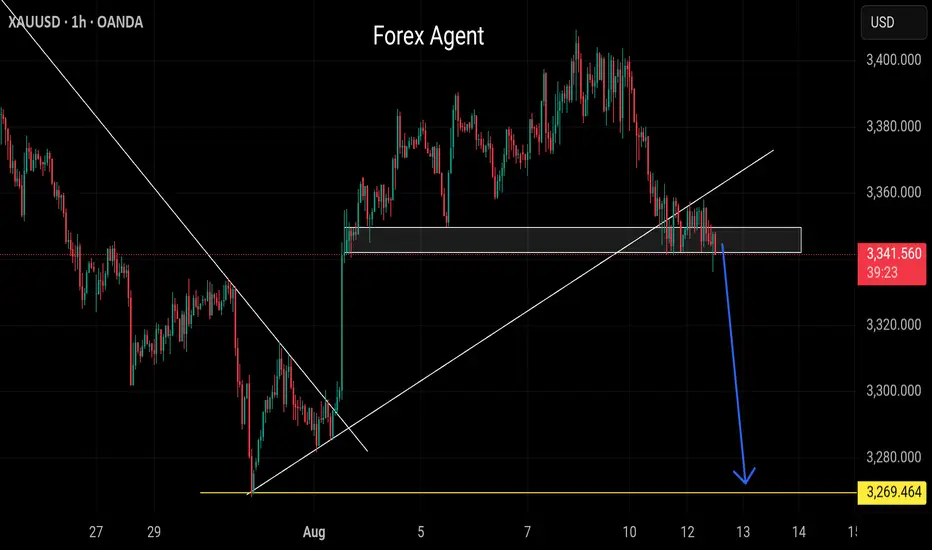
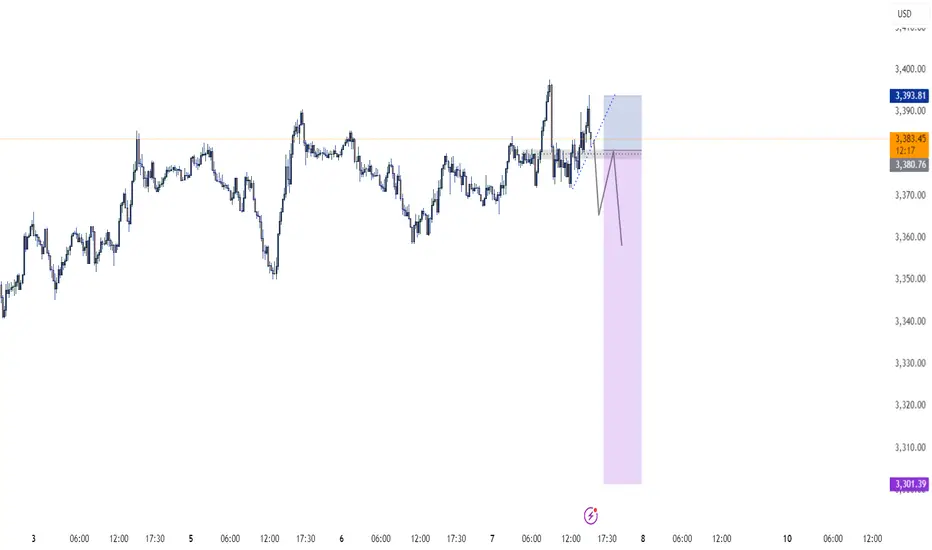
Smart Money Concept (SMC)📉 Bearish Analysis XAU/USD – SMC
🔹 1. Previous Market Structure
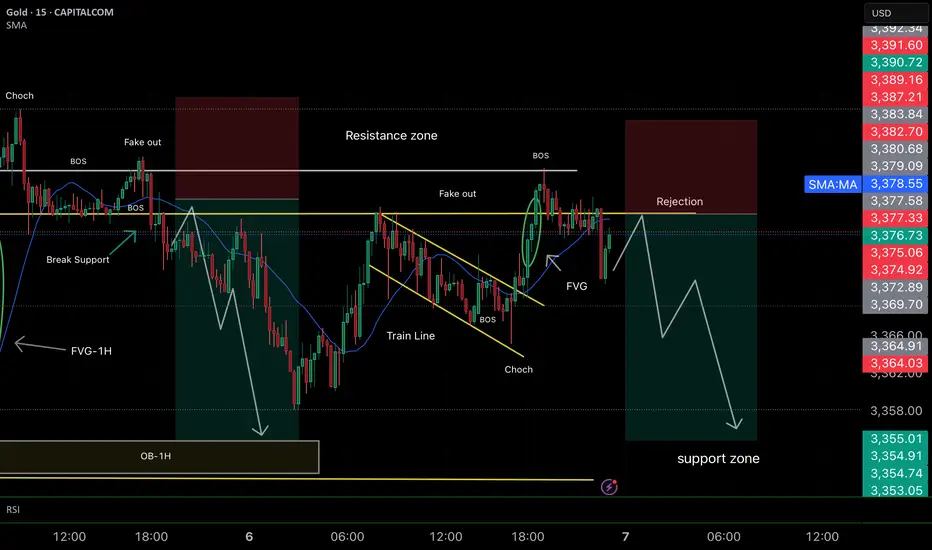
• Price was respecting a train line (trendline) which was broken aggressively, confirming a Break of Structure (BOS).
• After that, the market created a fake out above the resistance zone, grabbing liquidity from early buyers.
🔹 2. Signs of Weakness
• A clear rejection at the resistance zone, showing that buyers lost control.
• The train line break also signals a Change of Character (ChoCh), suggesting the beginning of a bearish swing.
🔹 3. Prior Mitigation Completed
• Price already mitigated key zones, including the 1H Order Block (OB-1H) and previous 1H Fair Value Gap (FVG).
• A new bullish FVG was formed but seems to have been rejected, adding to the bearish pressure.
🔹 4. Trade Plan
• Entry: Rejection after the fake out within the red supply zone
• Target: Support zone between 3,355 – 3,352, where liquidity is likely resting
• Stop Loss: Above resistance and the last BOS to avoid being caught by manipulation
💡 Summary for your caption:
“Price broke the trendline and showed clear weakness at resistance, leaving behind unmitigated interest at lower levels. The FVG rejection suggests institutional intent. High-probability short setup targeting the support zone.” GOOD LUCK TRADERS.. ;)
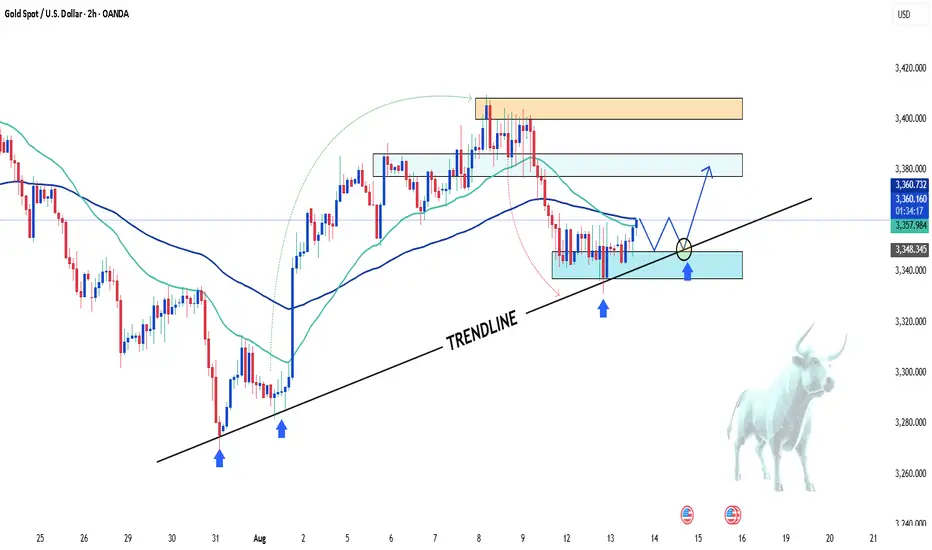
Gold Bulls Unshaken, 3400 in FocusGold prices retreated from a high of 3385 today, currently hitting a low near 3358. How far will gold fall? Are the bears back in control? I'm not worried about a gold pullback, but rather a lack of one, because only a pullback can provide a good entry opportunity. Clearly, I remain bullish on gold and optimistic about it reaching the 3400 mark.
Because gold fell all the way to around 3358, some voices in the market began to tout the strong return of the bears, but I remained unmoved. When many people were once in self-doubt, I was quietly taking advantage of the gold pullback to accumulate funds in batches and pick up bargains. We can clearly see that gold did not destroy the bullish structure during the decline, and as gold rebounded, the 3360-3350 area has become a dense trading area, indicating strong buying support. After the technical top and bottom conversion, it has become a relatively solid support area. It may be difficult for gold to fall below this support area in the short term.
So, why has gold repeatedly encountered resistance and retreated? I believe that gold has encountered resistance and retreated in the 3385-3390 area many times in order to repeatedly test the effectiveness of support and consolidate the strength of support. It is also to increase liquidity during the retreat period, thereby accumulating more upward momentum so that gold can rise further and break through the 3400 mark.
So I still hold a long position in gold, and I have not lost confidence in the gold bulls. On the contrary, I still expect that gold will be able to hit 3400 in one fell swoop after repeatedly testing the support, or even continue to rise to the 3420-3430 area.
Sell gold We are expecting more sell in CPI
Trend already breaks and support level gonna weak
It's tha just my view not exact analysis
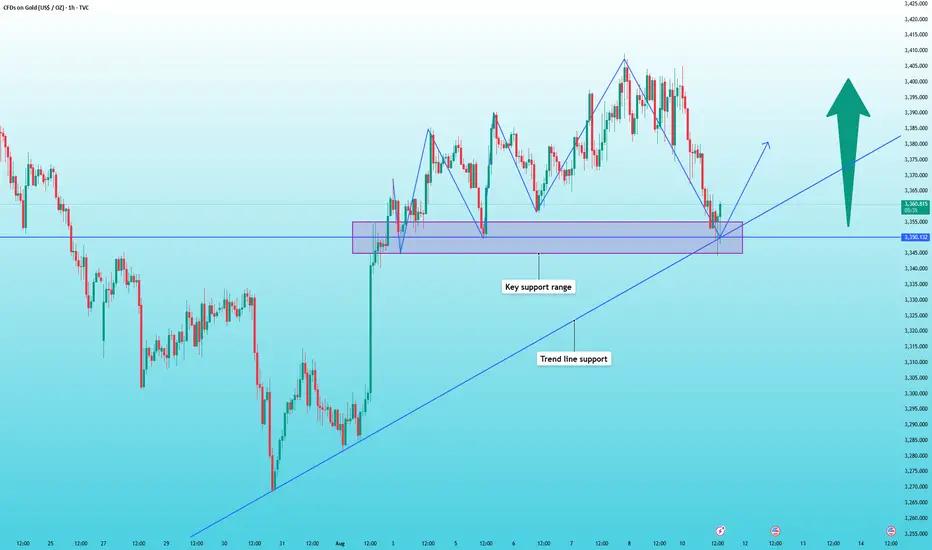
Gold support has been confirmed, buy with confidenceThe most anticipated outcome for the gold market this week is tomorrow's CPI data. After today's pullback during the Asian and European trading sessions, the current price has reached support levels. Before the CPI release, I believe volatility will be minimal, with a high probability of limited fluctuations.
The chart shows that 3350 is a key support level. After several hours of testing, 3350 has stabilized, so we can buy at this level, with the initial target being 3360, followed by 3380.
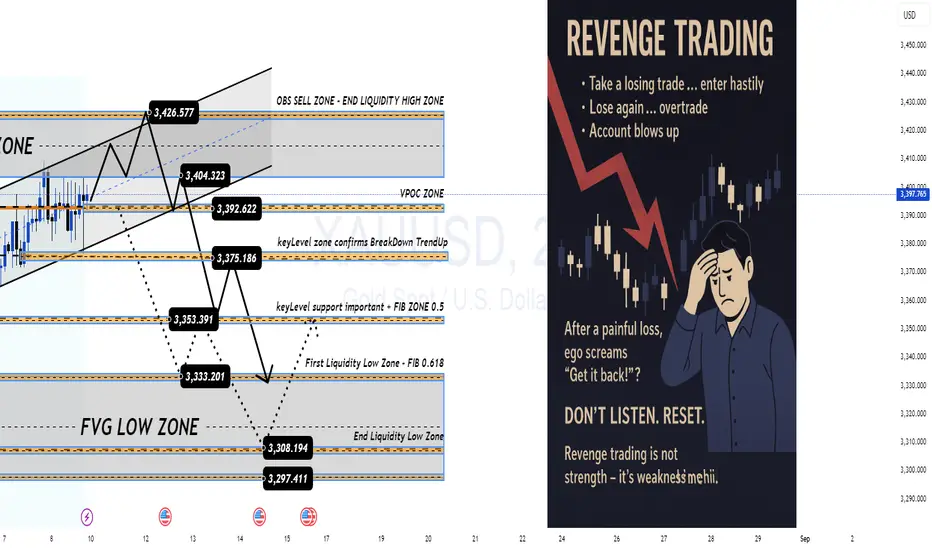
When Ego Takes Over, Your Account Pays the Price Revenge Trading – When Ego Takes Over, Your Account Pays the Price 💔
Traders, be honest…
How many times have you taken a painful SL, and before you could even breathe, your finger was already clicking “Buy/Sell” without a second thought?
In your head: “I’ll get it back right now… the market can’t do this to me!”
And then…
🔻 A candle goes straight against your position.
🔻 SL beeps again.
🔻 Your account balance drops faster than your mood.
That’s Revenge Trading – it sounds fierce, but in reality, it’s just an emotional storm pulling you further away from shore.
1️⃣ The Sweet but Deadly Psychological Trap
After a loss, your brain refuses to accept reality. It pushes you into the “must recover immediately” mode.
You throw discipline out the window – no setup, no plan.
You increase your lot size recklessly – “Just one win and I’ll be back.”
And… the market doesn’t care if you’re mad or not.
The danger is, at that moment, you’re no longer trading with logic — you’re trading with a wounded ego.
2️⃣ The Downward Spiral
Lose one trade → frustration.
Jump into a revenge trade → bigger lot size.
Lose again → account drains faster.
Emotions spiral out of control → random clicking.
Account blown.
It’s like standing at the edge of a cliff — you could step back and be safe… but you jump, thinking there’s a cushion down there.
3️⃣ How to Cut the Revenge Trading Cycle Before It Eats You Alive
Step away from the charts immediately after a losing streak — go for a walk, exercise, do something unrelated to trading.
Set a daily/weekly loss limit (e.g., -2R) and stick to it.
Journal your emotions after each trade to spot when revenge impulses start creeping in.
Trade smaller when you return — the goal now is to recover your mindset, not your money.
Remind yourself: “The market will always be here. My capital and mental state won’t wait for me.”
4️⃣ MMF’s Note to You
Revenge trading is not strength — it’s weakness in disguise.
It doesn’t help you beat the market; it just helps the market beat you faster.
Keeping a cool head is what keeps a trader alive in the long run.
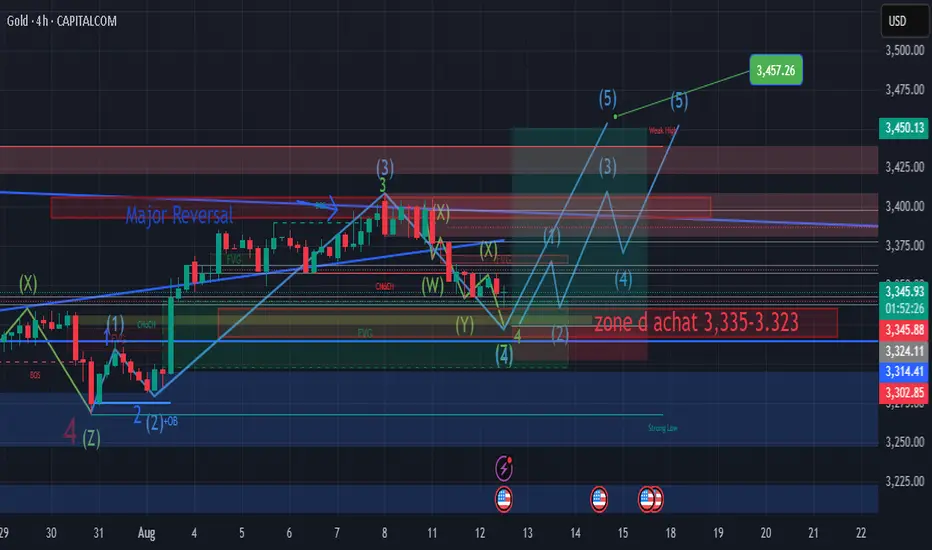
GOLD ANALYSIS - BUY STRATEGY We are waiting for the price to fully fill the FVG (Fair Value Gap) around 3,330–3,320 USD before taking another buy position.
The goal is to capture a strong bullish move toward 3,457.26 USD after this return to the liquidity zone.
Bullish structure remains intact; entry is delayed to maximize the risk/reward ratio and avoid buying too high.
BUY ZONE / 3,335-3.323
🎯 Main TP: 3,457.26
🛡️ SL: 3,314.41
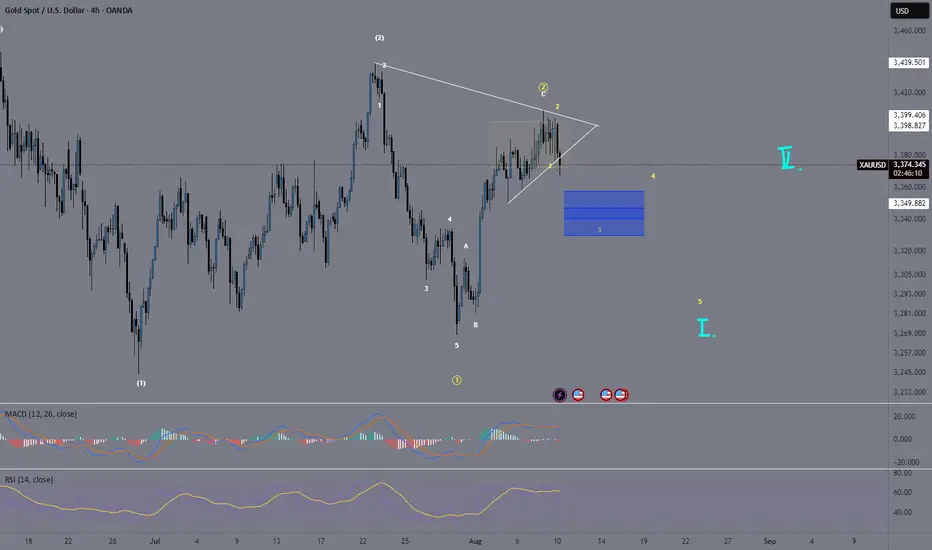
XAU/USD – Bearish Momentum Building: Circle 2 Top In?OANDA:XAUUSD
We have now completed a 1-2-3-4-5 move to the downside (in white), followed by a counter-correction in the form of an A-B-C.
This may have already completed our yellow (Circle) Wave 2 🟡 — though it’s not confirmed just yet.
We still have two potential resistance levels at 3400 and 3418 that could serve as final topping points for Circle 2.
Today, we can also observe a break of structure with the white trendline being broken, adding further confirmation to the bearish outlook 🔻.
I am now tracking my 1-2-3-4-5 structure in yellow, which should unfold into Circle Wave 3 🟡.
Bias remains bearish, and I expect this move to develop in line with the yellow projection already shown on my chart.
If price breaks decisively above our Fibonacci resistance, the alternative scenario would be an ABCDE triangle formation that has potentially been forming over the past months — in that case, I’ll post a dedicated update 📌.
For now, I’m actively looking for sell setups and have already entered short positions ✅.
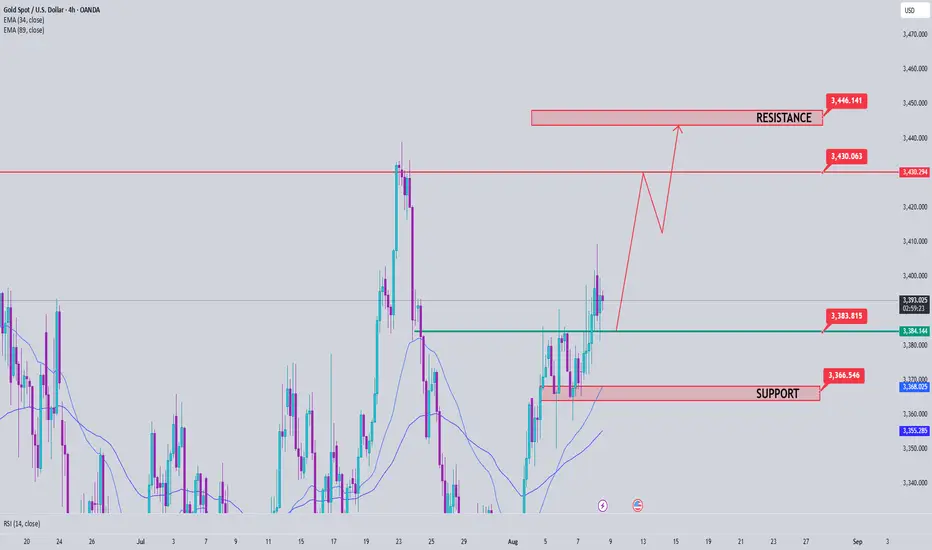
Gold Trading Strategy August 8XAUUSD – Bullish Breakout from Triangle Pattern
Gold has officially broken the upper boundary of the triangle accumulation pattern, confirming the continuation of the uptrend. This bullish momentum is heading directly towards the 3430 area, and if the buying pressure is maintained, the 3445 level is completely within reach.
Today is Friday, the closing day of the weekly candle, so the oscillation amplitude is usually stronger and the price can easily approach new peaks. Observation shows that the buying pressure in the US session has been maintained continuously in recent days - this supports the strategy of BUYing now and holding until the US market opens.
Support zone: 3385 – 3365 – 3333
Resistance zone: 3419 – 3431 – 3445
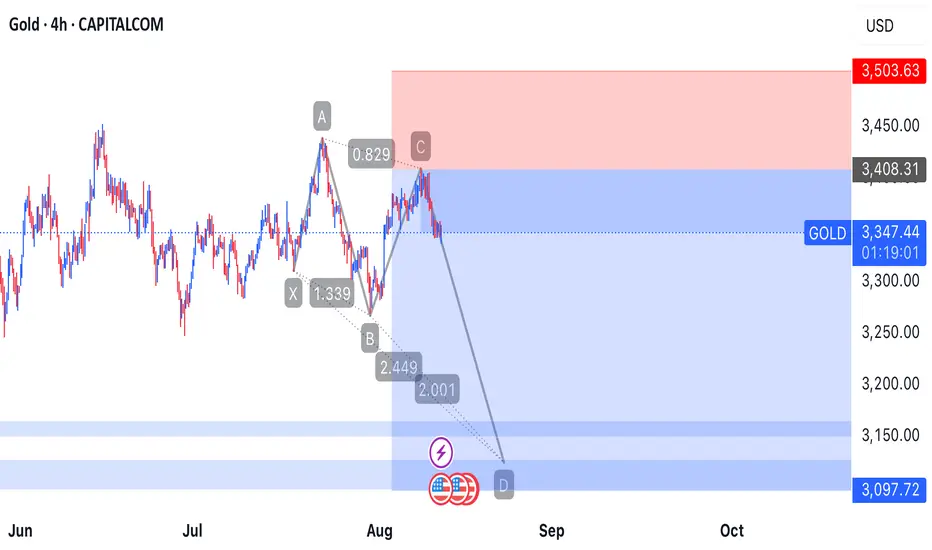
Gold Technical Analysis
---
## ✨ – Where Smart Capital Management Meets Predictive Precision
🔐 **Capital management is the cornerstone of survival and success in this market.** No matter how accurate the analysis or how powerful the pattern, risk control is what separates the seasoned trader from the reckless speculator.
This chart highlights key buy and sell zones, backed by high-probability harmonic patterns such as:
### 🦋 Gartley Pattern
- Identified at a clear reversal zone
- Suggests a corrective move before trend continuation
### 🦂 Deep Crab Pattern
- Highly precise in spotting tops and bottoms
- Enabled a strong move from Sell Zone 2, achieving **560 points**,
---
### 📊 Defined Trading Zones:
| Zone | Trade Type | Potential Outcome |
|-----------------|------------|------------------------|
| Sell Zone 1 | Short | Moderate correction |
| Sell Zone 2 | Strong Short | Sharp bearish move |
---
### 📈 Technical Indicators:
- EMA (50, 100, 200) show mixed momentum signals
- X, A, B, C, D points mark the completion of harmonic setups with precision
---
🎯 **Bottom Line**:
Gold is navigating through sensitive technical zones. Predictive harmonic patterns offer a forward-looking edge, but without disciplined capital management, they remain mere possibilities.
**Be strategic, not just bold.**
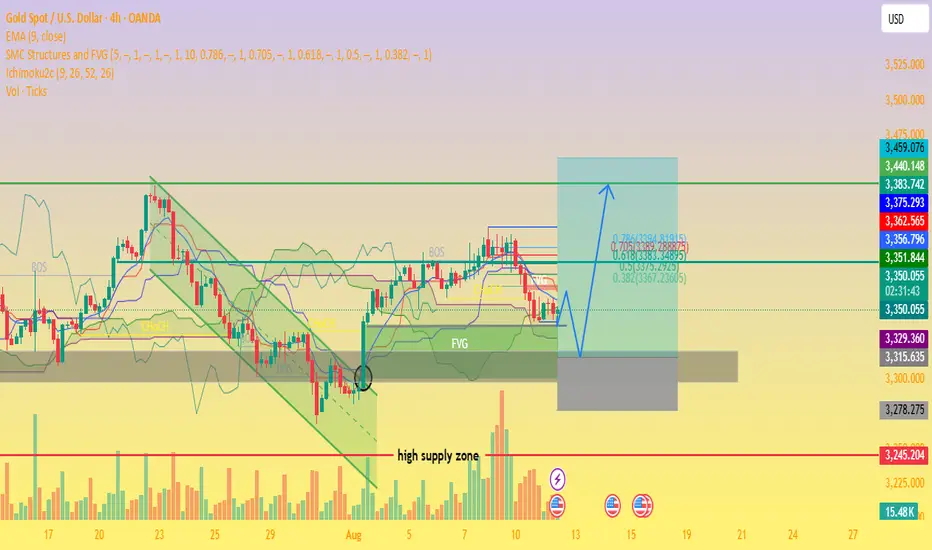
XAU/USD Bullish Bounce from Demand Zone !Gold (XAU/USD) on the 4H chart is showing a potential bullish reversal setup. Price has pulled back into a Fair Value Gap (FVG) and high supply/demand zone near 3,329–3,315, aligning with the 0.382–0.5 Fibonacci retracement.
Key Points:
Support Zone: 3,329–3,315 (demand + FVG).
Bullish Rejection Expected: Price may bounce from this zone, targeting upper resistance levels.
Upside Targets:
TP1: 3,356
TP2: 3,375
TP3: 3,440–3,459 (major resistance)
Invalidation: A daily close below 3,315 could open room for deeper downside toward 3,278–3,245.
Indicators: EMA(9) and Ichimoku showing potential for trend resumption if price closes above 3,362.
Overall, the chart suggests a buy setup on bullish confirmation, aiming for the 3,375–3,459 zone.
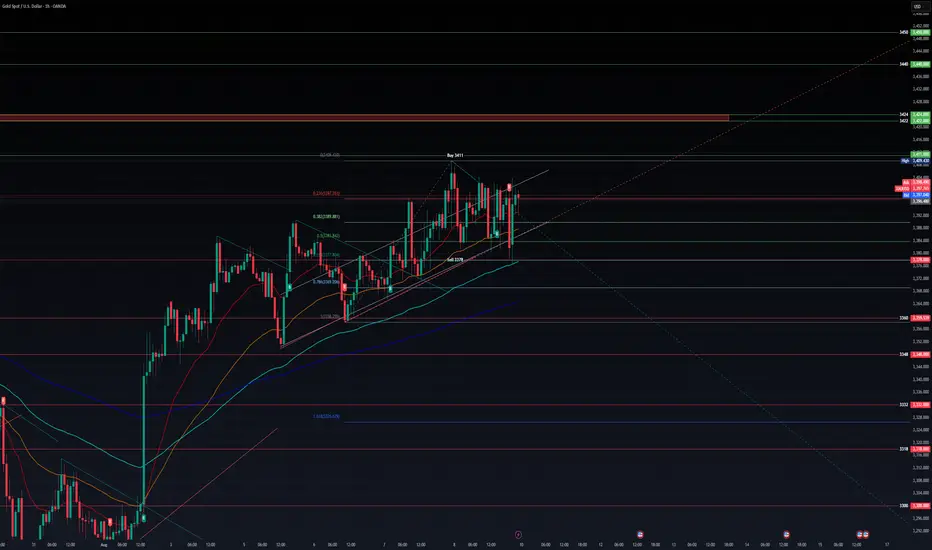
Gold weekly chart with buy and sell levelsGold has been hard to trade over the last few weeks.
news from Russia, Ukrane and trump tarriffs causing wild swings.
saying that Gold likes its key levels and using historical data with proven levels can be a good stratigy as a wait and see.
For a buy i would look at 3411/12 level if broken this should run 20 pips minimum.
On the sell side I would look to enter at 3378, this entry is probably the most likely and would yield the most pips before retracing later on in the week.
As always use proper risk management and dont over leverage in these trades.
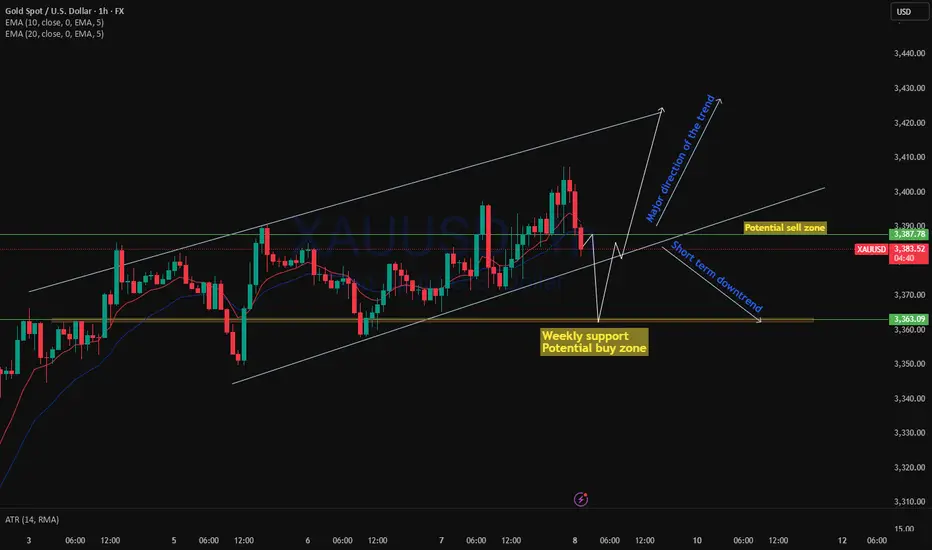
XAUUSD Potential buy and sell zone!XAUUSD Potentially coming for a dipper pullback as upon crossing the daily high we can see XAUUSD started reject from higher price and continue to drop to this daily and weekly support and may continue to drop.
It is possible for the market to potentially bounce off the weekly support as the market is moving up with a stronger momentum
Gold - The diligent top formation!🏆Gold ( TVC:GOLD ) finished the bullrun:
🔎Analysis summary:
For the past 10 years, Gold has been trading in a very strong expected bullrun. Just like we witnessed it in 2011, a 10 year bullrun is followed by a shorter term bearmarket. Gold is starting to lose its strength, which is a clear sign of weakness and the beginning of a bearish reversal.
📝Levels to watch:
$2.800
SwingTraderPhil
SwingTrading.Simplified. | Investing.Simplified. | #LONGTERMVISION

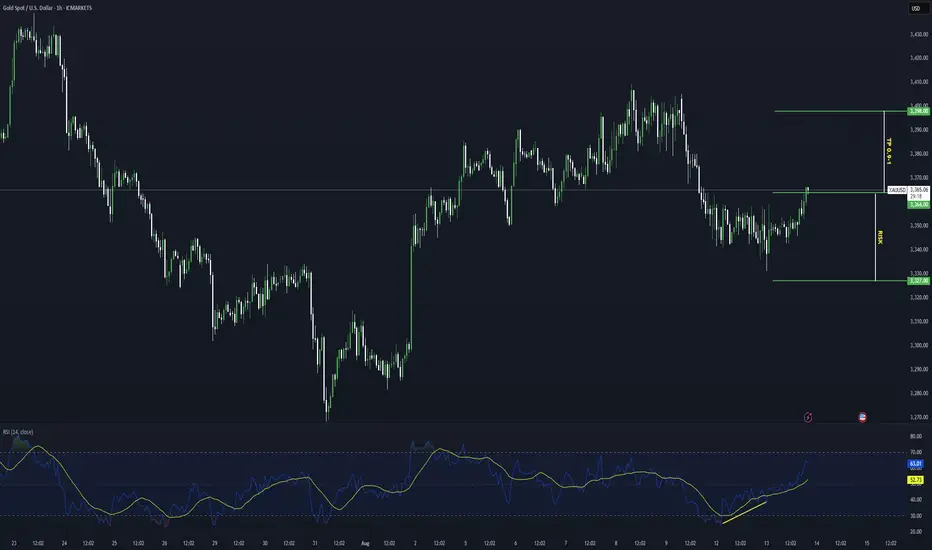
GOLD Potential Bullish Breakout OpportunityGold seems to exhibit signs of a potential Bullish Breakout on the Shorter timeframes as the price action may form a credible Higher High with multiple confluences through key Fibonacci and Support levels which presents us with a potential long opportunity.
Trade Plan:
Entry : CMP
Stop Loss : 3327
TP 0.9 - 1: 3398 - 3402
Gold Market Update weekly demand pullback3360 failed to hold as price action extended into the 3340’s weekly demand zone. This deeper tap into demand strengthens the potential for a bullish recovery, provided price maintains structure above this level.
🟡 Key Watch Points:
Demand Zone Tested: 3340’s
Invalidation: Sustained break below 3340’s
Bias: Bullish recovery if demand holds, follow for more insight , comment and boost idea
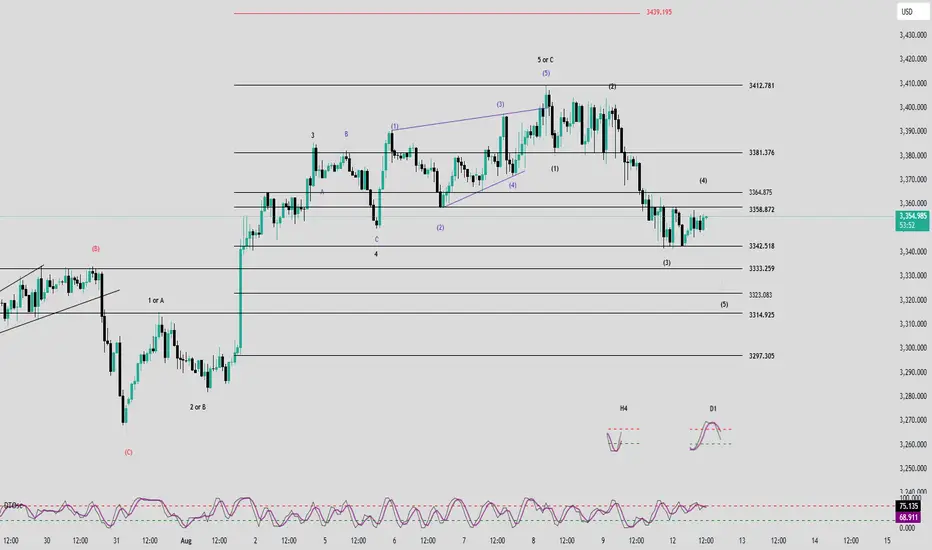
Elliott Wave Analysis – XAUUSD August 12, 2025
1. Momentum Analysis
• D1 Timeframe: Momentum is declining → the downtrend remains intact. It may take another 2–3 daily candles for price to reach the oversold zone and potentially reverse.
• H4 Timeframe: Momentum is rising → from now until the U.S. session, price may either retrace upwards or move sideways.
• H1 Timeframe: Momentum is preparing to turn down → a minor pullback could occur in the short term, so this move should be monitored.
________________________________________
2. Elliott Wave Structure
• The green wave structure in the form of an ending diagonal may have been completed. This could mean that Wave 5 or Wave C (black) has formed.
• Personally, I do not want to see the Green 5-Wave Structure end with an ending diagonal at this stage because:
o If this is an impulsive uptrend structure, we are only at Wave 1 of the larger degree.
o An ending diagonal in Wave 5 (black) indicates weak buying pressure, which is not ideal when price hasn’t broken the previous high to confirm a new trend → increasing the probability that this is a corrective wave.
• Looking at the current downward wave structure, I tentatively label it as five black waves 1-2-3-4-5. The current slight rebound is expected to be Wave 4, which could take the form of either a Flat or Triangle.
• Wave 4 targets:
1. 3358
2. 3364
• If price breaks 3381, the current 1-2-3-4-5 bearish count will be invalidated (Wave 4 would overlap Wave 1). In that case, the structure could turn into a corrective ABC or a new 5-wave advance.
• With a Wave 4 target at 3364, the projected Wave 5 target would be 3323.
________________________________________
3. Combining Momentum & Wave Structure
• D1 downtrend → supports the scenario of another drop, forming Wave 5.
• H4 rising + H1 declining → could indicate Wave 4 forming as a triangle, with the key signal being that the current drop does not break 3342.
o If 3342 breaks, Wave 5 may already be in play, targeting 3323.
• Since H4 momentum is still rising, there remains a chance that price breaks above 3381, which would require a full recount—possibly turning into an ABC correction or a 5-wave rally.
________________________________________
4. Trading Plan
• If Wave 4 forms as a triangle → the 3358 area is a good sell zone, or wait for a breakout below 3342.
• Limit Sell Order:
o Entry: 3364 – 3366
o SL: 3374
o TP1: 3342
o TP2: 3333
o TP3: 3323
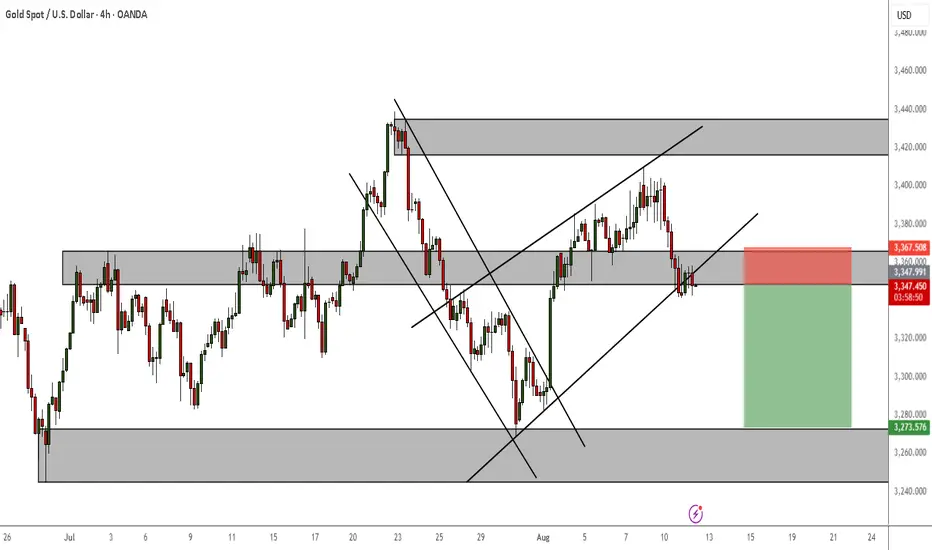
GOLD Rising Wedge within a Bigger ConsolidationSo all we have been doing the past few months with gold is trading a ranging market as seen on the daily TF. We have shorted when price gets to resistance and gone long when it is in support and used various price action patterns and shapes for confluence.
It looks like we now have another confirmation to short to support.
Huang cannot break through 3400, and the bearish trend begins
💡Message Strategy
The gold market has been volatile recently, with price fluctuations weighing on the nerves of global investors. Gold prices saw a significant decline on Monday (August 11th), with market attention focused on the US-Russia talks regarding the Ukraine conflict and the upcoming release of US Consumer Price Index (CPI) data.
These two major events not only have implications for the direction of geopolitical developments but may also provide important clues to the Federal Reserve's interest rate policy, thereby influencing the future trend of gold prices.
📊Technical aspects
Gold bulls rebounded under pressure, retreating to the 3400 level before ultimately breaking down. Gold bulls have lost their initiative, the rebound is weak, and the price continues to fall, breaking new lows. Gold has now reached scenario 2, which we discussed yesterday, at 3350, and is poised for further declines.
Gold's 1-hour high trading volume zone finally broke below, breaking the oscillation pattern. This means the high-level box has formed a short-term top structure, and the resistance at the high level has become very heavy.
At this point, it's no longer advisable to blindly chase gold prices; a bearish outlook on a pullback is the prevailing trend.
💰Strategy Package
Short Position:3360-3365,SL:3380,Target: 3330

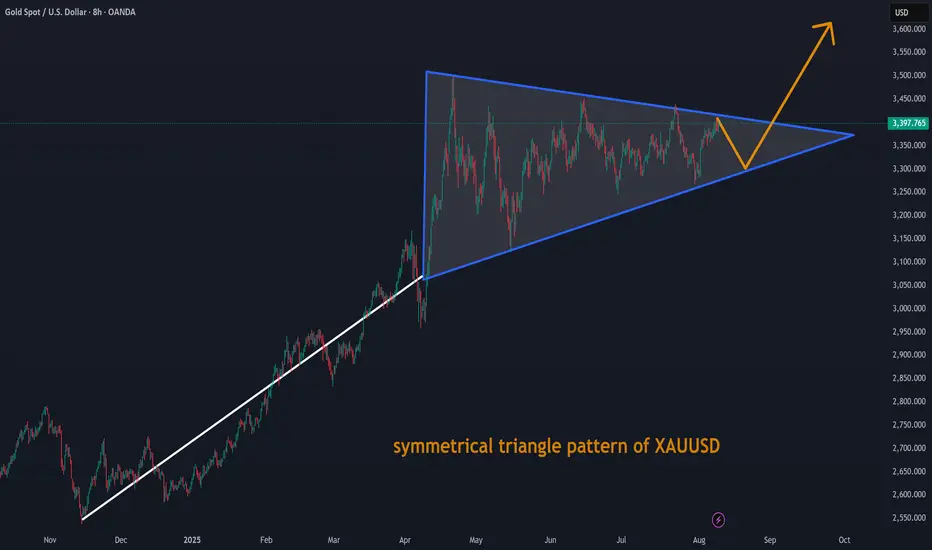
symmetrical triangle pattern of XAUUSDsymmetrical triangle pattern of XAUUSD. It is consolidating in narrow area within Trangle.
XAUUSD → Correction before a Breakout and RallyGold (XAUUSD) is expected to pull back slightly before making a bigger move up. Right now, it’s facing some resistance, so a small drop is likely. But the long-term trend remains bullish due to factors like possible Fed rate cuts and global uncertainty. After this correction, gold could break higher. Traders should watch for buying opportunities near support levels. The strategy is to "buy the dip" for a potential rally later.
Read the chart for entry and exit points
Do your own research before making any decision of Buying or selling trade in gold as market is more volatile...
This is not a financial advise to trade and this is just an educational purposes