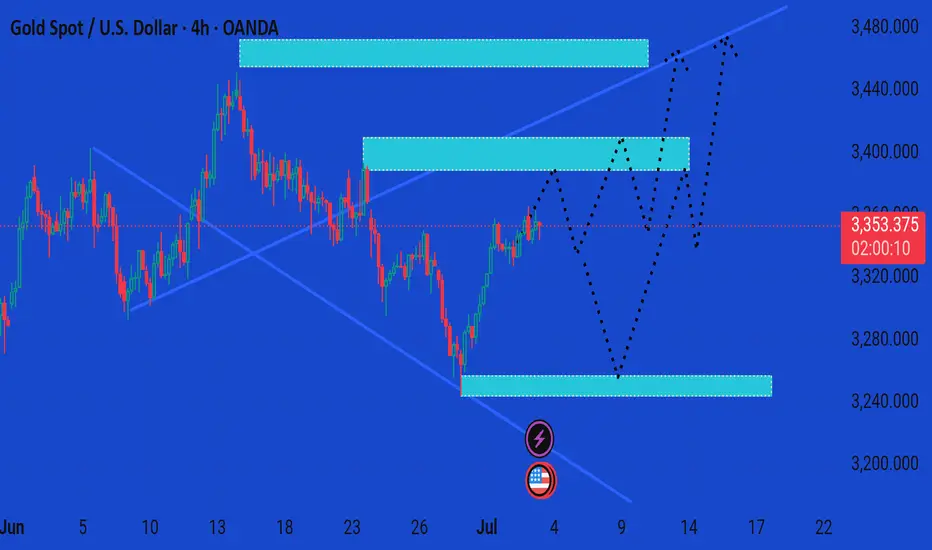
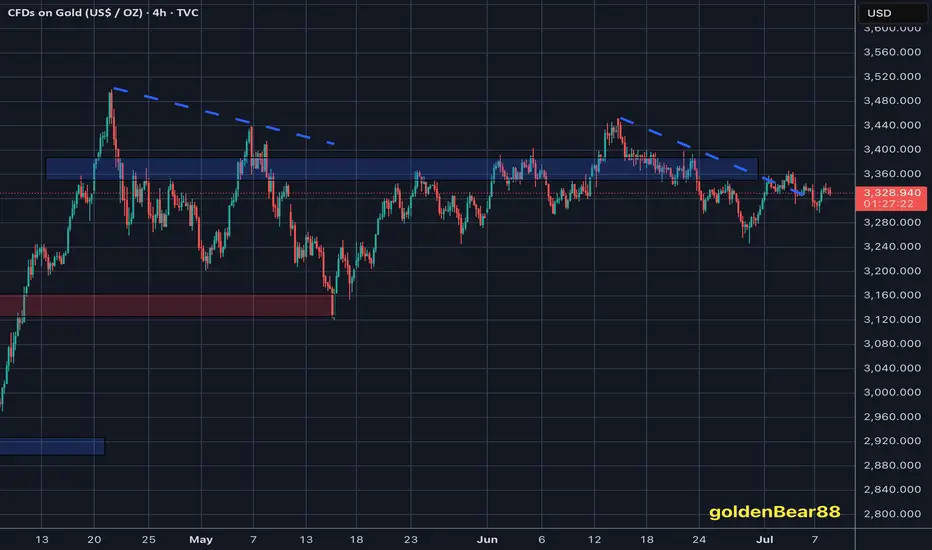
Xauusd market update This chart presents a 4-hour analysis of Gold Spot (XAU/USD) against the US Dollar, showing potential bullish scenarios based on price zones and market reactions.
Key Insights:
Current Price:
$3,353.31, slightly down 0.11%.
---
Highlighted Zones:
1. Resistance Zone (~$3,420–$3,455):
Price reacted here previously.
Marked as a potential final target for bullish momentum.
2. Mid Supply/Resistance Zone (~$3,370–$3,405):
Critical decision area.
Price might face consolidation or rejection.
3. Demand Zone (~$3,240–$3,270):
Previously respected support.
Ideal area for a bullish reversal if price dips.
---
Projected Price Paths (Black Dotted Lines):
Scenario A (Immediate Bullish):
Price consolidates above $3,350.
Breaks into the mid-zone, then pushes to $3,450 resistance.
Scenario B (Pullback Then Rally):
Declines to the $3,250 demand zone.
Rebounds strongly, breaks mid-zone, and heads for $3,450.
Scenario C (Range-bound):
Multiple bounces between $3,250 and $3,405 before a decisive breakout.
---
Conclusion:
The chart suggests a bullish bias as long as price holds above the $3,250 support zone. Breakout confirmation above $3,405 could pave the way toward $3,450+. However, a drop below the demand zone would invalidate the bullish outlook short-term.
Would you like a trading plan based on these scenarios?
XAUUSD trade ideas
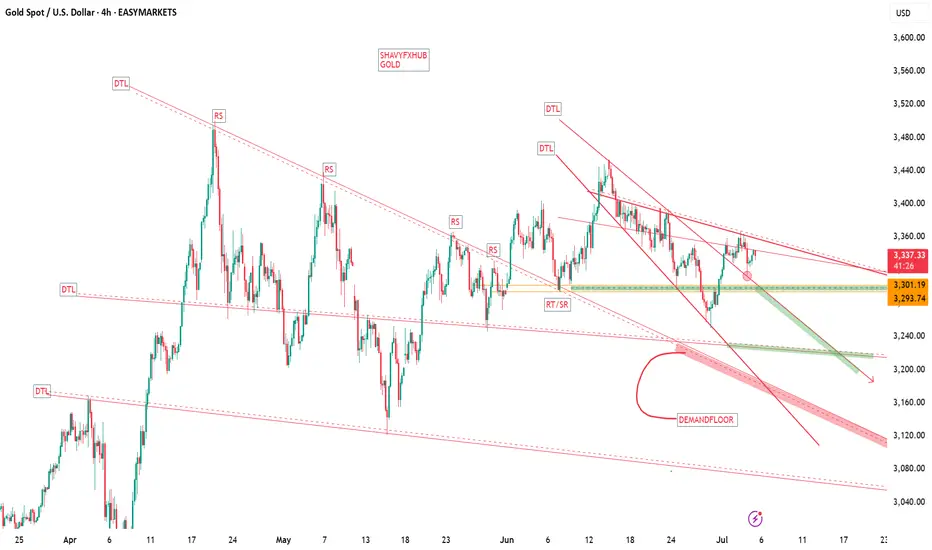
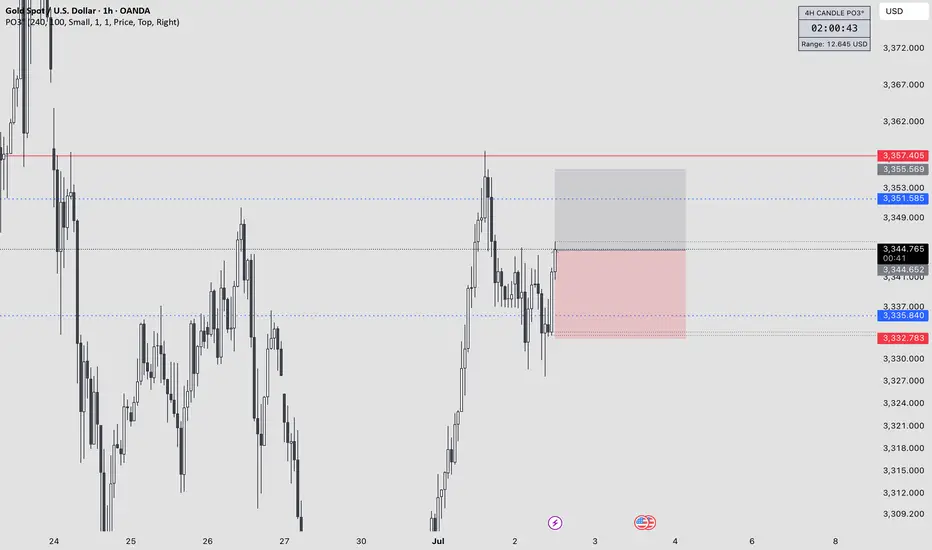
XAUUSD: Market analysis and strategy on July 3Gold technical analysis
Daily chart resistance level 3400, support level 3300
4-hour chart resistance level 3382, support level 3327
1-hour chart resistance level 3364, support level 3341
After bottoming out, the lowest point of yesterday's correction, 3327, has become an important support. Today's gold is still a strategy of buying at a low level. This idea can be maintained before the release of NFP employment data. Tomorrow, the US Independence Day will be closed for one day. The NFP data will be released in advance today, and the trading market will be closed in advance.
Judging from the current market trend, today it broke through the previous high of 3357. Today's Asian session slightly rose to 3365 and then quickly fell back to 3341. The low point of the Asian session retracement of 3341 is a small support. The second is the low point of 3333 in the US session yesterday. The support point of 3333/41 can be bought when the European session falls back. The possibility of a unilateral rise in the high point of today before the NFP data is small. I expect it to fluctuate and wait patiently for a pullback to buy. Today's NY market risk is relatively high. Please try to avoid trading during news time!
Buy: 3341near
Buy: 3333near
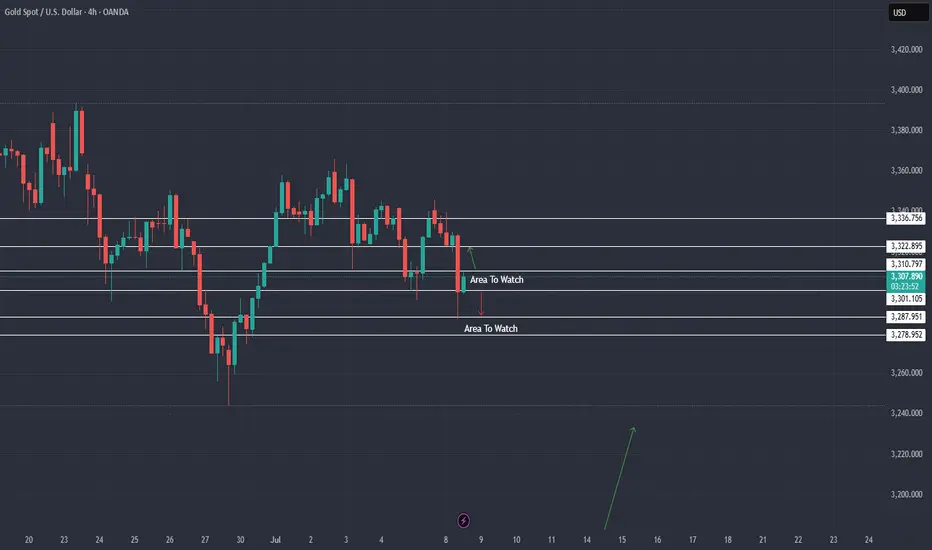
XAU / USD 4 Hour ChartHello traders. Taking a look at the 4 hour chart, I have marked the areas of interest. I would need a break and close out of the current trading range. Sells below 3301, and buys above 3310.. I am not getting stuck trading in the range, so those are my markers to wait for a break and close out of. So being that we are almost mid week, I am just going to watch for now until a valid set up appears. Big G gets my thanks. Be well and trade the trend.
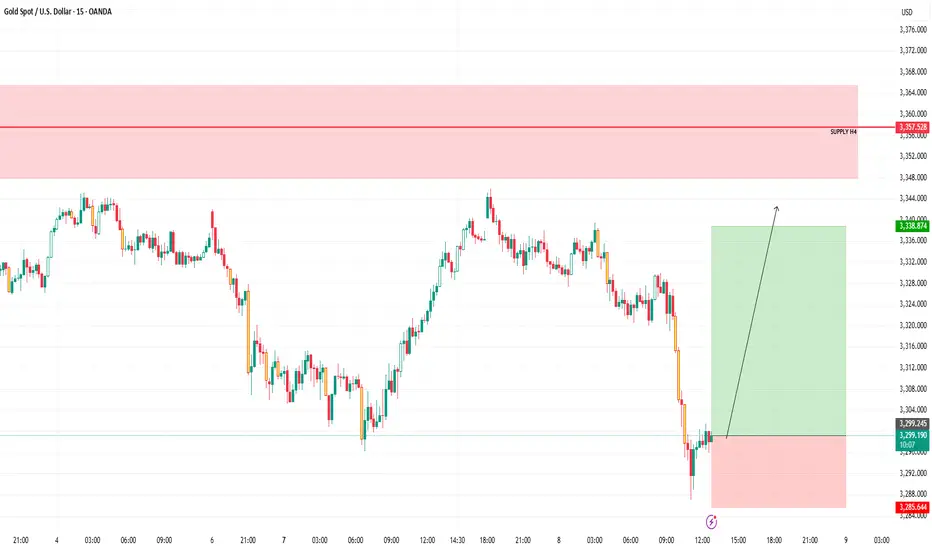
XAUUSD BUY OPPORTUNITY!🟢 Current Trade Setup (Buy Position)
Entry: Around 3,299.46
Take Profit (TP): 3,338.87
Stop Loss (SL): 3,285.64
Risk-Reward Ratio: ~1:3 ➜ This is a favorable R:R setup.
Key Zone - Supply Area
Marked as SUPPLY H4 (Higher Time Frame 4H supply zone).
Price Range: ~3,350 to 3,368+
This is where sellers may aggressively enter the market.
A potential reversal zone—watch price action closely when it reaches there.
🔸 Recent Price Action
A strong sell-off occurred before this setup.
Price then formed a sharp wick and a potential demand reaction around 3,285–3,290.
Price is now attempting a bullish recovery (possibly a liquidity grab followed by accumulation).
🔸 Bullish Signal
The recent structure shows a double bottom / demand reaction.
Entry aligns with the bottom of the move, offering good positioning.
📌 What to Watch
Intraday Buyers’ Momentum:
If volume supports upward momentum, it could push price toward TP.
Reaction at 3,320–3,340:
Minor intraday resistance zones before the TP.
If price hesitates, consider partial profit-taking.
Rejection from Supply H4:
TP is placed just below the H4 supply zone — smart take.
Avoid extending TP unless there's a strong breakout candle.
🧠 Summary
✅ Strong R:R setup.
✅ Clean reaction from demand.
🚨 Supply H4 zone ahead — expect resistance near 3,350–3,360.
📈 As long as price holds above ~3,290, the setup is valid.
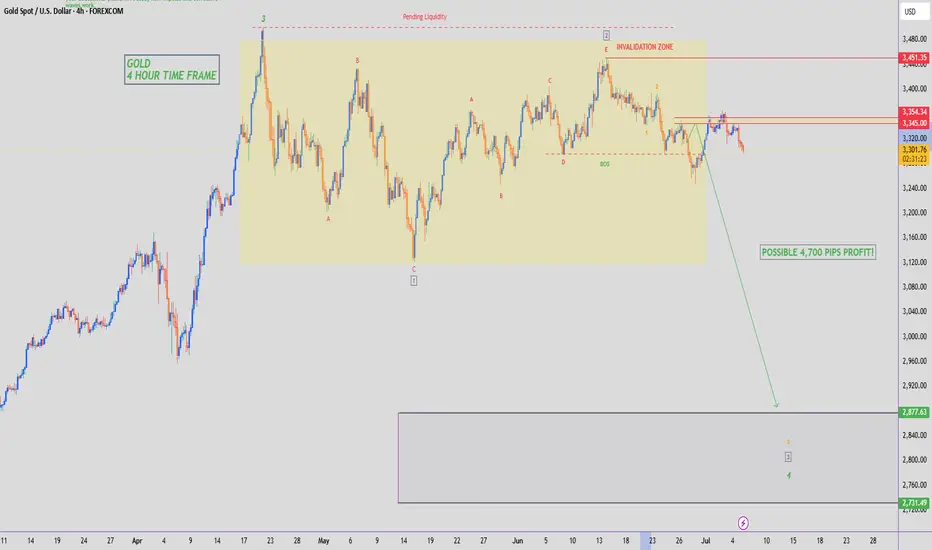
GOLD - SHORT TO $2,800 (UPDATE)Gold has started the week extremely bearish, down 450 PIPS since last night at market open. This puts our 'Sell Trade' in 480 PIPS profit so far. Great start to the week.
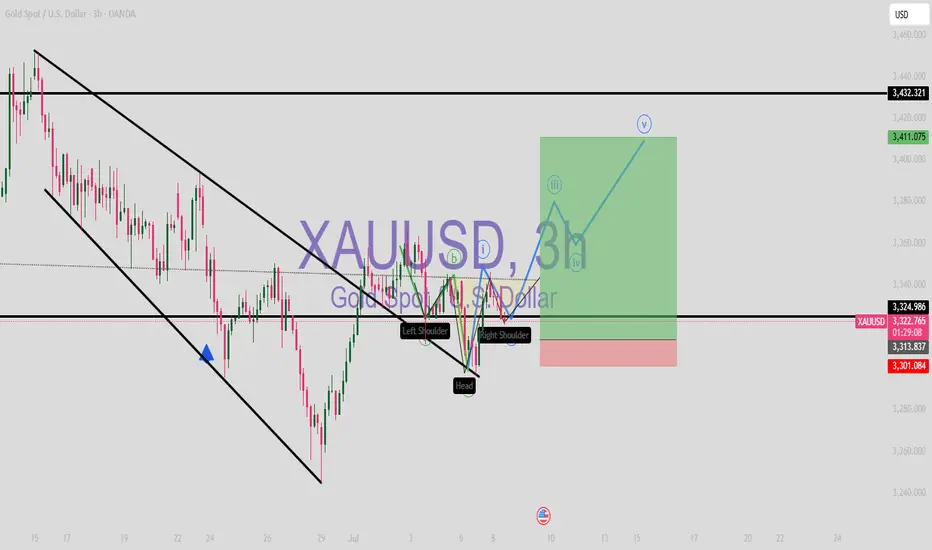
XAUUSD (LONG)
Inverse head and shoulders
Restest of tredline(previous was resistance now support)
Eliiots wave count (ABC done,1-5 in progress)
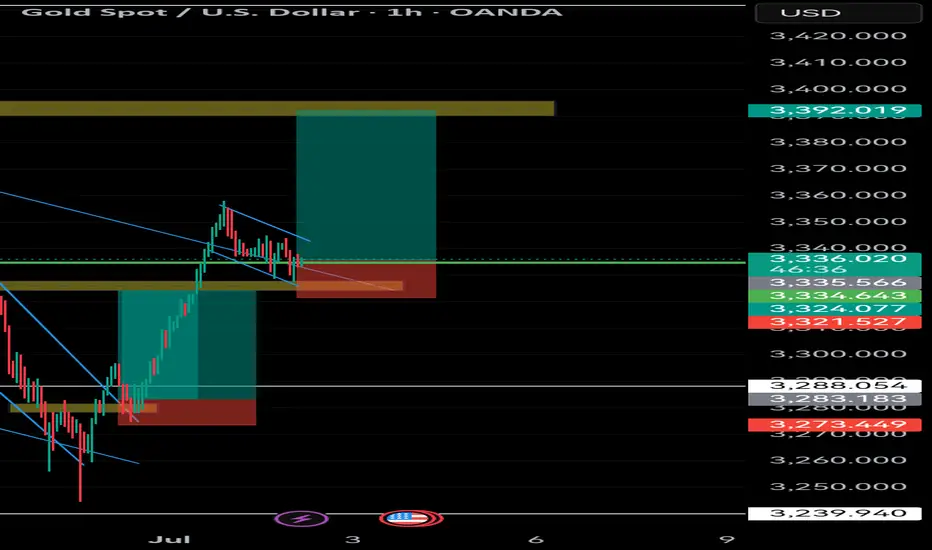
Excellent yesterday's sessionAs discussed throughout my yesterday's session commentary: "My position: In my opinion I need to stay on Hourly 4 time-frame for us and the potential break-out to the downside since Hourly 4 chart remains Bearish (never Swing Buy while #H4 is Bearish) on logarithmic scale, hence on limited upside. My expectation is that we still have one (minor) rebound left which will be the final Selling attempt / entry towards #3,300.80 benchmark, if Buyers manage to reverse this, #3,352.80 and #3,400.80 marks are Targets to monitor / which I will pursue with set of Scalp and Swing orders. Trade accordingly as I Bought #3,302.80 with set of aggressive Scalp orders."
I have Bought Gold with aggressive Scalps from #3,297.80 - #3,302.80 zone, firstly closing my orders as near as #3,310.80. Later on, did #4 more Scalps from #3,308.80 - #3,313.80 / closing all as near as #3,322.80 as I announced that Gold will certainly recover as per above (cca #171.000 EUR Profit using #100 Lots).
Technical analysis: Ranged Price-action came as no Technical surprise as Price-action remains in Rectangle on a combination of Fundamental pressure and Technical necessity for a Lower Low’s extension. It is closely related to currency Volatility on DX (and the economy related Fed’s talks and Tariffs agreements of utmost importance) as the Price-action in near equilibrium with DX (# -0.27%) also on Weekly scale and even if the pair completes full scale reversal, Gold should stay under Selling pressure. On the Short-term side, there is an clear Resistance and Support zone, limiting Sellers advances to it’s maximum thru Fundamental side (every early to late U.S. session revives Buyers on the aftermath). Gold should already Trade widely below #3,300.80 psychological barrier, but now Resistance tests seems more likely to develop and showcase Short-term Buyers presence. Hourly 4 chart points that Lower High’s Lower zone is near and Resisting the Price-action at #3,334.80 - #3,342.80 which makes it an possible Hourly 1 chart’s Ascending Channel variance - typical Target of similar sequence if break-out is delivered includes #3,348.80 - #3,352.80 on Short-term. In extension - I will advance with extreme care ahead of the most significant macroeconomic events of the week and since my model leans more to the Bullish side and Fundamentally Gold may soar, I will remain Scalping Gold as using Swing orders practically is worthless on such market.
My position: I will keep Buying and Selling Gold only with my aggressive Scalp orders from my key entry and reversal points.
Gold sell off before continuation higher? Pending order set on this one before bed
Will see what develops overnight
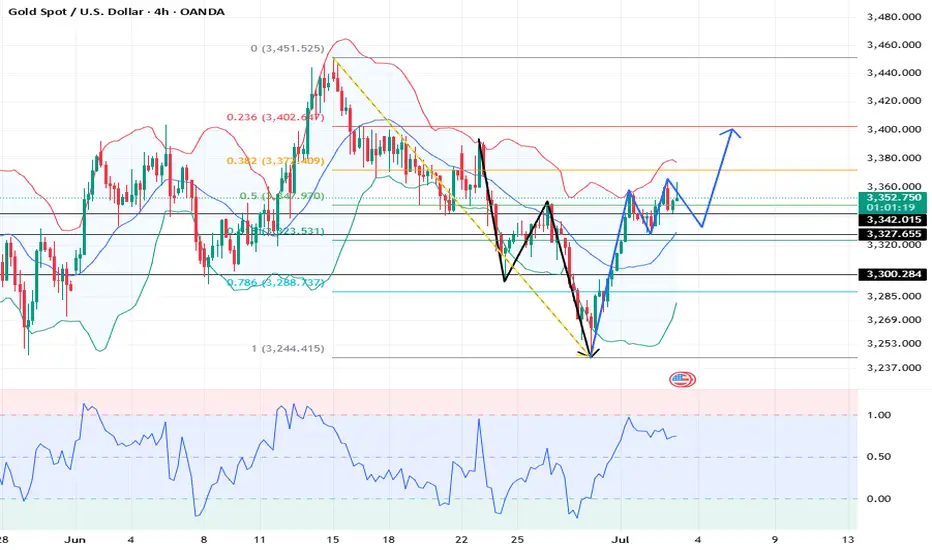
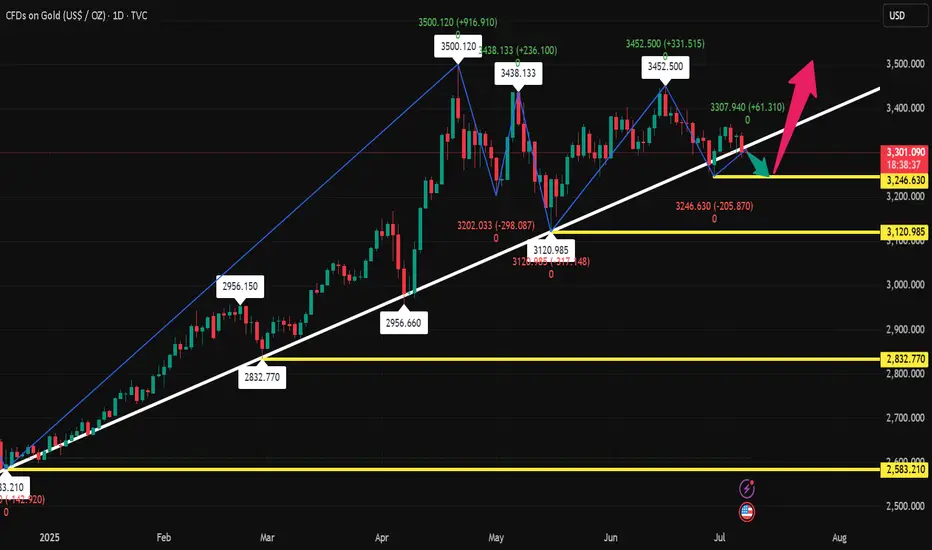
Ready, Steady...?Gold has consolidated the past few weeks and has now bounced from solid support.
The current wave 4 looks complete and should now be followed by a strong upward move in wave 5, wave 5's in the metals are the strongest...expect a move towards $4000 coming.
Your chance to get on board early and ride this bull run again!
Appreciate a thumbs up, good trading and God Bless you all!

GOLD trading GOLD requires multiple broker chart ,on different time frame candle closes are not the same.in trading every candle type have a specific meaning and the wicks and rejection represent the emotion of trade and tell a story about a particular level.
Gold Intraday Trading Plan 7/4/2025Yesterday Gold did move up from 3350 to 3365 local high and quickly dropped under 3330. But I see this drop as correction not trend reverse. Right now it has entered a consolidation zone.
Therefore, I am looking to buy from 3300 and sell from 3330. Will trade between these two levels.
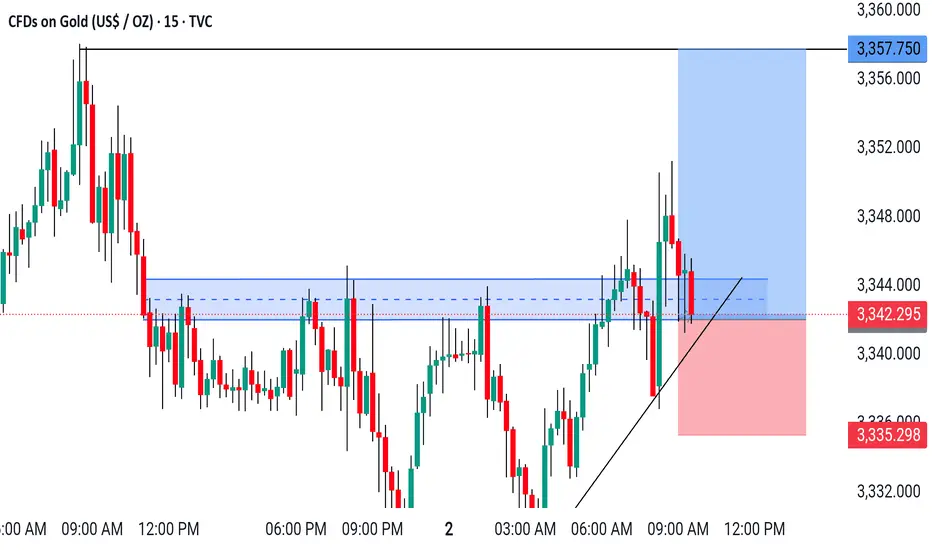
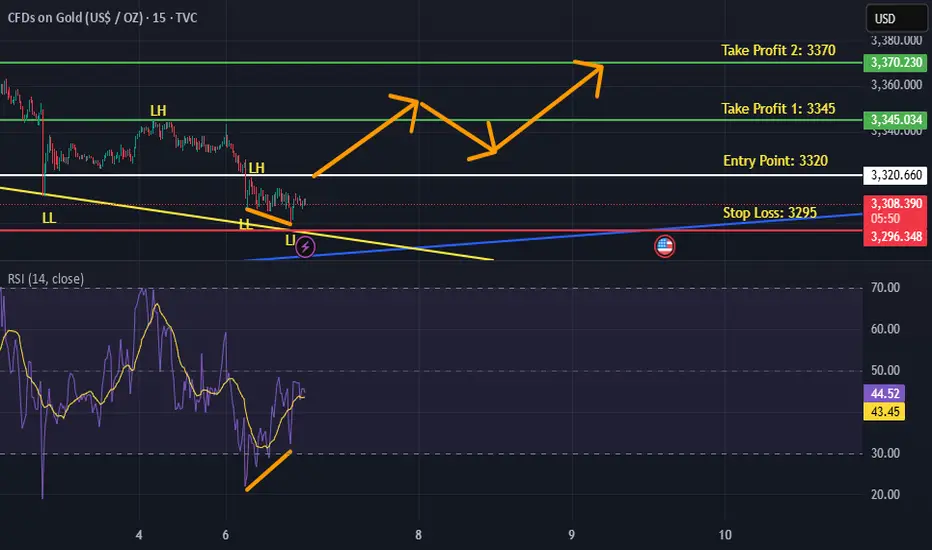
XAUUSD /GOLD M15 Chart Gold buy 🚀💯
* Entry: ~3342 📊
* Take Profit: ~3348
* Take Profit: ~3357
* Stop Loss: ~3335
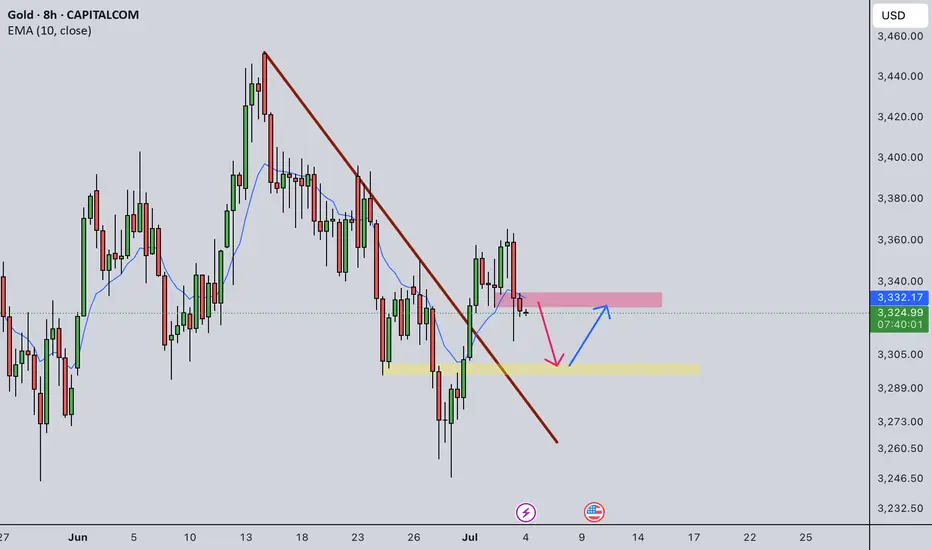
7.9 Gold long and short switches frequently!From the daily chart, the overall gold price is still in a weak position, the moving average is hooked, and the upper pressure is near the moving average 3319. Only if it breaks through and stands firm at this position during the day, can the bulls start to exert their strength. It happens that the MA10 position of H4 is also near 3319. At present, H4 is in a bearish trend, so the bullish pressure is still very large, but it rose in the early morning, and it bottomed out and rebounded. Combined with the recent non-continuation of the long and short trends, there is a high probability of rebounding during the day, so we can go long in the Asian session first, and go long directly at the current price of 3300, add positions to 3295, defend 3286, and look at 3312-19. The focus is still on the strength of the European session. If the European session is strong, continue to go long before the US session retreats; if the European session is weak, the US session will bottom out and rebound!
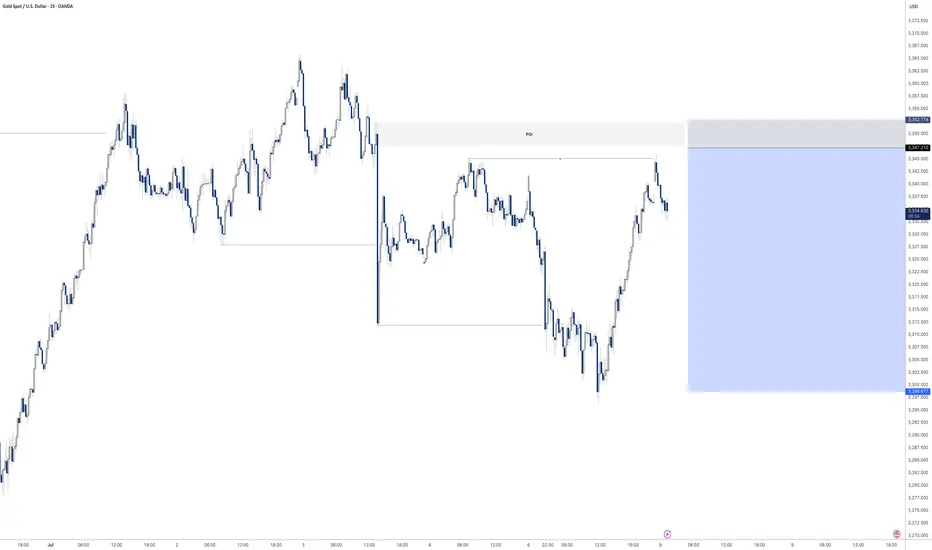
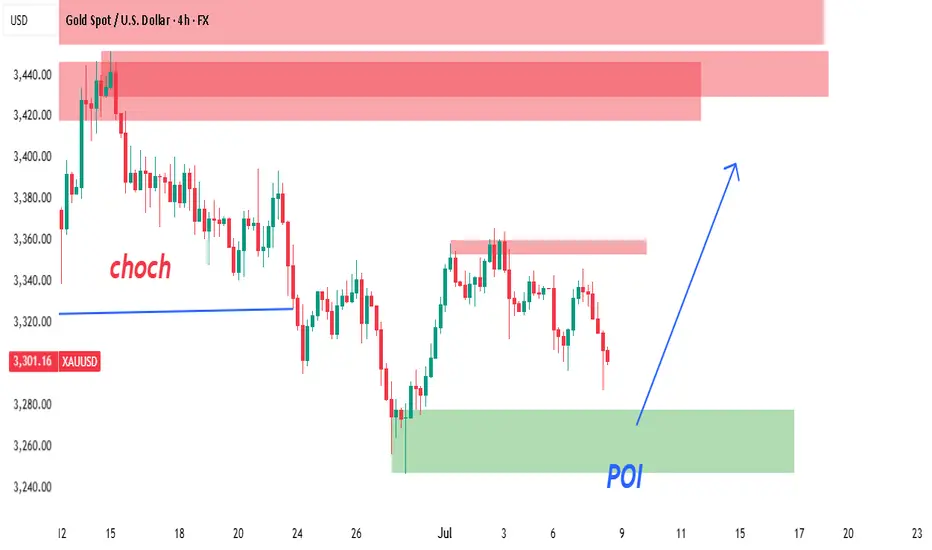
XAUUSD 4H – Smart Money Concept (SMC) SetupPrice action on the 4H chart shows a confirmed Change of Character (CHoCH) at the 3,320 level, marking a shift from a bearish trend into potential bullish order flow. This CHoCH is supported by a strong break of internal structure followed by a pullback.
🧠 Smart Money Insight:
CHoCH Zone (Break of Structure): Price broke the previous lower high, confirming possible bullish intent.
POI (Point of Interest): A refined 4H demand zone sits between 3,280–3,310, aligning with a previous accumulation area. Price is currently approaching this zone with decreasing momentum (potential liquidity sweep below minor lows).
Liquidity Grab: Several equal lows were formed before the POI — prime setup for a liquidity sweep before a bullish push.
Refined Entry Zone: Based on candle wicks and order block imbalance.
🎯 Trade Idea:
🟢 Entry: Wait for bullish reaction or confirmation inside the POI zone (3,295–3,305)
🎯 Target Zones:
TP1: 3,380 (reaction level)
TP2: 3,420–3,440 (major supply zone + inefficiency)
🛡️ Stop Loss: Below 3,270 (invalidates demand zone and structure)
📈 Bias: Bullish unless POI fails
🔍 Confluences:
✅ 4H CHoCH Confirmed
✅ Price approaching refined demand zone
✅ Liquidity resting below recent lows
✅ Previous imbalance not yet filled
✅ Clean supply zone overhead (TP target)
💬 Conclusion:
This is a clean SMC-based long setup. We are waiting for price to tap into demand and show bullish intent before entry. Strong probability of reversal into premium pricing zone if structure holds.
📍Drop a like if you caught this setup or save it to monitor the reaction!
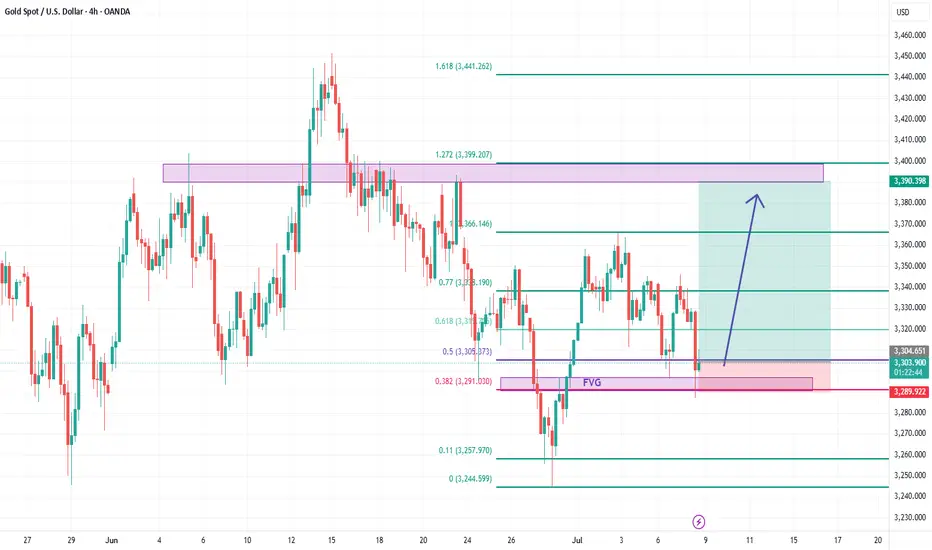
Gold next setupAs you see on chart
gold rebound from Fibo 38 + FVG
If 2290 hold
we may see 3390
Entry point now @ 3404
SL 2290
TL 3390
RR 8:1
good lock
Wego
GOLD – Demand-Driven Strength Amid Economic DataGOLD – Demand-Driven Strength Amid Economic Data
Gold (XAUUSD) continues to show bullish momentum today, driven by increased demand and buying interest following a backdrop of recent economic data.
Key Price Levels to Watch:
Resistance Zones: 3320 and 3345 / 3293
Technical Outlook: The recent decline is forming an interesting bullish correction pattern, and as long as bulls maintain price within the upward trend channel, the structure remains constructive.
You may find more details in the chart Ps Support with like and comments.
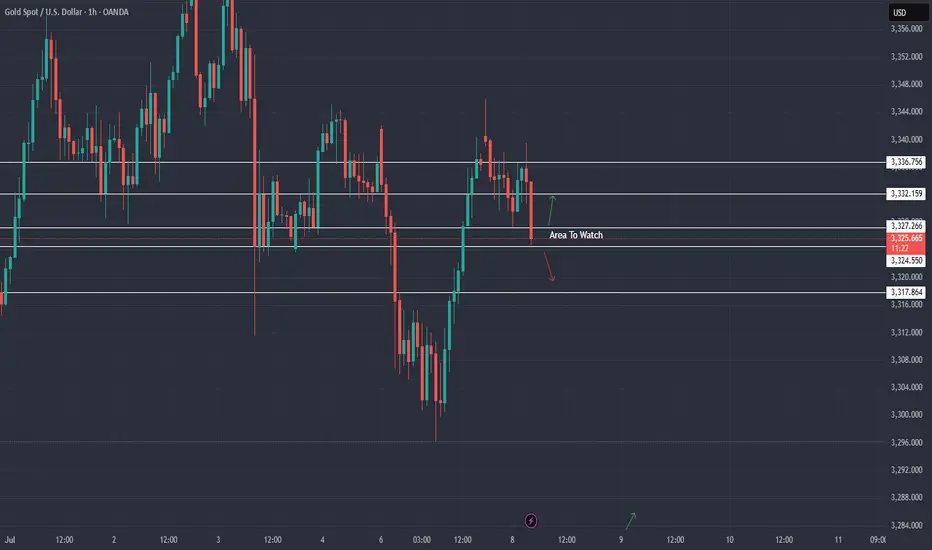
XAU / USD 1 Hour ChartHello traders. I have marked my area of interest on the hourly chart. We have Pre NY volume starting in 2.5 hours or so from now. Looking to see if we correct the move down from the overnight sessions , or do we continue down to retest a lower area for support, as marked on the chart?? Patience is key. Big G gets my thanks. Be well and trade the trend, I will post another chart / update in a few hours.
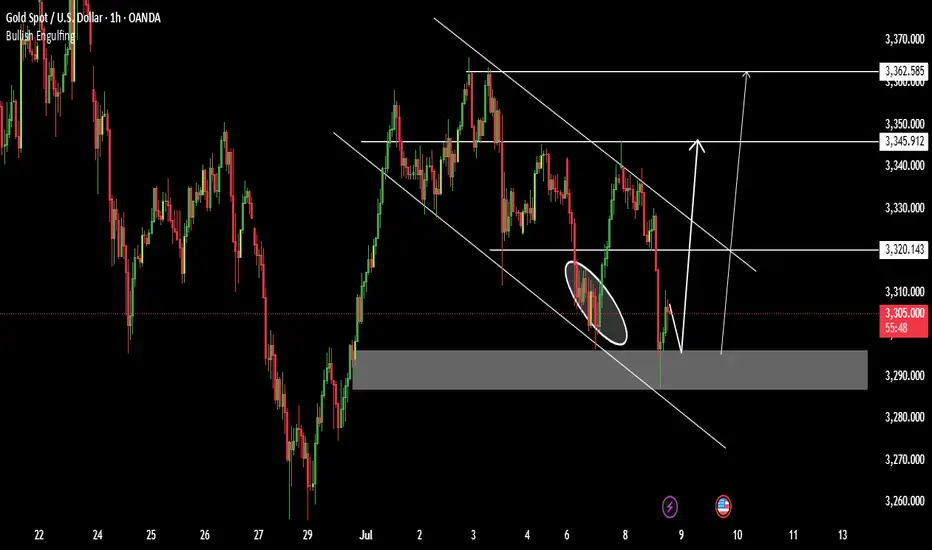
XAUSD is BullishPrice was in a downtrend, however the bullish divergence on 15 min time frame hints the control of bulls, if previous lower high is broken with good volume then we can expect a bullish rebound from the levels as per Do w theory. Targets are mentioned on the chart chart.
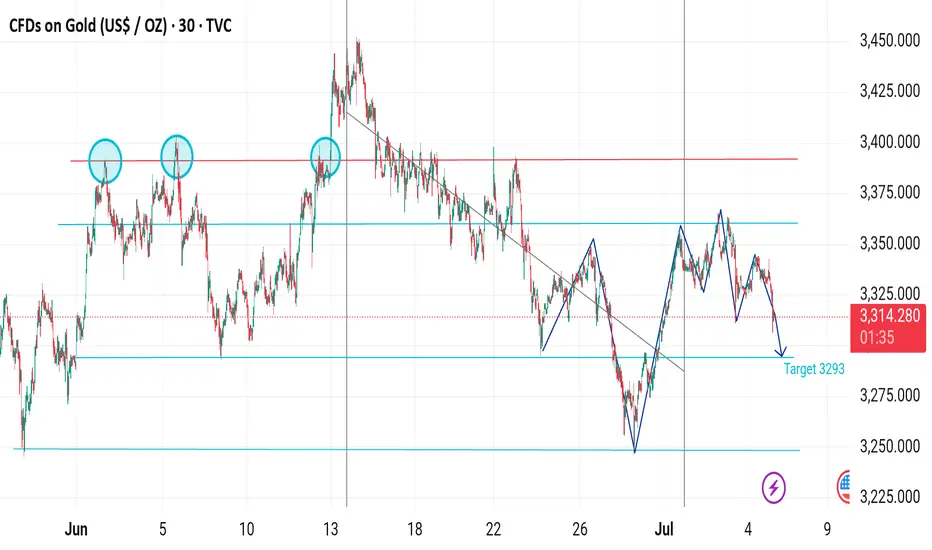
Gold Bearish Reversal – Targeting 3293 After Channel Breakdown📉 Gold (XAU/USD) 30-Min Chart Analysis:
🔹 Pattern Overview:
Triple Top Formation spotted (circled areas), indicating strong resistance around the 3,365–3,375 zone.
A descending channel formed after the top, showing consistent lower highs and lower lows — clear bearish momentum.
Fib retracement level (0.618) acted as a resistance during the bounce.
🔹 Current Price Action:
Price broke down from the recent bullish correction inside the channel.
Bearish impulse wave is forming again after lower high around 3,355.
Price is currently dropping from ~3,360 to 3,313, heading toward key support.
🔹 Target & Support:
Marked downside target: 3,293 — aligned with prior support zone and measured move from the last swing high/low.
This is a critical demand area; potential short-term bounce could occur there.
🔹 Conclusion:
Bias: Bearish below 3,335.
Immediate Target: 3,293
Invalidation: Break above 3,355 could delay or reverse bearish move.

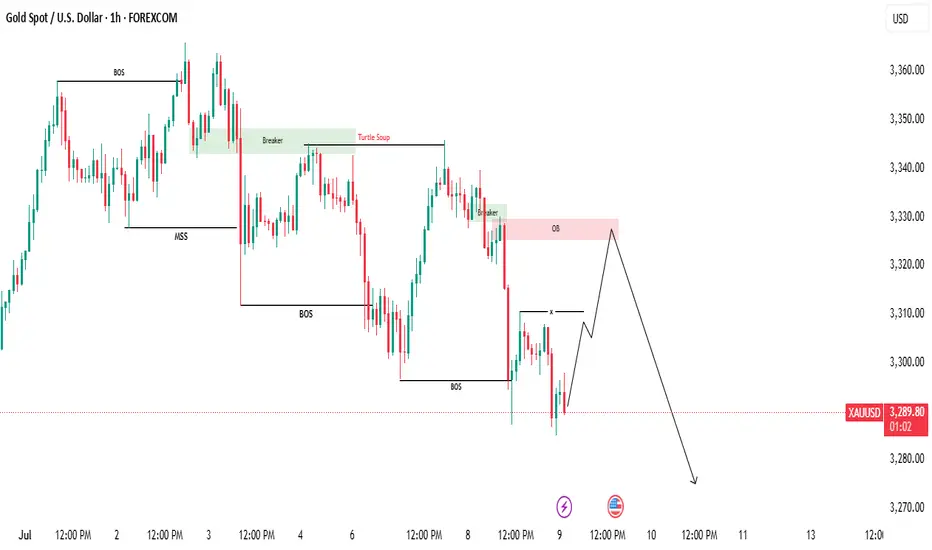
A High-Probability Play Unfolding!🌟 GOLD MARKET OUTLOOK – A High-Probability Play Unfolding! 🟡📉
Gold was riding a solid uptrend recently, showing strength across the board. But over the past few days, things have started to shift. We've seen a clear Market Structure Shift (MSS) followed by a Break of Structure (BOS) to the downside — signaling the start of a short-term bearish trend.
📍 What’s Happening Now?
Gold is currently trading lower after the BOS, but the market is now approaching a critical phase...
We’re expecting a retracement move to the upside — a temporary pullback that could trap early buyers (this is called inducement). This is where things get interesting!
🎯 What to Watch For:
Once the retracement plays out, we’ll be watching closely for:
🔻 Bearish Fair Value Gaps (FVGs)
🔻 Supply Zone Order Blocks
These areas could offer us high-probability sell entries aligned with the overall bearish momentum.
📉 The Target?
We’ll be aiming for the previous swing low, where liquidity is likely resting — a classic price magnet in such setups.
⚠️ Be Patient. Let the Market Come to You.
Wait for the retracement, let price fill the gaps, and only then look for confirmation to enter. Rushing in now means going against smart money flow.
🧠 DYOR – Do Your Own Research!
This is a market roadmap, not a signal.