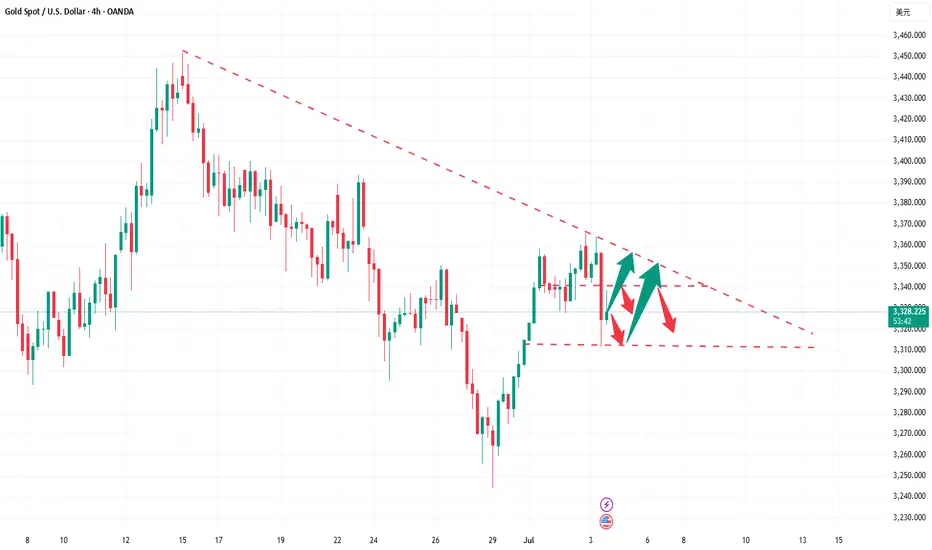
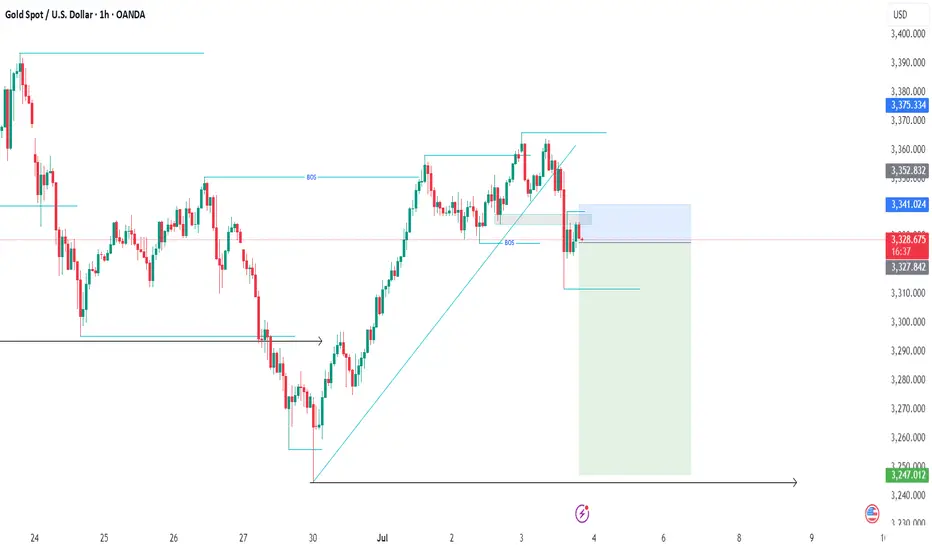
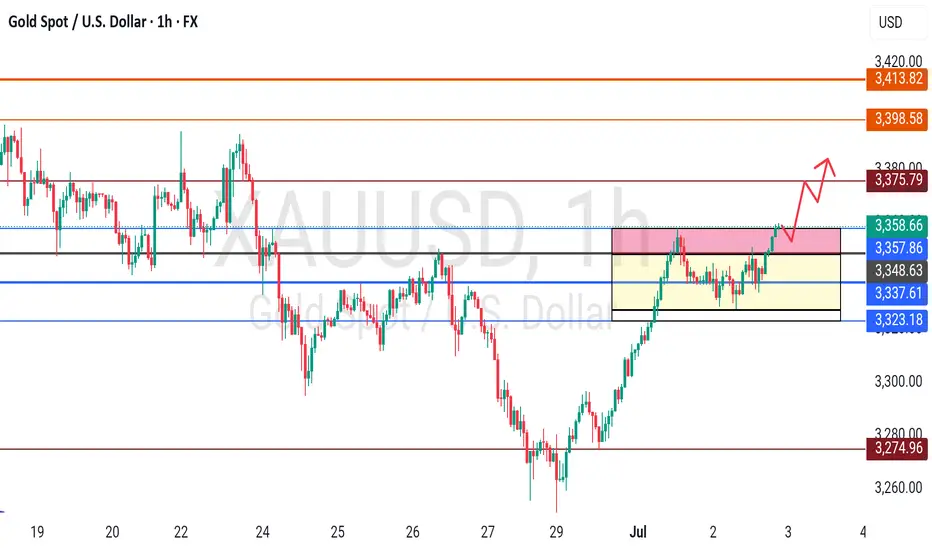
Gold may need to retreat to around 3300 againYesterday, the gold rebound stopped at around 3358, and then began to retreat. After that, it even failed to stand above 3350 during the rebound process, which to a certain extent hit the confidence of the bulls;
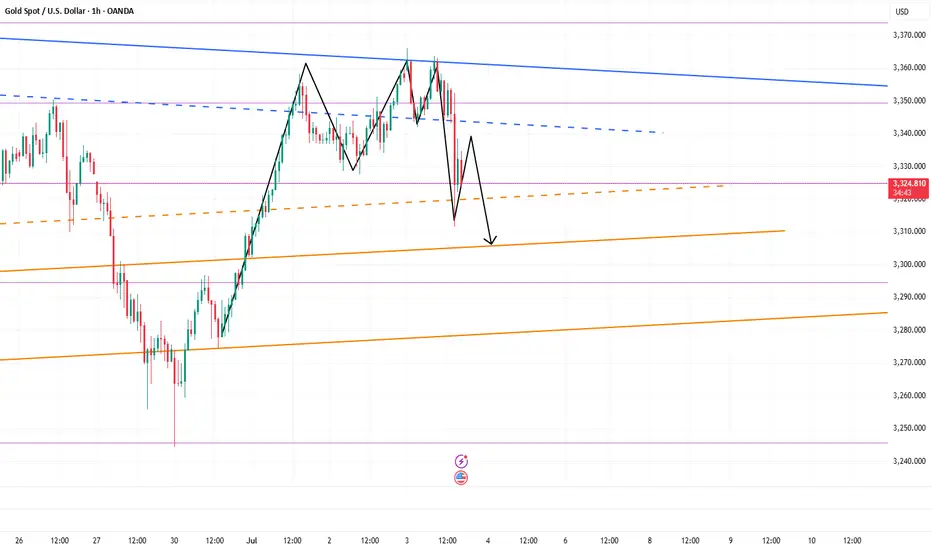
At present, gold has retreated to the area near 3330 again. Although gold has fallen slowly, the center of gravity of gold is still shifting downward in the short term, and the trading volume of gold is gradually increasing when it is falling, so I think the short position may not be over, and the 3330 area may be broken at any time; and the support area that really deserves our attention is first the 3320-3315 area, followed by the 3300-3295 area;
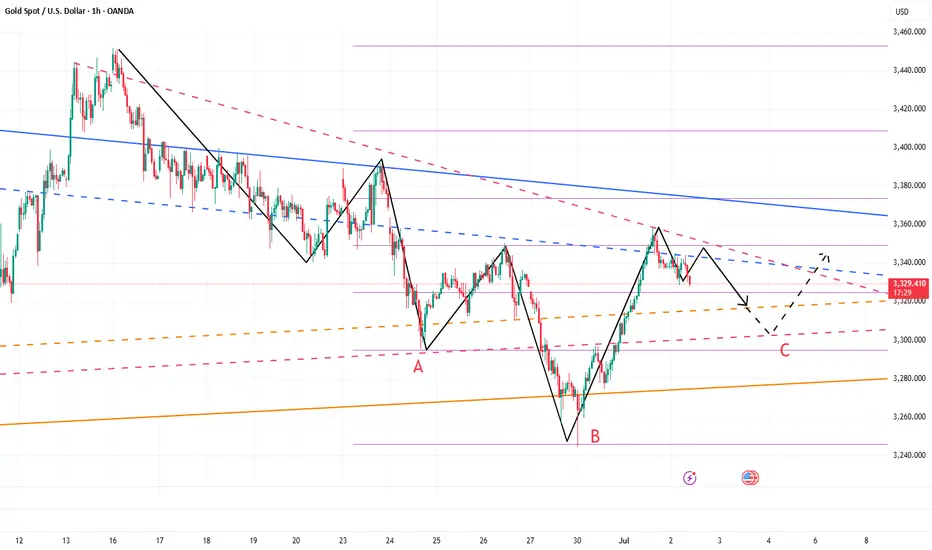
From the current gold structure, I think gold may still test the area near 3300 again before rising. Only after gold retreats to the area near 3300, it is possible to build an A-B-C head and shoulders bottom structure at the technical level (as shown in the figure), which can also help gold build a complete and effective rising structure, so gold has the need to retreat to the area near 3300 to build a right shoulder structure.
Therefore, I think shorting gold is still the first choice for short-term trading at present; you can consider shorting gold in the 3335-3355 area, looking at the target area of 3320-3310-3300.
XAUUSD trade ideas
Gold (XAU/USD) Technical Outlook — July 1, 2025In the world of financial markets, few assets capture global attention like gold. A timeless store of value, gold continues to act as both a hedge against uncertainty and a battleground for technical traders seeking high-probability setups. As of today, gold (XAU/USD) is trading at $3328, a level that places it just beneath the most recent multi-month high at $3345. The recent surge in price is underpinned by both macroeconomic factors and bullish technical structure. However, as any seasoned trader knows, trends rarely move in straight lines — and gold is now approaching a technically sensitive juncture.
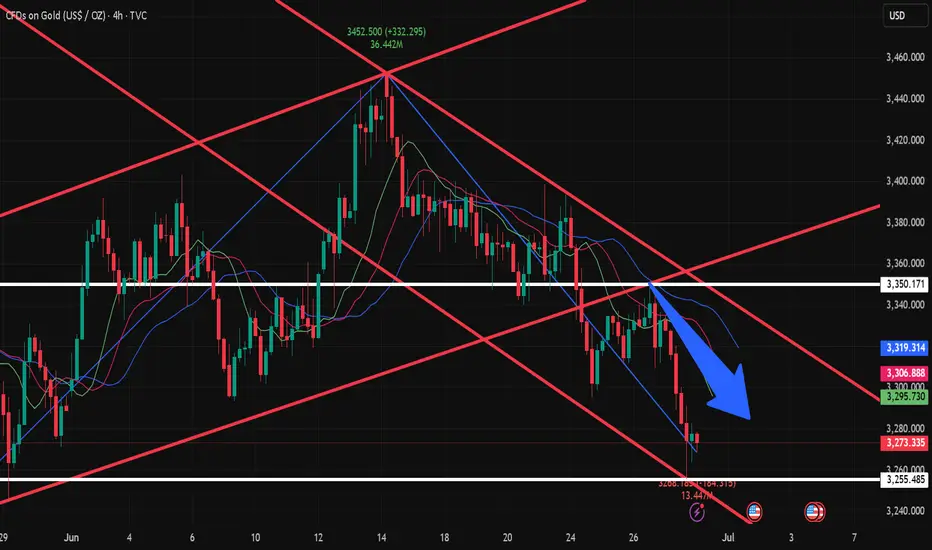
I. Gold’s Structural Landscape on the 4-Hour Chart
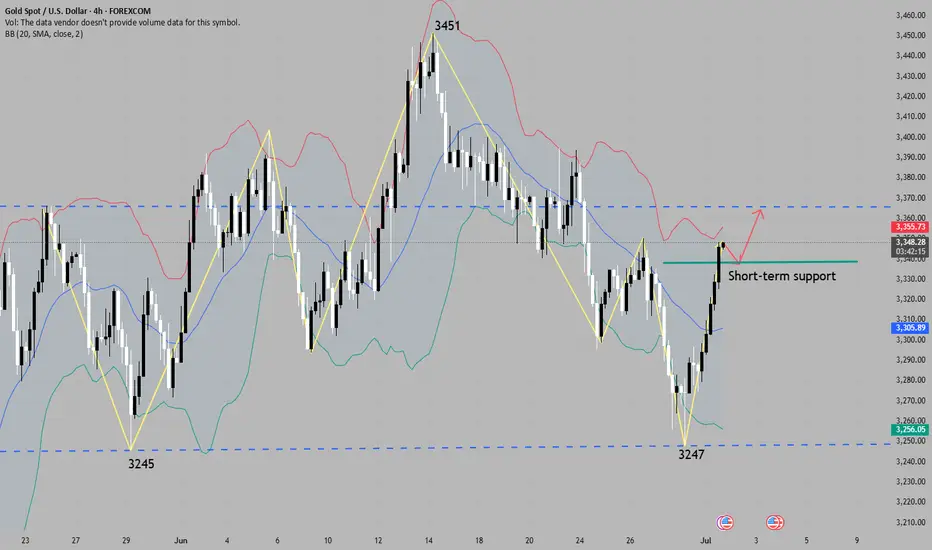
The four-hour chart reveals a textbook bullish trend. Beginning with a significant impulse from the $3194 base, gold has climbed steadily, printing higher highs and higher lows. The most recent break of structure (BOS) above $3312 confirmed the continuation of bullish intent, while the market remains firmly above key swing lows — signaling that the bullish regime has not yet been invalidated.
Price action shows clean, impulsive expansions followed by short consolidations, with buyers continuing to absorb supply at every retracement. Despite that strength, gold has now reached a potential exhaustion point, with the price reacting to overhead supply at $3345–3355, forming what could be an early-stage distribution zone.
Key Market Structure Developments:
BOS at $3312: confirms uptrend
No CHoCH (Change of Character) yet — no confirmed bearish reversal
Clean liquidity grab above $3345, followed by rejection — hinting at short-term profit-taking or internal bearish intent
II. The Fibonacci Grid: Retracement and Extension Zones
Applying Fibonacci retracement from the $3194 swing low to the $3345 high offers crucial levels of interest. The golden ratio at 61.8% ($3253) aligns perfectly with prior demand and a 4-hour bullish order block. Similarly, the 38.2% level at $3285 corresponds with a minor liquidity pool and potential reaccumulation base.
Fibonacci Level Price
23.6% $3308
38.2% $3285
50.0% $3269
61.8% $3253
78.6% $3228
On the extension side, should gold resume its rally beyond $3345, projected Fibonacci targets sit at $3372 (127.2%) and $3410 (161.8%), with both acting as measured projections for trend continuation.
III. Supply and Demand: Mapping Institutional Footprints
Institutional activity is best observed through unmitigated supply and demand zones — areas where large orders caused rapid price displacement. Gold currently trades between two such zones:
Demand Zone: $3250–$3260 — a sharp bullish rejection occurred here on the last visit, indicating strong buy-side interest and likely pending buy orders
Supply Zone: $3345–$3355 — where a sell-side liquidity grab recently occurred, followed by a strong rejection candle
These two zones bracket the market and serve as the highest probability areas for future reactions.
IV. The Smart Money Concepts (SMC) Framework
SMC theory revolves around observing the footprints of large market participants — often labeled “smart money.” In gold’s current structure, SMC tools provide a clearer roadmap than standard indicators.
Current Observations:
Break of Structure (BOS): Confirmed at $3312 (bullish continuation)
Change of Character (CHoCH): Absent (bull trend intact)
Buy-Side Liquidity Grab: Above $3345 — trapped breakout buyers likely fuel for reversal
Sell-Side Liquidity Pool: Uncollected beneath $3280 — probable magnet for a liquidity sweep
Fair Value Gap (FVG): Between $3260 and $3280 — price inefficiency offering high-probability reentry for smart money
Bullish Order Block (OB): At $3250–$3260 — final down candle before explosive up move, unmitigated
All these elements point to a high-probability pullback, rather than a full-blown reversal. Until structure is broken with a CHoCH, the base case remains bullish.
V. High-Probability Levels for 4-Hour-Based Opportunities
From this framework, we identify the following key price levels:
The highest-probability reaction is expected at $3250–$3260, where smart money is likely to re-engage if price retraces.
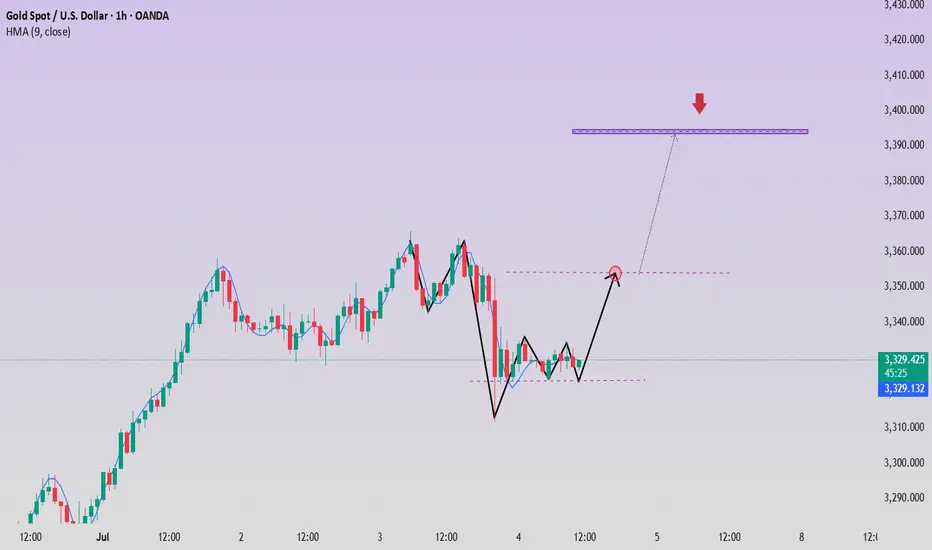
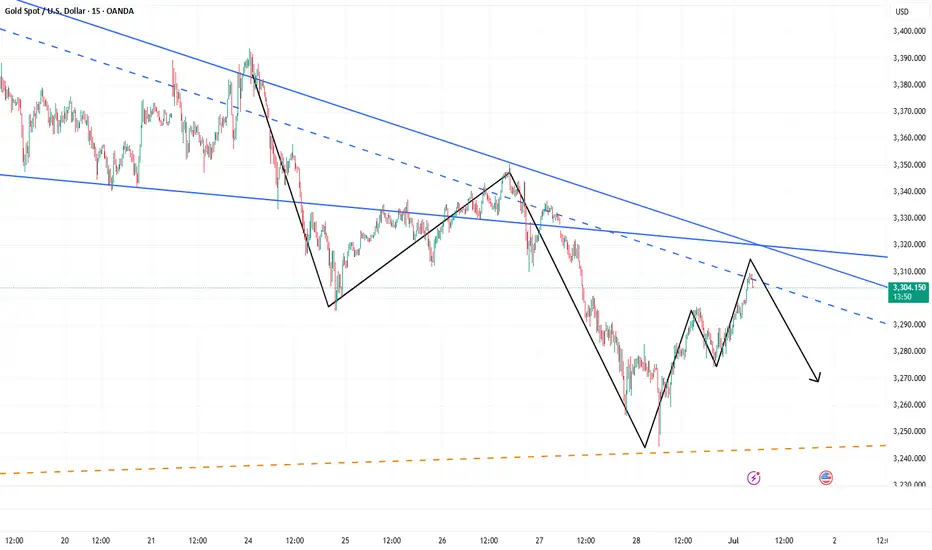
VI. Refinement on the 1-Hour Chart: Intraday Trade Setups
Zooming into the 1-hour chart allows us to fine-tune our execution strategy. Gold is consolidating just below $3330, forming what appears to be an ascending triangle — a common bullish continuation structure — but within the broader context of a possible short-term pullback.
Intraday Trade Idea #1 — High-Conviction Long
Entry: $3260
Stop-Loss: $3245
Take-Profit 1: $3308
Take-Profit 2: $3340
Risk–Reward: ~1:4
Rationale: Aligned with 4H demand, fair value gap, OB, and golden ratio retracement. Structure remains bullish.
Intraday Trade Idea #2 — Speculative Short (Low Conviction)
Entry: $3340–$3350
Stop-Loss: $3362
TP1: $3305
TP2: $3285
Risk–Reward: ~1:2.5
Rationale: Countertrend, only viable if bearish rejection candle forms. Not aligned with dominant 4H structure.
VII. The Golden Setup: Long from Demand + FVG Confluence
Among all technical configurations, the long setup at $3260 emerges as the most compelling. It is supported by:
An unmitigated bullish order block
A clear fair value gap
61.8% Fibonacci retracement
Untouched sell-side liquidity below
Directional alignment with trend
Institutional demand pattern
This setup offers both superior risk-to-reward and a technical foundation that aligns with Smart Money’s modus operandi. It represents a low-risk, high-reward opportunity for traders who wait for price to re-enter the value zone and confirm with bullish order flow (e.g., a bullish engulfing or BOS on 15m).
VIII. Final Thoughts and Tactical Summary
As of July 1, 2025, the gold market reflects strong bullish momentum, albeit entering a corrective phase that should not be mistaken for reversal. While intraday volatility and range compression may tempt countertrend trades, the smartest play remains to wait for a discounted reentry into a zone of value.
Until structure shifts significantly, the dominant trading thesis remains: “Buy the dip into institutional zones”. Patience, not aggression, will separate the retail trader from the professional in today’s complex market structure.
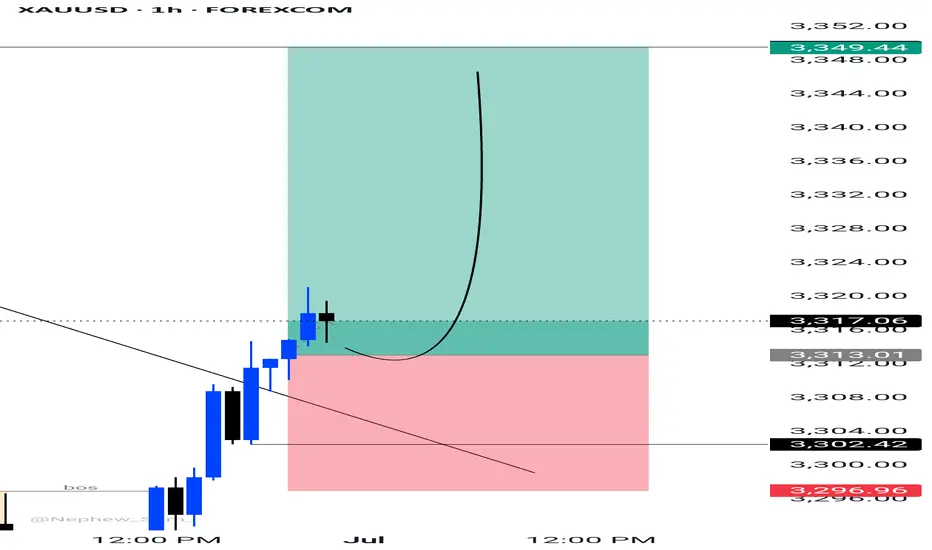
XAUUSD H1 Outlook XAUUSD 45M 🚀
Trendline broken — bulls in control!
Above 3317, aiming for 3349+
SL: 3296 🔒 | TP: 3350 🎯
Stay sharp, lock profits! ⚡️✨
GOLD XAUUSD THE month of july 1 Key Economic Outlook ;
Central Bank Speeches
(1)The bank of England head (BOE) Gov Bailey might speak in context on BOE 4.25% rate cut ,uk inflation about 3.45% is still above limit and the goal is 2%.my focus will be on his rhetoric's ,if he sounds dovish or Hawkish tones, then GBP will react to the sentiment.
(2)Bank of japan (BOJ) Gov Ueda will center on rate held steady at 0.5% and core inflation remains above 2%,market will watch the sentiment because its likely he will address yield -curve control adjustments or hawkish signals , which will potentially boost JPY AND JP10Y
the head of united states Fed reserve Chair, sir! Powell will speak and it comes with red folder ,the last monetary policy meeting kept Fed funds rate at 4.25–4.50% ,Powell recently emphasized patience on rate cuts based on cautious wait and see approach
Key Messages Expected:
Tariff-driven inflation risks require vigilance.
Rate cuts unlikely until September unless inflation cools markedly.
"No urgency" to ease policy amid solid labor market.
US Economic Data Releases
Final Manufacturing PMI 52.0 52.0 Neutral if unchanged; USD positive if >52.0.
ISM Manufacturing PMI 48.8 48.5 Contractionary (<50); USD negative if <48.5.
JOLTS Job Openings 7.32M 7.39M USD negative if <7.32M (labor cooling).
ISM Manufacturing Prices 69.6 69.4 USD positive if >69.6 (inflationary pressure).
Construction Spending -0.2% -0.4% Limited impact unless significantly below forecast.
Market Implications
USD: Powell’s tone is critical. Hawkish remarks (delayed cuts) could lift DXY; dovish hints may weaken it. Data surprises (especially ISM/JOLTS) could amplify volatility.
GBP/JPY: Bailey/Ueda speeches may drive cross-pairs. BOJ hawkishness could weaken EUR/JPY carry trades.
Risk Assets: Weak ISM/JOLTS data may pressure equities (US30) and boost bonds (↓US10Y).
Summary of Key Risks
Powell Speech: Reiteration of "no imminent cuts" likely. Watch for tariff-inflation warnings.
ISM/JOLTS: Sustained manufacturing contraction or softer labor demand could fuel recession fears.
Carry Trades: JPY strength (Ueda) may pressure EUR/JPY/AUD if BOJ signals policy shift.
#gold #xauusd #gbp #jpy

Continue to short gold below 3300Continue to short gold below 3300
Gold prices fell to a four-week low, but rebounded slightly
Spot gold: Today's lowest hit $3247/oz (the lowest since May 29), and then rebounded to $3296/oz.
Risk aversion cooled, trade easing suppressed gold prices
US-China trade easing: China and the United States reached an agreement on rare earth exports, boosting the stock market (S&P 500 and Nasdaq hit new highs), weakening the safe-haven demand for gold.
G7 tax agreement: Reduce global policy uncertainty, further suppress gold prices.
Trump terminated trade negotiations with Canada and threatened to impose tariffs, which temporarily boosted risk aversion.
Expectations of a Fed rate cut have increased, but short-term hawkish remarks have brought pressure
The market expects a 92.5% probability of a rate cut in September (65-75 basis points for the whole year), but Powell said that the impact of tariffs needs to be waited and see, and the probability of a rate cut in July is only 20%.
Trump said he would appoint a Fed chair who is "willing to cut rates," adding to policy uncertainty.
Geopolitical risks remain
Iran situation: Trump's threat to "bomb Iran again" and abandon sanctions relief has temporarily supported gold prices.
The Russian-Ukrainian conflict continues, but the market has partially digested the risk.
Key technical support and resistance levels
Support:
$3,250 (
$3,200 (if broken, it may fall to $3,120)
Resistance:
$3,280-3,290 (4-hour chart head and shoulders neckline).
$3,306-3,322 (if broken, it may rebound further).
Downside risks:
Trade optimism (US-China trade war, G7 agreement) may continue to suppress safe-haven demand.
If non-farm payrolls are strong this week (released on Thursday), it may push up the dollar and further suppress gold prices.
Upside support:
Geopolitical risks (Iran, Russia-Ukraine conflict) may trigger safe-haven buying.
Fed rate cut expectations still provide long-term support for gold.
Key variables:
July 9 The deadline for US tariff negotiations is on July 15. If no consensus is reached, it may trigger risk aversion in the market.
Fed policy signal: If economic data is weak, expectations of rate cuts may drive gold prices back up.
Technical pattern:
If gold prices hold $3,250, it may rebound to $3,330-3,350.
If it falls below $3,250/3,200, it may fall to $3,120.
Short-term traders: Pay attention to the breakthrough of the $3245-3280 range. If it rebounds to around $3,300, you can consider shorting on rallies. If it falls below $3,245, it may accelerate downward.
How to grasp the key entry opportunity in the gold market?The market is changing rapidly, and going with the trend is the kingly way. When the trend comes, just do it. Don't buy at the bottom against the trend, so as not to suffer. Remember not to act on impulse when trading. The market is good at dealing with all kinds of dissatisfaction, so you must not hold on to orders. I believe many people have experienced this deeply. The more you resist, the more panic you will feel, and your floating losses will continue to magnify. You will not be able to eat or sleep well, and you will miss many opportunities in vain. If you also have these troubles, then you might as well keep up with my pace and try to see if it can make you suddenly enlightened.
The non-agricultural data was unexpectedly cold, with a large negative impact. The stochastic indicator in the daily chart formed a golden cross, which was a main multi-signal. The BOLL range shrank, and the range shrank to 3418-3280. This range is the main range. The price pierced up and down the central axis and hovered, waiting for the news data to stimulate. The upper track of the 4-hour Bollinger band is at $3380, and the integer mark of $3400 is also near the high point of gold prices last week. The 5-day moving average and the MACD indicator cross upward, and the KDJ and RSI indicators cross upward. In the short-term technical aspect, gold has a trend of further rebound. At present, the upper resistance is at 3360-3365, and the support position is around 3310-3300.
Gold operation strategy: It is recommended to go long near 3312-3315, with a target of 3330-3340. It is recommended to go short once it touches 3340 for the first time, with a target of 3320-3310.
Gold fluctuates during the day, short-term profits will be left
📌Main driving events of gold
The big non-agricultural data in the United States caused the gold price to fall by almost 40 US dollars in one breath, but after a short emotional storm, the market returned to calm. Today's market began to bottom out and rise. As of now, the non-agricultural market has been backed by 50%, and the energy of the shorts has been basically digested. Next, the bulls will start to exert their strength! Today's direction is still the same and continue to be bullish!
📊Comment analysis
In the US market, the gold price rebounded after the decline and the bottom of the second retracement appeared. The support level is 3322. After a night of fluctuations, gold has begun to rise, and the low point has begun to rise. The key point of the day is still 3323. In the morning, we wait for the gold price to fall back to around 3323 and we will buy the bottom and go long. We don’t expect to surpass yesterday’s high point during the day, but at least it will go to 3350!
💰Strategy Package
Long position:
Gold long at 3322-3327, stop loss 3315, target 3350-3360
⭐️ Note: Labaron hopes that traders can properly manage their funds
- Choose the number of lots that matches your funds
Xauusdt
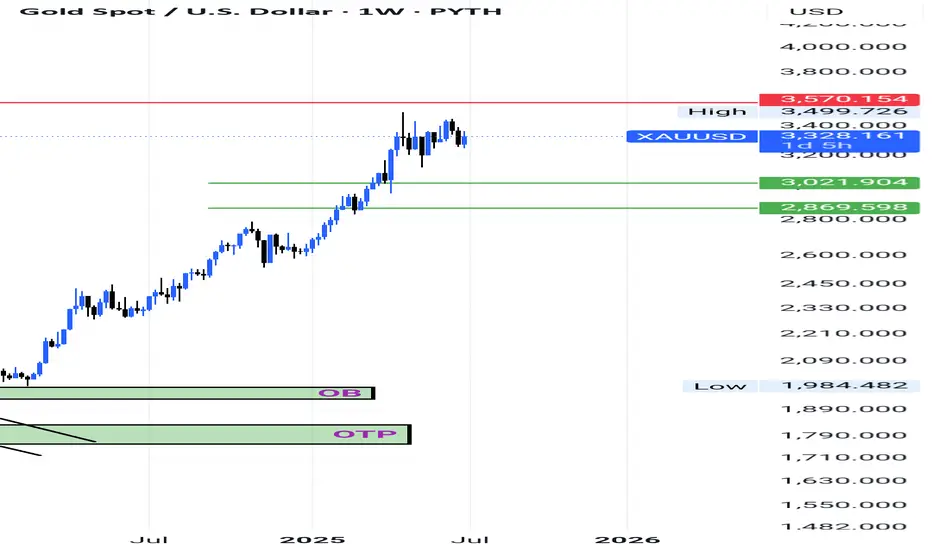
"Gold may have another upward move toward the red zone, and from there, considering the RD_ divergence, it could reach the green lines which indicate potential support. This analysis was conducted on the weekly timeframe. Please share your thoughts in the comments. Thank you
GOLD 2HOURS BEARISH ANALYSIS Market may be going to sell side. the also has lines and.lable to help traders anderstand the market.
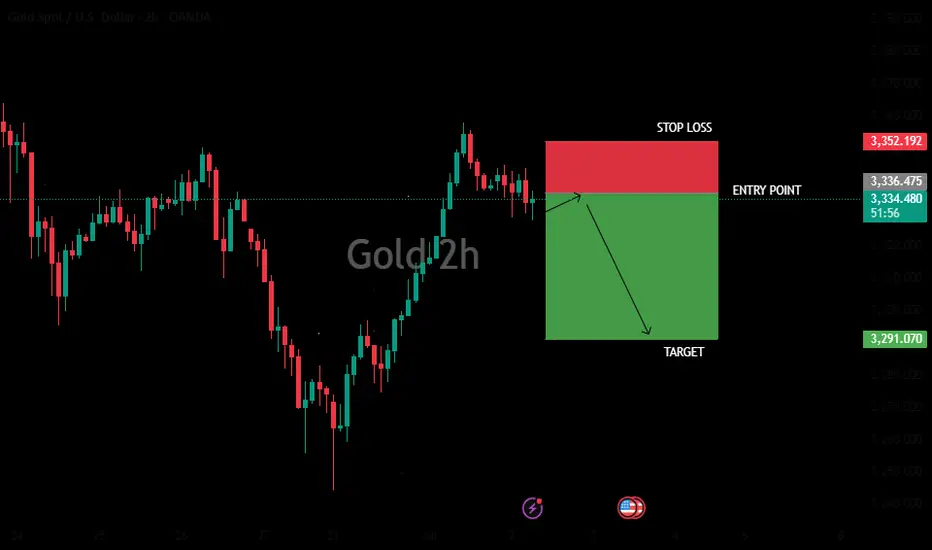
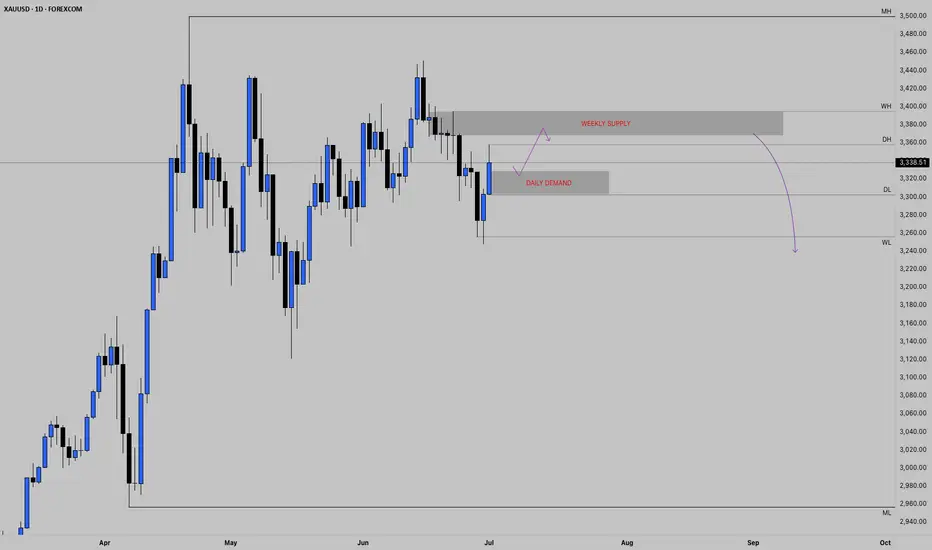
A LITTLE MORE RALLY?After price closed strong bearing the previous week, we have witnessed a massive rally back up into weekly highs. Even after 2 days of rally, this strong bullish pressure doesn't seem to be over looking at today's strong daily closure. We might just see price extend a little further into weekly highs as shown and now based on strong confirmations, a plunge back down into April's lows.
A continuation of the rally may be seen after price taps into the current daily demand region as indicated on the chart. Fingers crossed for confirmations
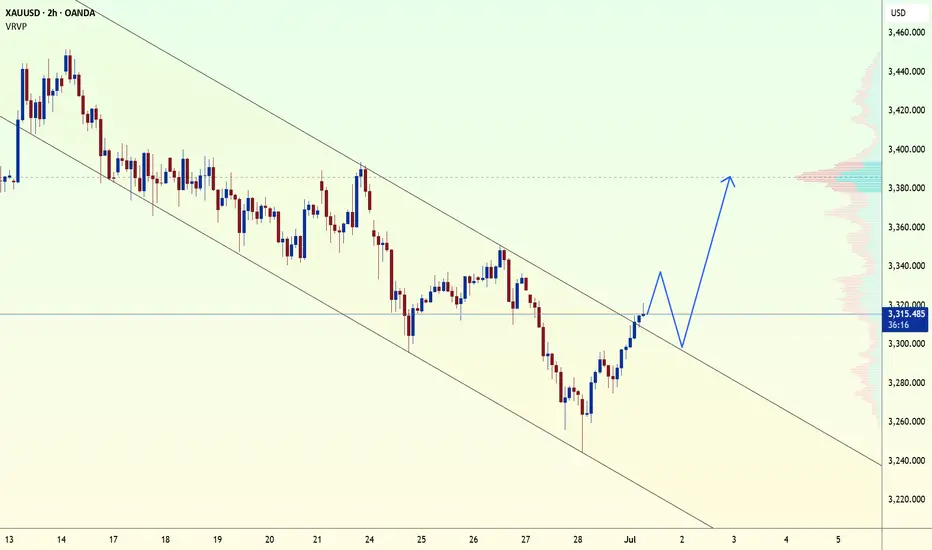
Gold Trading Strategy for 500 Pips !Dear friends!
The exit from the bearish channel has led to an impressive price increase. At the time of writing, the financial market is trading above the $3,300 mark. The uptrend is very strong as it consolidates at high levels with stable trading activity on the 2-hour time frame.
Therefore, the upcoming reports on US employment and manufacturing are highly anticipated. This has contributed to the market being hotter than ever. The price increase is expected to reach $3,385, if the Fed signals monetary policy easing. What do you think about this? Do you agree with me?
Gold is in the Bearish DirectionHello Traders
In This Chart GOLD HOURLY Forex Forecast By FOREX PLANET
today Gold analysis 👆
🟢This Chart includes_ (GOLD market update)
🟢What is The Next Opportunity on GOLD Market
🟢how to Enter to the Valid Entry With Assurance Profit
This CHART is For Trader's that Want to Improve Their Technical Analysis Skills and Their Trading By Understanding How To Analyze The Market Using Multiple Timeframes and Understanding The Bigger Picture on the Charts
GOLD SELL SETUPWe have officially gotten a change of trend as proven by the transition from a sequence of higher highs and higher lows to a lower low and lower high. Stacked on top of this sequence is a pullback for a retest of a key level confirming our setup.
GOLD - High placed? Short now?#GOLD... market placed 3362-64 after our last idea regarding gold buying.
And market behaved indicate us that that is a final high for now and below that a dip can be possible.
So keep close and don't buy until market holds..
Good luck
Trade wisely
Gold is unilaterally upward during the dayGold, the general trend is as described in the morning analysis. The price fell from the 3452 high point in this round. On Monday, it rebounded quickly after parallel attack and defense near 3245. The article emphasizes that the short-term strength will continue. The high point of the week may appear around Thursday's non-agricultural data. The medium-term top idea of 3500-3452 is still maintained;
It actually opened unilaterally upward from 3303 during the day and is now reported at 3340; the bullish pattern of each cycle is good, and there will be a high in the evening; short-term support is 3338, strong support is 3332; short-term resistance is 3350-3356, strong resistance is 3365-3374;
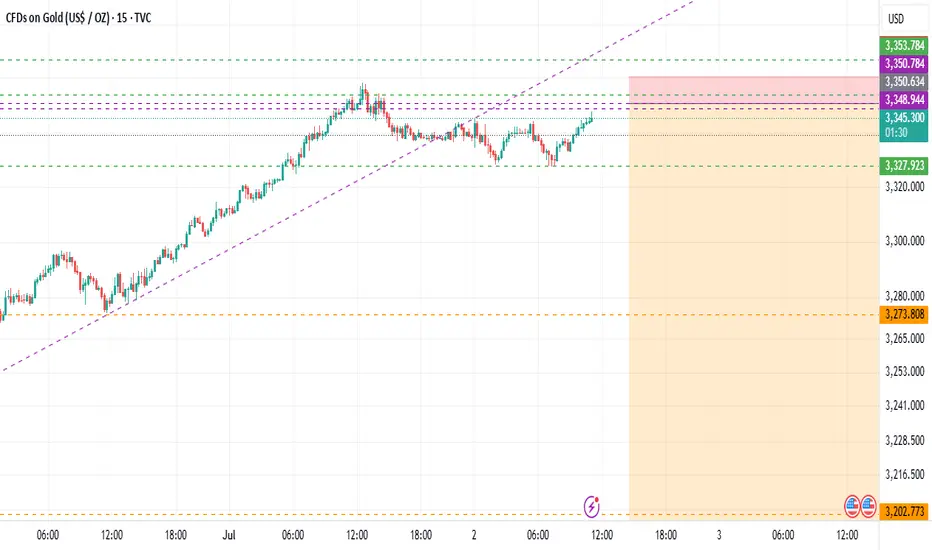
GOLD 15M BEARS ARE READY FOR MORE CORRECTION I have pending SELL @ 3350
My target for this is 3202 which could be very good area to buy with confirmation of the BULL CANDLES
Thanks
GOLD - it's breakout? What's next??#GOLD... perfect move as per our last analysis and now market just broke his current resistance area that was 3348-49 and 3353-54
So keep close and if market hold these areas then upside further bounce expected.
Good luck
Trade wisely
Gold encounters resistance at 3310-3320 and is about to fallAt present, gold has reached the 3300-3320 area as expected. As I mentioned in my previous article, we can consider shorting gold in batches in the 3300-3320 area;
Although gold once rebounded and stood above 3300, we can clearly see that when facing the short-term resistance area of 3310-3320, the bullish energy of gold has converged and began to show signs of stagflation, so the short-term resistance area of 3310-3320 is still valid.
Before gold breaks through 3310-3320, gold bears still have the upper hand. So as long as gold stays below 3310-3320 in the short term, don't be afraid of gold rebounds. Rebounds are opportunities to short gold. So I still tend to short gold at present, and have opened short gold positions according to the trading plan, hoping that gold can retreat to the target area: 3285-3275-3265. Do you think gold will fall as expected?
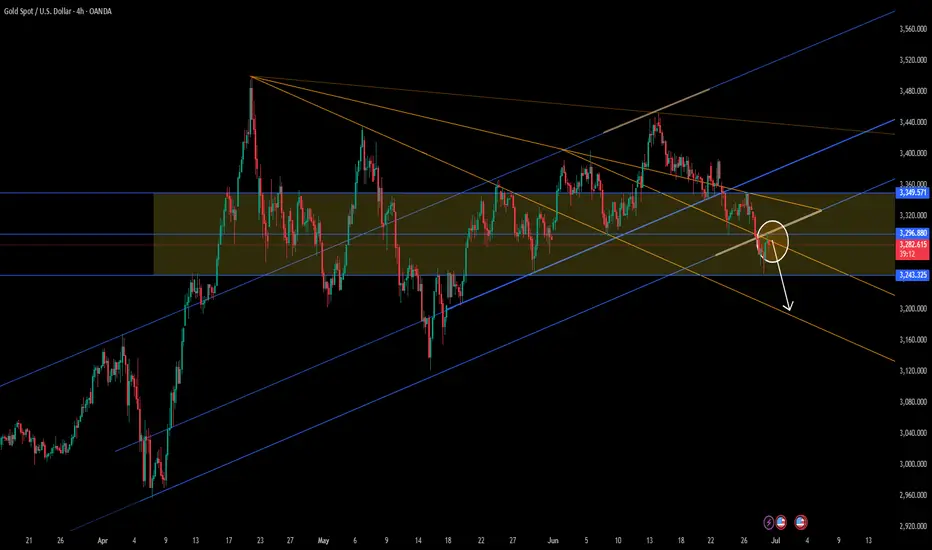
Next week's market trend analysisShort-term technical analysis of gold next week:
After gold was horizontally consolidated below 3400, it had two relatively large retracements. The short-term downward channel, the upper edge of the channel is currently around 3340, which is also the turning point of the short-term long and short cycles that we need to pay attention to later.
Has the current big rhythm entered a weak position?
Daily level analysis: After reaching 3500, gold is still in a trend of high-level consolidation, and there is a periodic switch between long and short positions, and there is no extremely strong or weak rhythm. In this consolidation process, there are two relatively large retracements: the first from 3500 to 3200 space 300 points, the second from 3435 to 3120 space 315 points. In other words, in the current daily level cycle, the maximum decline is around 300 US dollars. Not exceeding this maximum retracement value, to a certain extent, it is still in the rhythm of high-level correction. According to the range of this space retracement, the limit of the daily retracement is around 3150, with an error of about 20 points. However, the daily range is large, so it is too early to talk about this threshold.
At present, the short-term pressure points of 0.618 and the top and bottom structures are all around 3300. Another point for everyone to pay attention to: in the market with a small cycle of negative decline, once there is a sideways trend. Don't take it as support! The price is consolidating horizontally, which only means that the current bulls are weak in pulling back and the change of weakness must be a strong pullback to break through the big negative. Similarly, the slow rise market is the same.
The first support below in the short term is around 3250. The strong support is at the integer level of 3200. Once this position is reached, it will become a repeated test position like 3400.
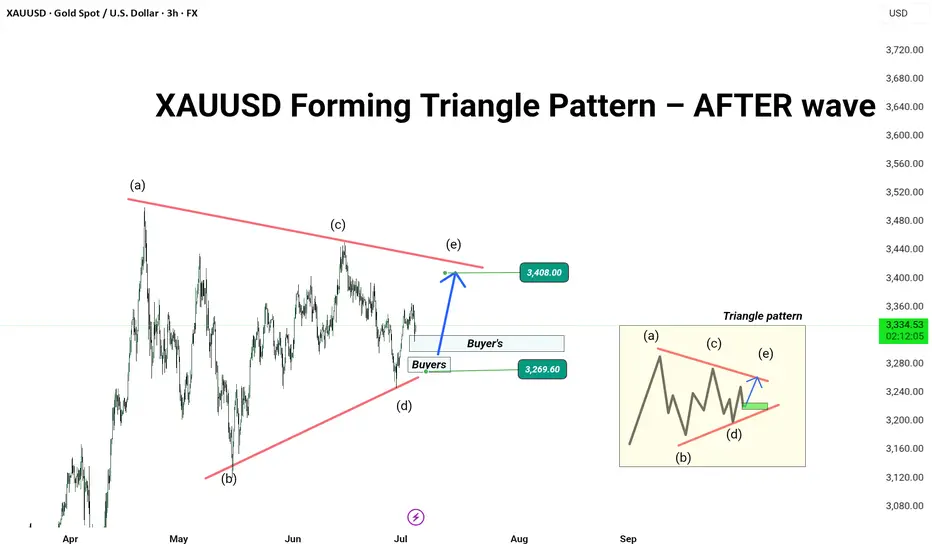
XAUUSD Forming Triangle Pattern – Eyeing Breakout After Wave (e)🚨 Gold (XAUUSD) Technical Analysis – 3H Chart
Gold is currently forming a classic contracting triangle pattern (ABCDE), with wave (e) in progress. Price is bouncing from a strong buyers’ zone near 3269.60, showing signs of upward pressure.
📊 Current Structure:
Wave count: (a)-(b)-(c)-(d)-(e)
Consolidation within a symmetrical triangle
Key support: 3269.60
Resistance zone to watch: 3408.00
📈 Potential Scenario:
If price holds above the buyer’s zone, we can expect a bullish wave (e) push towards the upper trendline at 3408, potentially leading to a breakout continuation.
📍 Trade Plan (Educational Purpose):
Long Setup Valid Above: 3269.60
Target: 3408.00
Stop Loss (SL): Below 3260 (based on your risk profile)
---
🧠 Why This Matters?
This triangle setup often leads to strong breakout moves, especially in commodities like gold during fundamental uncertainty or dollar index shifts. The market is compressing — be prepared for the breakout move.
---
📢 Follow for more clean Elliott Wave + Price Action setups!
💬 Drop your analysis in the comments. Let’s grow together!
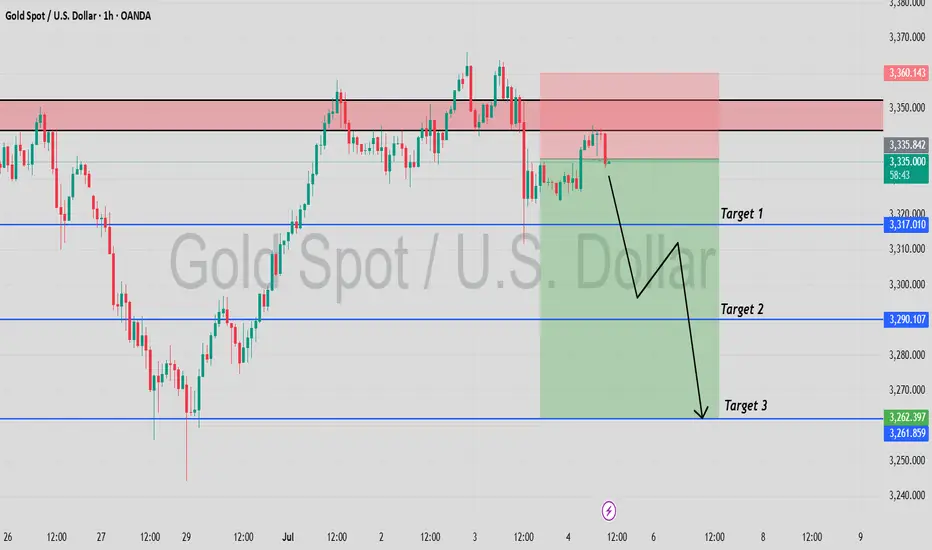
Continue to maintain the rhythm of short tradingUnder the influence of NFP, gold fell sharply as expected. What I had suggested before was proven correct by the market again. "Gold rose in advance to reserve room for the NFP market to fall." After NFP, gold fell to around 3311 and the decline narrowed. Therefore, we accurately seized the opportunity to go long on gold near 3312 and set TP: 3330. Obviously, gold successfully hit TP during the rebound and made an easy profit of 180 pips.
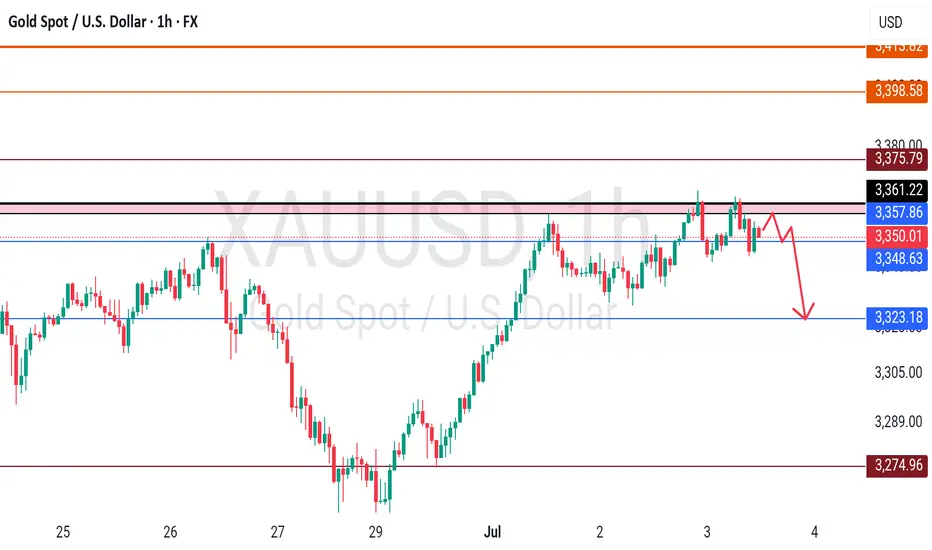
From the current gold structure, gold encountered resistance and retreated twice near 3365, and built a double top structure in the short-term structure. In order to eliminate the suppression of the double top structure, gold still needs to continue to fall after the rebound. After the cliff-like decline of gold, the short-term resistance is in the 3340-3345 area, and the short-term support below is in the 3320-3310 area.
So I think that gold can still continue to short gold after the rebound, and I have already shorted gold around 3336 with the 3340-3345 area as resistance. Now we just need to wait patiently for gold to hit TP. Let us wait and see!
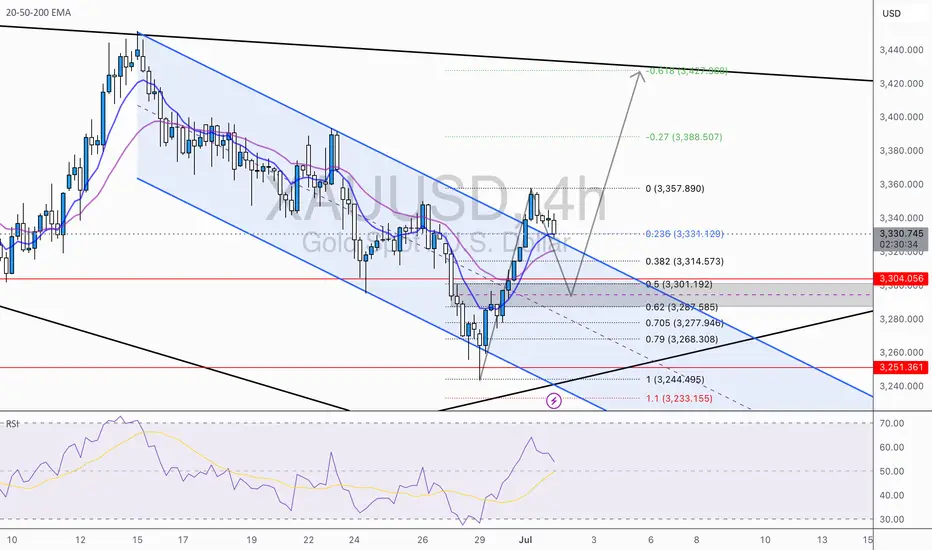
XAU/USD 4H – Retracement or Rejection? Key Levels to WatchGold bulls made a strong push out of the descending channel, but now the real test begins. The market is currently in retracement mode after a sharp impulse, and the next move will be decisive.
🔹 Channel Breakout & Retest in Play:
Price broke out of the descending channel with momentum and hit the $3,357 region before pulling back. We're now hovering around the 0.236 Fib at $3,331 — with the 0.382 and 0.618 Fib zones below offering potential long entry confluence.
🔹 Fibonacci Cluster Support Zone:
Between $3,314 – $3,287 lies a high-probability demand zone, where multiple Fibonacci levels converge with the broken channel top. This area also aligns with the 50 EMA, creating a pocket for bullish continuation — if held.
🔹 RSI Divergence to Watch:
RSI shows signs of slowing bullish momentum after peaking, which suggests this retracement could deepen toward the 0.5–0.618 levels before any meaningful bounce. A bullish RSI reversal in this zone would confirm re-entry.
📌 Scenario 1 – Bullish Continuation:
Price finds support between $3,314–$3,287
Momentum kicks in for a leg up toward $3,388
Final TP at $3,427 (Fib -0.618 extension)
📌 Scenario 2 – Rejection and Deeper Drop:
Failure to hold the 0.5 zone flips the bias bearish
Watch for re-entry back into the previous channel
Next downside target: $3,251 and potentially $3,233–$3,221 (Fib + extension)
💡 Elite Insight:
The pullback is not the risk — entering without a plan is. This is the zone where patience meets precision. Let the levels do the work.
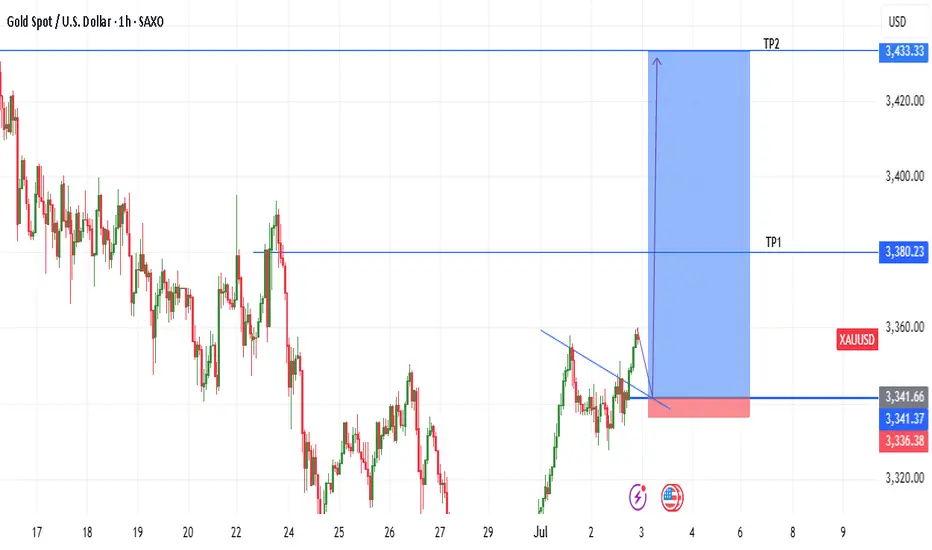
GOLD OUTLOOK FOR 3RD JUNE, 2025Gold is currently following a bullish structure on higher timeframes, such as weekly and Daily. I expect to go long from the 3340 level with a Stop Loss at 3336. First TP should be around 3380, and the final TP should be at 3433.