Market Manipulations. Bullish Trap (Smart Money Concepts SMC)
In the today's article, we will discuss how smart money manipulate the market with a bullish trap .
In simple words, a bullish trap is a FALSE bullish signal created by big players.
With a bullish trap, the smart money aims to:
1️⃣ Increase demand for an asset, encouraging the market participant to buy it.
2️⃣ Make sellers close their positions in a loss .
When a short position is closed, it is automatically BOUGHT by the market.
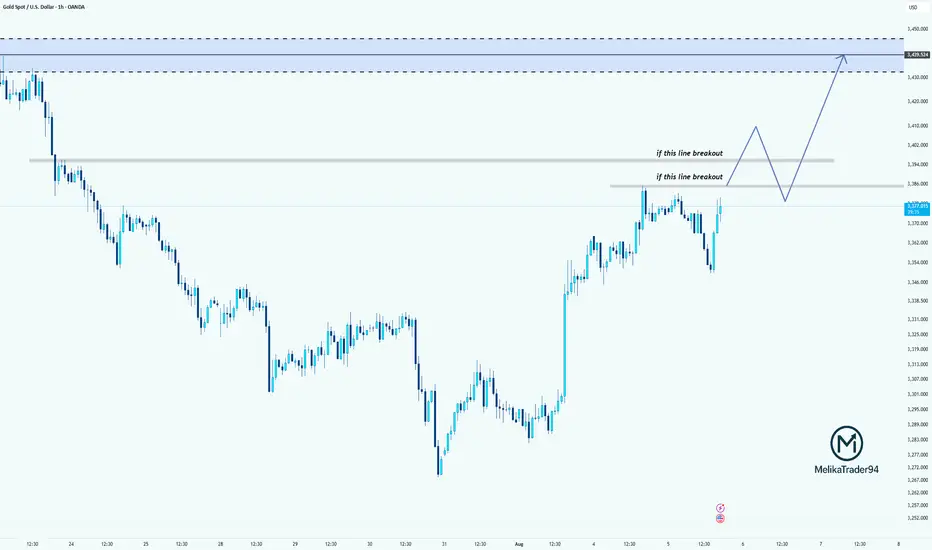
Take a look at a key horizontal resistance on AUDCHF.
Many times in the past, the market dropped from that.
For sellers, it is a perfect area to short from.
Bullish violation of the underlined zone make sellers close their position in a loss and attracts buyers.
Then the market suddenly starts falling heavily, revealing the presence of smart money.
Both the sellers and the buyers lose their money because of the manipulation.
There are 2 main reasons why the smart money manipulates the markets in a such a way:
1️⃣ - A big player is seeking to close a huge long position
When a long position is closed, it is automatically SOLD to the market.
In order to sell a huge position, smart money needs a counterpart who will buy their position.
Triggering stop losses of sellers and creating a false demand, smart money sell their position partially to the crowd.
2️⃣ - A big player wants to open a huge short position
But why the smart money can't just close their long position or open short without a manipulation?
A big sell order placed by the institutional trader, closing their long position, can have an impact on the price of the asset. If the sell order is large enough, it can push the price downward as sellers outnumber buyers. Smart money are trying to balance the supply and demand on the market, hiding their presence.
It is quite complicated for the newbies and even for experienced traders to recognize a bullish trap.
One of the efficient ways is to apply multiple time frame analysis and price action.
Remember, that most of the time bullish traps occur on key horizontal or vertical resistances.
After you see a breakout, analyze lower time frames.
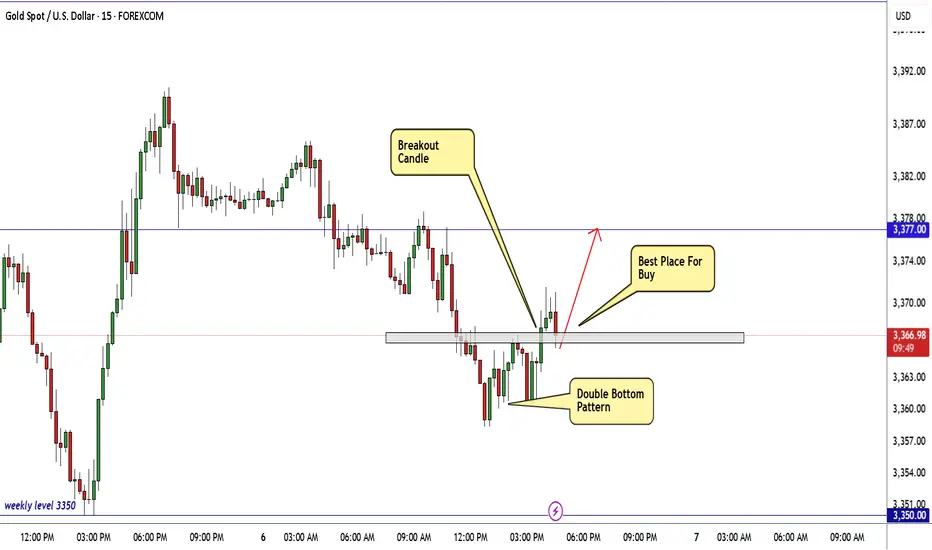
Quite often, after a breakout, the market starts ranging .
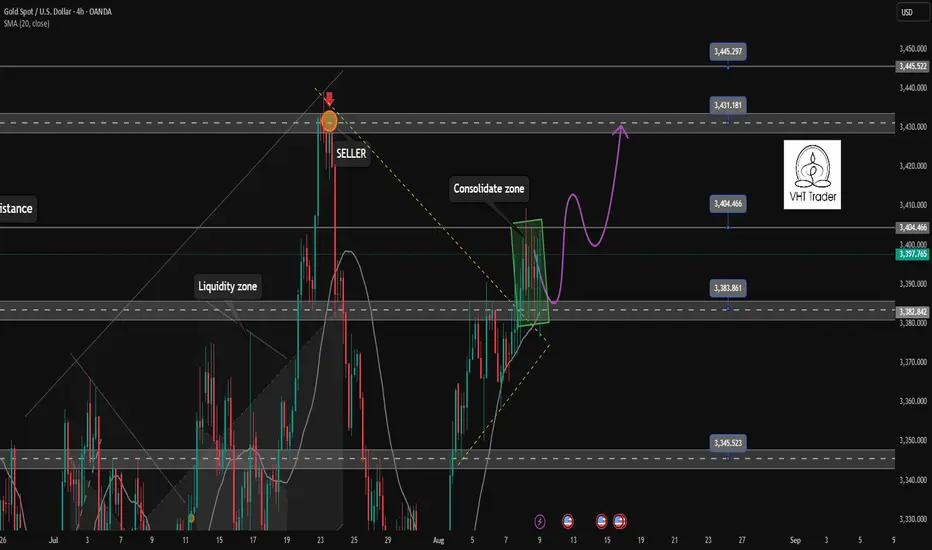
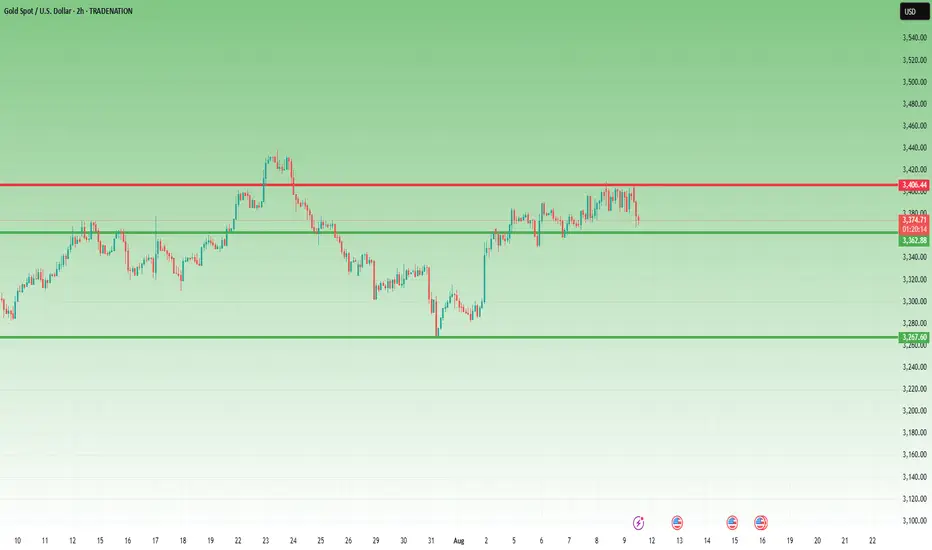
After a breakout of a key daily resistance, gold started to consolidate within a narrow range on an hourly time frame.
Bearish breakout of the support of the range will indicate a strength of the sellers and a highly probable bullish trap.
Remember, that you can not spot all the traps, and occasionally you will be fooled by smart money. However, with experience, you will learn to recognize common bullish traps.
❤️Please, support my work with like, thank you!❤️
I am part of Trade Nation's Influencer program and receive a monthly fee for using their TradingView charts in my analysis.
XAUUSD trade ideas

GOLD Struggles Near 3400 ResistanceGOLD Struggles Near 3400 Resistance
Gold is facing strong resistance around 3400, and the price is hesitating to take clear direction.
Although it looks like gold wants to move higher, selling pressure is holding it back. The price action is forming a wedge pattern, which typically signals a potential drop.
If this pattern plays out, gold could fall.
In my view, this bearish setup will only be invalidated by major market manipulation, because from a broader perspective, there’s no fresh technical or fundamental reason for gold to push higher despite that the bigger trend is bullish.
The real risk isn’t just technical or macro—it’s that gold remains one of the most manipulated assets in the market.
If the price breaks below the resistance zone shown on the chart, the chances of a deeper drop will increase.
Targets: 3350, 3330, and 3294
I'm still more focused on a bearish movement.
You may find more details in the chart!
Thank you and Good Luck!
PS: Please support with a like or comment if you find this analysis useful for your trading day

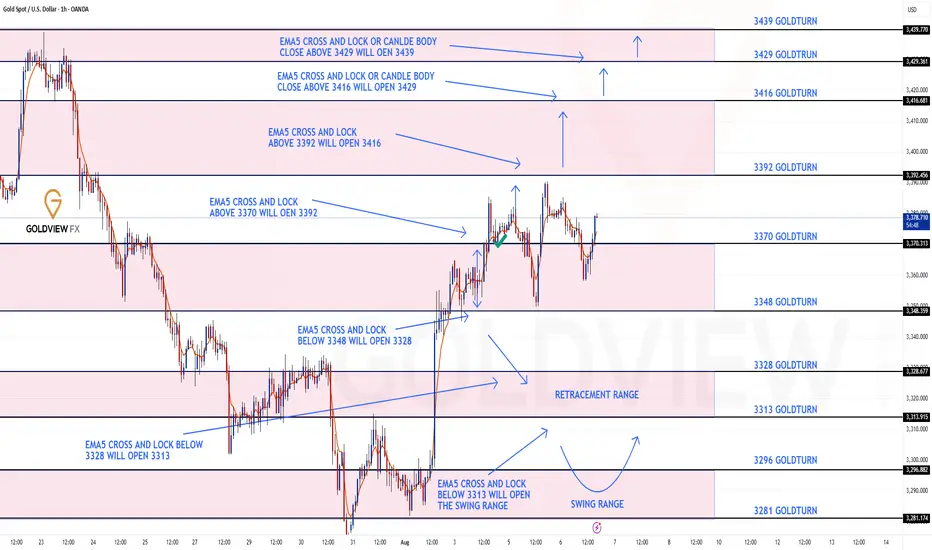
GOLD ROUTE MAP UPDATEHey Everyone,
Another great day in the markets with our chart idea playing out exactly as planned, allowing us to buy the dips.
We’re seeing a repeat of yesterday's setup, the 3392 gap remains open after the EMA5 lock above 3370. We're getting drops into the lower Goldturn zones, giving us great opportunities to buy back in.
As long as we don’t get a confirmed lock below 3348, we continue to chase the open gap above at 3392.
We will keep the above in mind when taking buys from dips. Our updated levels and weighted levels will allow us to track the movement down and then catch bounces up.
We will continue to buy dips using our support levels taking 20 to 40 pips. As stated before each of our level structures give 20 to 40 pip bounces, which is enough for a nice entry and exit. If you back test the levels we shared every week for the past 24 months, you can see how effectively they were used to trade with or against short/mid term swings and trends.
The swing range give bigger bounces then our weighted levels that's the difference between weighted levels and swing ranges.
BULLISH TARGET
3370 - DONE
EMA5 CROSS AND LOCK ABOVE 3370 WILL OPEN THE FOLLOWING BULLISH TARGETS
3392
EMA5 CROSS AND LOCK ABOVE 3392 WILL OPEN THE FOLLOWING BULLISH TARGET
3416
EMA5 CROSS AND LOCK ABOVE 3416 WILL OPEN THE FOLLOWING BULLISH TARGET
3429
EMA5 CROSS AND LOCK ABOVE 3429 WILL OPEN THE FOLLOWING BULLISH TARGET
3439
BEARISH TARGETS
3348
EMA5 CROSS AND LOCK BELOW 3348 WILL OPEN THE FOLLOWING BEARISH TARGET
3328
EMA5 CROSS AND LOCK BELOW 3328 WILL OPEN THE FOLLOWING BEARISH TARGET
3313
EMA5 CROSS AND LOCK BELOW 3313 WILL OPEN THE SWING RANGE
3296
3281
As always, we will keep you all updated with regular updates throughout the week and how we manage the active ideas and setups. Thank you all for your likes, comments and follows, we really appreciate it!
Mr Gold
GoldViewFX
Waiting for new confirmation after 6th day of accumulation✏️Last weekend with a trading day in the accumulation range. Early this week waiting for new momentum to break the accumulation range from 3385 and 3405 to trade on the winning side. When breaking the lower range, a corrective wave will be formed and then create increasing waves to ATH. If breaking the upper range of the accumulation model, buying force can completely push the gold price to approach ATH around 3445 soon.
📉 Key Levels
Support: 3383-3345
Resistance: 3404-3431-3445
BUY Trigger: Price rejection of the candle around support 3383
BUY Trigger: Break resistance 3405
Target 3445
SELL trigger Break and trading bellow 3383
Target 3345
Leave your comments on the idea. I am happy to read your views.
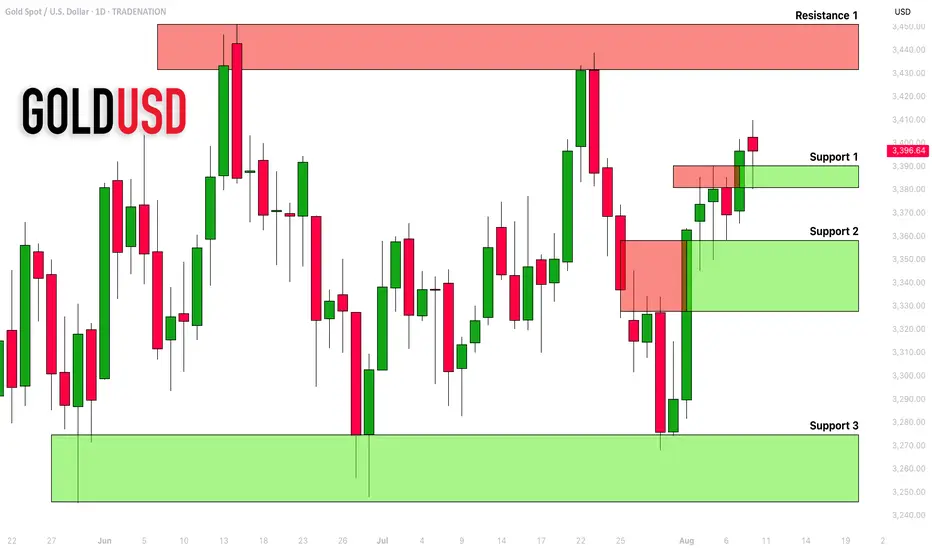
GOLD (XAUUSD): Support & Resistance Analysis For Next Week
Here is my latest support & resistance analysis for Gold
Support 1: 3380 - 3390 area
Support 2: 3327 - 3358 area
Support 3: 3246 - 3275 area
Resistance 1: 3431 - 3450 area
With a high probability, the market will continue rising to Resistance 1.
❤️Please, support my work with like, thank you!❤️
I am part of Trade Nation's Influencer program and receive a monthly fee for using their TradingView charts in my analysis.
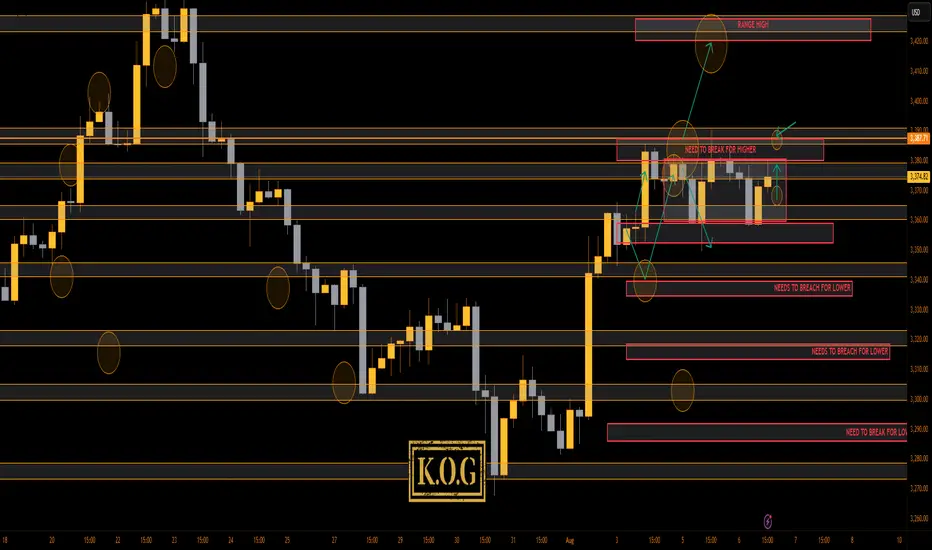
THE KOG REPORT - UpdateEnd of day update from us here at KOG:
As anticipated in the morning review, low volume day which resulted in this range still in play and price just making the sideways up and down move.
That's where we stand at the moment with no break above the red box for higher pricing at the moment. We managed to bag 3 decent set ups of 50pips each but we didn't get the move we wanted.
We have highlighted the key areas now and if you look closely on the hourly, we're in slight triangle formation. The range has also been drawn on the chart so we'll wait for the break out now.
Support here 3365, while resistance stands at the 3385 level.
Not much more to report on gold unless we break above that red box.
As always, trade safe.
KOG
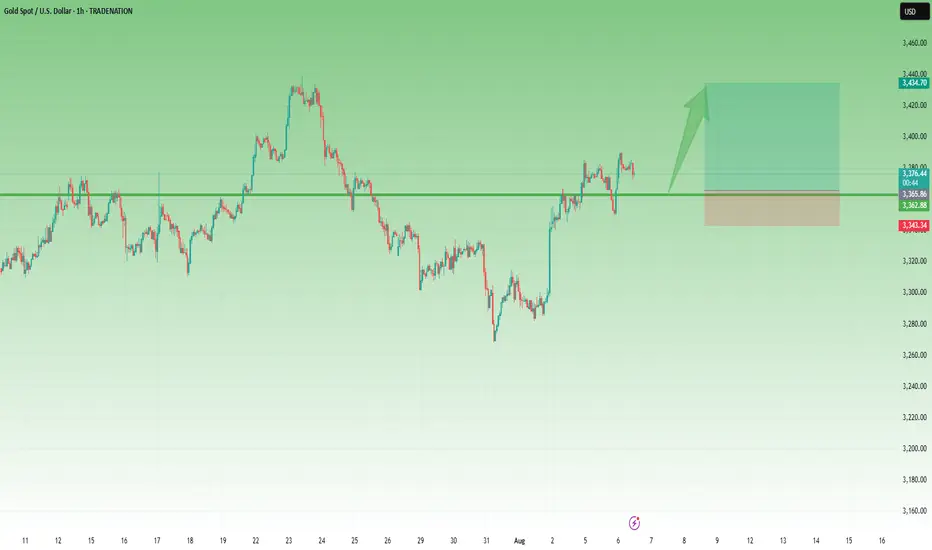
Breakout Levels in Focus for XAUUSDWhy did I say to cancel the last position? because gold is in the critical area!
Price is testing a key resistance area around 3374.
If it breaks above the first resistance level, we may see a bullish continuation toward the second breakout line.
If both levels are broken and retested successfully, the path toward the supply zone at 3430–3440 opens up.
Patience and confirmation are key here!
GOLD Ready To Go Up From Current Price , 150 Pips WaitingHere is My 15 Mins Gold Chart , and here is my opinion , we finally above 3365.00 and we have a 30 Mins Candle closure above it And Perfect Breakout , so we have a good confirmation now to can buy it and we can targeting 100 to 150 pips .
Reasons To Enter :
1- New Support Created .
2- Bullish Price Action .
3- Bigger T.F Giving Good Bullish P.A .
4- Clean Breakout .
5- Reversal Pattern .
XAUUSD - Drowning in RedHello everyone, what do you think about OANDA:XAUUSD ?
The other day, we discussed the movement of gold within the wedge pattern and the potential for it to test the 3350 USD support before bouncing back. That target was met, however, the sharp and sudden decline caused gold to lose its momentum momentarily.
Yesterday, gold dropped straight from 3398 USD to 3342 USD, a loss of more than 55 USD in less than a single session. The drop on Monday pushed the price of gold below a critical level. Moreover, the oscillators on the chart above are showing a bearish trend, supporting the scenario of further price decline.
The current support level is at 3350 USD, and price movement is following the Dow Theory. However, a convincing break below this level would act as a new trigger for bearish traders, potentially accelerating the decline towards the intermediate support at 3,315 USD, and then heading towards the round figure of 3,300 USD.
Do you think XAUUSD can bounce back from the 3350 USD support level? Feel free to share your thoughts!
GOLD NEXT MOVE (expecting a bearish move)(08-08-2025)Go through the analysis carefully and do trade accordingly.
Anup 'BIAS for the day (08-08-2025)
Current price- 3390
"if Price stays below 3400, then next target is 3380, 3355 and 3340 and above that 3420 and 3455 ".
-POSSIBILITY-1
Wait (as geopolitical situation are worsening )
-POSSIBILITY-2
Wait (as geopolitical situation are worsening)
Best of luck
Never risk more than 1% of principal to follow any position.
Support us by liking and sharing the post.
Range, Gaps, and Whipsaws: Gold Awaits Its Next Big MoveThe final days of last week have been frustrating for Gold traders, to say the least.
Starting Thursday, when the price tested the waters around 3400, we entered a range — but not a calm one. The moves inside this range were sharp and violent: a quick rally to 3400 followed by an equally quick drop to the 3380 zone, and so on.
Even the final hours of Friday mirrored this behaviour, with Gold dipping to 3380 only to recover and close the week near 3400.
The Asian open a few hours ago brought another twist — a gap above 3400 that was quickly filled, followed by continued downside in what could be described as a classic “gap and crap” scenario.
From a chart perspective, the bigger picture is still unclear. We do, however, have two critical levels to watch:
• 3365 → important support
• 3400 → key psychological resistance and technical level
Until we get a clear and decisive break above or below one of these zones, direction remains uncertain.
Personal plan:
• I would avoid trading an immediate breakdown below support today — in such a case, I’d prefer to wait for the daily close before committing.
• On the other hand, if price pushes back towards 3400, I suspect we might finally see a breakout, so I’ll be preparing for long positions in that scenario.
For now, a wait-and-see approach seems most prudent.
Disclosure: I am part of TradeNation's Influencer program and receive a monthly fee for using their TradingView charts in my analyses and educational articles.
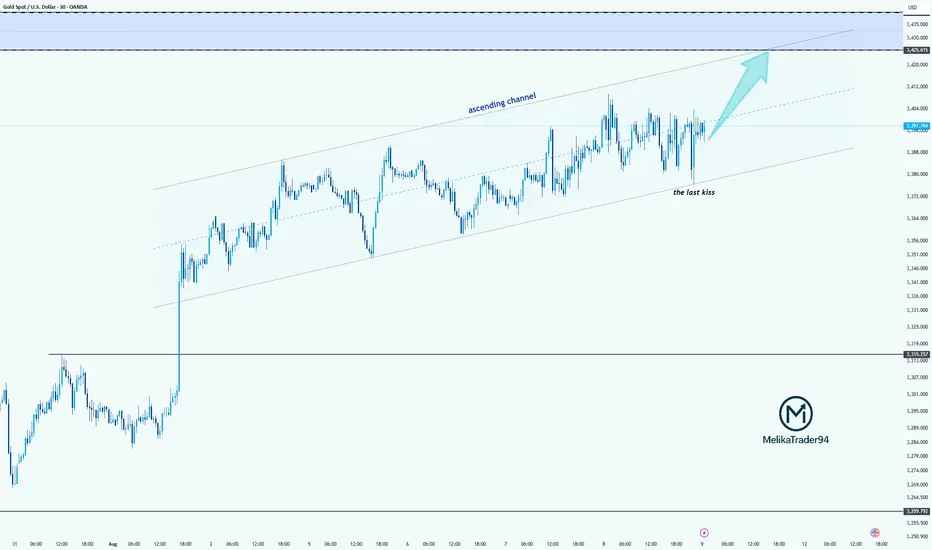
Gold (xauusd): still bullishHello guys!
Price is moving inside an ascending channel.
Recently bounced from mid-channel support (“last kiss”) and heading toward channel resistance.
Potential upside target: $3,435 zone.
As long as the price stays above mid-line support, bullish momentum remains intact.
XAUUSD – Bears Gave It a Shot, But Bulls Still in Control1. Quick recap of yesterday
In yesterday’s analysis, I highlighted the possibility of a short-term correction on Gold and noted that, although risky, a short trade could be justified. Acting on that conviction, I took a short with a sniper entry, capturing over 250 pips in floating profit. However, Gold found strong support around 3350 and reversed aggressively. I closed the trade with a more modest +140 pips gain.
2. Key development: NY session reversal
Despite early signs of weakness, the New York session flipped the script, sending Gold back toward the top of the daily range. The daily close near highs tells us one thing:
➡️ The bulls aren’t done just yet.
3. Technical outlook
• Resistance remains firm at 3375–3380+ zone
• A clear breakout above this zone opens the door for 3400+, with a likely magnet at 3430
• As long as the market holds above this week’s low, dips are buyable opportunities
4. Trading plan
For now, the bias shifts back to the long side. I’m watching for intraday dips to build longs, with invalidation below this week’s low. The structure favors continuation — but only if 3380 gives way we have confirmation.
5. Final thoughts
Gold may have teased the bears, but the real power still lies with the bulls. If momentum kicks in above 3380, we could be on our way to test 3430 soon. 🏹
Disclosure: I am part of TradeNation's Influencer program and receive a monthly fee for using their TradingView charts in my analyses and educational articles.
THE KOG REPORT - UpdateEnd of day update from us here at KOG:
Nice trade upside today from support which was shared yesterday. We managed to identify another set up on the indicators which performed well again on the long side but is not yet complete.
The bias levels given this morning have worked well at playing the range but we haven't managed to break above or below so unless scalping, we'll say wait for the break. End of the week tomorrow so lets hope we can breakout and make the move this wants to make.
Meanwhile, support 3370 and resistance 3395.
As always, trade safe.
KOG

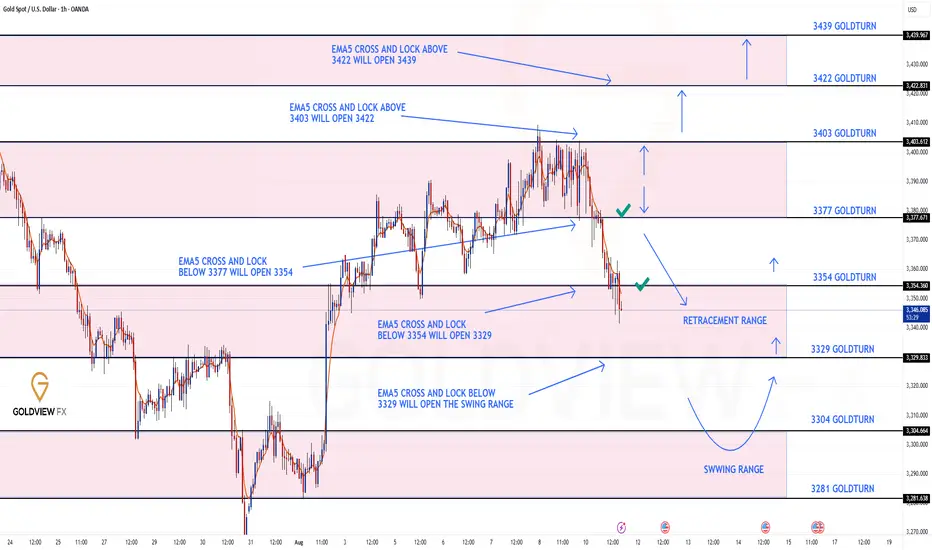
GOLD ROUTE MAP UPDATEHey everyone,
Following up on yesterday’s update for our 1H chart route map:
The key retracement range continued to provide support, and we saw the reactionary bounce we expected.
Right now, we’re range-bound between 3329 and 3354.
As long as 3329 holds, we can expect continued bounces, tracking the movement upward.
We will keep the above in mind when taking buys from dips. Our updated levels and weighted levels will allow us to track the movement down and then catch bounces up.
We will continue to buy dips using our support levels taking 20 to 40 pips. As stated before each of our level structures give 20 to 40 pip bounces, which is enough for a nice entry and exit. If you back test the levels we shared every week for the past 24 months, you can see how effectively they were used to trade with or against short/mid term swings and trends.
The swing range give bigger bounces then our weighted levels that's the difference between weighted levels and swing ranges.
BULLISH TARGET
3403
EMA5 CROSS AND LOCK ABOVE 3403 WILL OPEN THE FOLLOWING BULLISH TARGETS
3422
EMA5 CROSS AND LOCK ABOVE 3422 WILL OPEN THE FOLLOWING BULLISH TARGET
3439
BEARISH TARGETS
3377 - DONE
EMA5 CROSS AND LOCK BELOW 3377 WILL OPEN THE FOLLOWING BEARISH TARGET
3354 - DONE
EMA5 CROSS AND LOCK BELOW 3354 WILL OPEN THE FOLLOWING BEARISH TARGET
3329
EMA5 CROSS AND LOCK BELOW 3329 WILL OPEN THE SWING RANGE
3304
3281
As always, we will keep you all updated with regular updates throughout the week and how we manage the active ideas and setups. Thank you all for your likes, comments and follows, we really appreciate it!
Mr Gold
GoldViewFX

GOLD ROUTE MAP UPDATEHey Everyone,
Once again our chart idea is playing out in true level to level fashion.
We started with our bearish gap hit at 3377, followed with ema5 cross and lock opening 3354, which was also hit perfectly.
We are now seeing price play in the retracement range with 3329 also open for test. We expect reaction on this retracement zone, also keeping in mind the Bullish gap above, inline with our plans to buy dips.
We will keep the above in mind when taking buys from dips. Our updated levels and weighted levels will allow us to track the movement down and then catch bounces up.
We will continue to buy dips using our support levels taking 20 to 40 pips. As stated before each of our level structures give 20 to 40 pip bounces, which is enough for a nice entry and exit. If you back test the levels we shared every week for the past 24 months, you can see how effectively they were used to trade with or against short/mid term swings and trends.
The swing range give bigger bounces then our weighted levels that's the difference between weighted levels and swing ranges.
BULLISH TARGET
3403
EMA5 CROSS AND LOCK ABOVE 3403 WILL OPEN THE FOLLOWING BULLISH TARGETS
3422
EMA5 CROSS AND LOCK ABOVE 3422 WILL OPEN THE FOLLOWING BULLISH TARGET
3439
BEARISH TARGETS
3377 - DONE
EMA5 CROSS AND LOCK BELOW 3377 WILL OPEN THE FOLLOWING BEARISH TARGET
3354 - DONE
EMA5 CROSS AND LOCK BELOW 3354 WILL OPEN THE FOLLOWING BEARISH TARGET
3329
EMA5 CROSS AND LOCK BELOW 3329 WILL OPEN THE SWING RANGE
3304
3281
As always, we will keep you all updated with regular updates throughout the week and how we manage the active ideas and setups. Thank you all for your likes, comments and follows, we really appreciate it!
Mr Gold
GoldViewFX
XAUUSD--SHORT--short term sell possibility
--last week I was expecting gold rise but couldnt break the yellow trendline.
--so this week I expect first price will fall down to the 3333 level, then maybe try to rise again
--please check my daily timeframe chart I published just before this one.
--entry:3390 tp:3333
--from 3333, maybe will rise according to the blue channel. maybe break the 3333 level

Gold 30Min Engaged ( Bullish Entry Detected )Time Frame: 30-Minute Warfare
Entry Protocol: Only after volume-verified breakout
🩸Bullish Movement From now price - 3401
➗ Hanzo Protocol: Volume-Tiered Entry Authority
➕ Zone Activated: Dynamic market pressure detected.
The level isn’t just price — it’s a memory of where they moved size.
Volume is rising beneath the surface — not noise, but preparation.
🔥 Tactical Note:
We wait for the energy signature — when volume betrays intention.
The trap gets set. The weak follow. We execute.
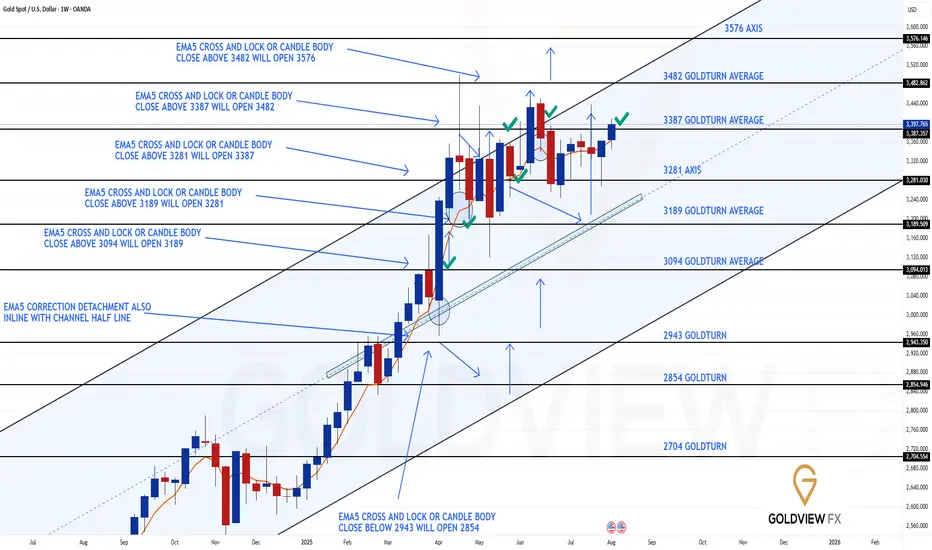
GOLD WEEKLY CHART MID/LONG TERM ROUTE MAPHey Everyone,
Weekly Chart Update = Gap Completed, Levels Playing Out Perfectly
Just a quick follow up on the ongoing weekly structure, the precision in level respect continues to be impressive, with price action unfolding exactly as we’ve been mapping.
After the previous bounce from 3281, price moved cleanly back up and completed the gap at 3387 last week, exactly as projected in last weeks post. This time, we now have a candle body close above 3387, which changes the dynamic and leaves 3482 open as a long term upside target. An EMA5 lock from here would further confirm the breakout potential.
Updated Structural Notes:
🔹 3281 Support Holds Again
Textbook reaction. Once again, 3281 provided the perfect launch point, reinforcing its strength as a key weekly pivot.
🔹 Gap at 3387 Completed
Price didn’t just revisit 3387, it closed above it on the weekly candle body. This shifts the bias toward potential breakout continuation rather than another immediate rejection.
🔹 3482 Now on the Radar
With 3387 cleared on a closing basis, the next major upside objective becomes 3482, aligning with the broader channel structure and unfilled weekly target. EMA5 confirmation on the long side could accelerate this move.
Updated Levels to Watch:
📉 Support – 3281
Key long-term pivot and buy zone. As long as this holds, dips remain constructive.
📈 Resistance Turned Support – 3387
Now potentially acting as a base. Watching retests here for hold confirmation.
📈 Upside Target – 3482
Primary long-term resistance now in focus if 3387 support holds and momentum sustains.
Plan:
The breakout above 3387 opens a new chapter for this range. We now watch for confirmation that 3387 has flipped to support. Holding here keeps 3482 firmly in play, while any decisive break back below could send us rotating toward 3281 again. Structure still leads, but bias shifts bullish with this weekly close.
Thanks as always for your continued support.
Mr Gold
GoldViewFX
Ready to BUY Gold to target 3445✏️ OANDA:XAUUSD confirms a continued uptrend as it breaks out of the triangle. The price is heading towards 3430 today and even higher at 3445. Today is Friday, the weekly candle close, and according to the range of the candle, it is possible to reach those highs. The BUY strategy can be activated at the moment and hold the position until the US session with the continuous US session buying pressure in recent days.
📉 Key Levels
Support: 3385-3365-3333
Resistance: 3419-3431-3445
Buy trigger: Confirmation of the h4 candle buying pressure above 3385
Buy trigger: Rejection of the support zone at 3365
Target 3445
Leave your comments on the idea. I am happy to read your views.
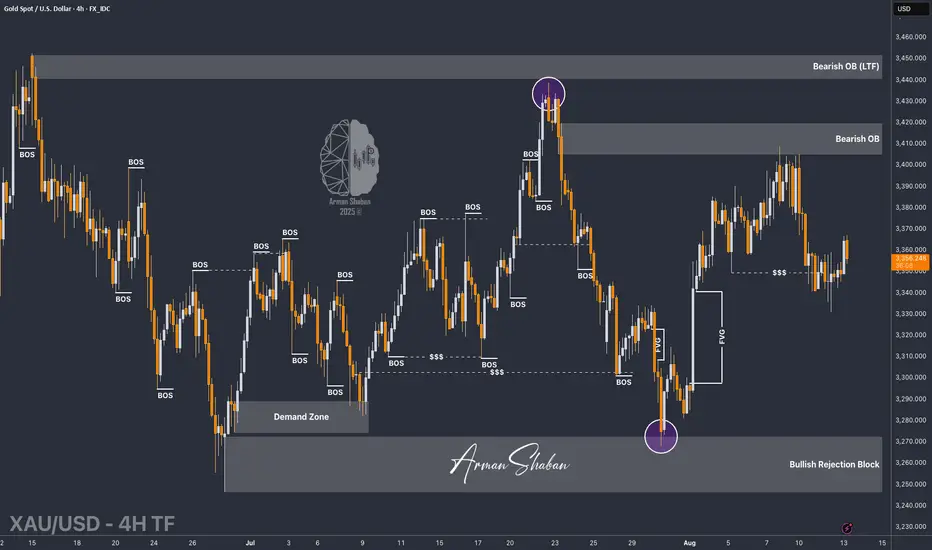
XAU/USD | Bull or Bear? Let's See! (READ THE CAPTION)By analyzing the #Gold chart on the 4-hour timeframe, we can see that after correcting down to the $3331 demand zone, price faced strong buying pressure and is now trading around $3357.
If gold manages to hold below $3367, we could expect a stronger drop, with downside targets at $3342, $3331, and $3323. This scenario will only fail if price holds above $3350, pushes past $3367, and closes above it — in that case, gold may rally back toward levels above $3390.
This analysis will be updated soon — don’t forget to show some support, friends!
Please support me with your likes and comments to motivate me to share more analysis with you and share your opinion about the possible trend of this chart with me !
Best Regards , Arman Shaban
GOLD Found Resistance Near 3390 - What's Next?GOLD Found Resistance Near 3390 - What's Next?
A few days ago, I shared a bullish outlook on gold, noting that a bearish pullback could occur even during its upward move.
The price nearly hit the second target, climbing as high as 3390.
Now, gold seems to be facing a strong resistance zone. While it’s not yet clear whether it will drop from here, a pause is also possible before it moves down more.
The real risk isn’t technical or fundamental; it’s the fact that gold is one of the most manipulated assets in the market.
Experienced traders know it often rises unexpectedly, even without any news.
That’s the challenge with gold: it can surge when you least expect it.
Targets: 3350, 3330, and 3294
You may find more details in the chart!
Thank you and Good Luck!
PS: Please support with a like or comment if you find this analysis useful for your trading day

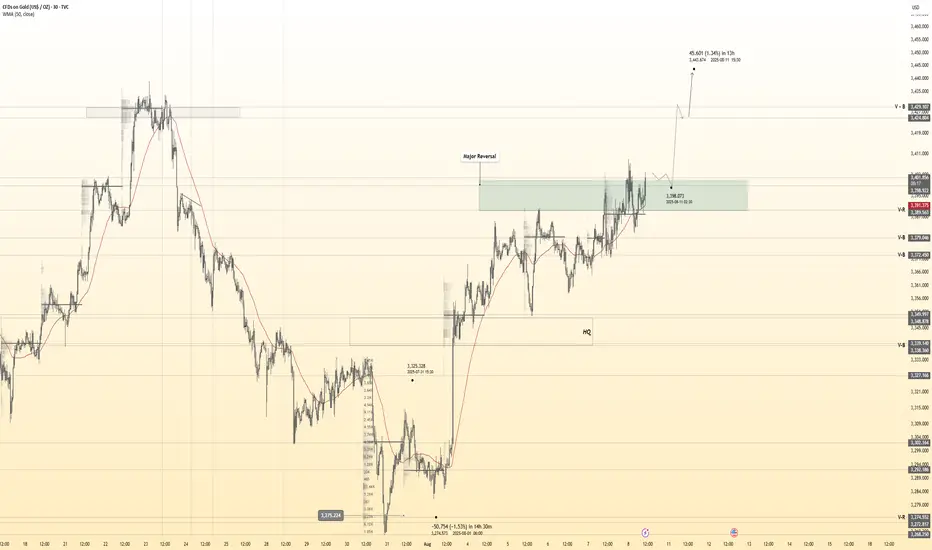
Gold Futures Hit $3,534 – Spot Lags by $100. What Could Mean?I don’t usually track Gold Futures every single day, but today a fellow trader drew my attention to something — and it’s impossible to ignore.
Gold Futures just printed an all-time high at $3,534, while spot gold (XAUUSD) topped at $3,409 — a $120 spread at the peak, now narrowed to about $100 at the time of writing.
A spread like this is highly unusual and, more importantly, unsustainable. By the time the August 27th contract expires, futures and spot must converge to the same price.
That means one of two things is about to happen — and either way, the move would be explosive.
1. Bullish Scenario – Futures Are Right
If the futures market is telling the truth, spot gold will have to accelerate higher to close the $100 gap.
If XAUUSD stabilize above $3,400, the odds of a push toward its own ATH become significant — and the move could be fast and aggressive.
________________________________________
2. Bearish Scenario – Futures Are Overreaching
If futures are overshooting, they will have to correct — hard.
From a technical standpoint, if spot will drop below $3,370, the door to a continuation is open toward at least $3,330 support.
A 400-pip drop in spot could translate into at least a 1,000-pip drop in futures, bringing the spread back toward its more typical 20–30 range.
________________________________________
Why This Matters?
Regardless of direction, $100+ spreads do not last. In the next three weeks, one side will be proven wrong, and the prices will snap back together.
Looking back at this year’s price action, spot and futures have always mirrored each other with an average spread of 20-30usd, depending on conditions and expectation, and for example:
• The spot ATH at $3,500 matches $3,509 in futures.
• The May low was identical in both markets.
This current divergence is the outlier — and it’s screaming that a major move is coming.
________________________________________
Bottom line: If futures are right, spot gold is about to rip higher. If spot is right, futures are about to collapse.
