XAUUSD trade ideas
Gold Gaining Strong Bullish MomentumHello Traders,
Let's talk about Gold. Here is what I see for its next moves.
I use these tools to help me:
EMA (Exponential Moving Average)
Fib Ret. & Ext. (Fibonacci Retracement and Extension)
VWAP (Volume Weighted Average Price)
Volume Profile
RSI (Relative Strength Index)
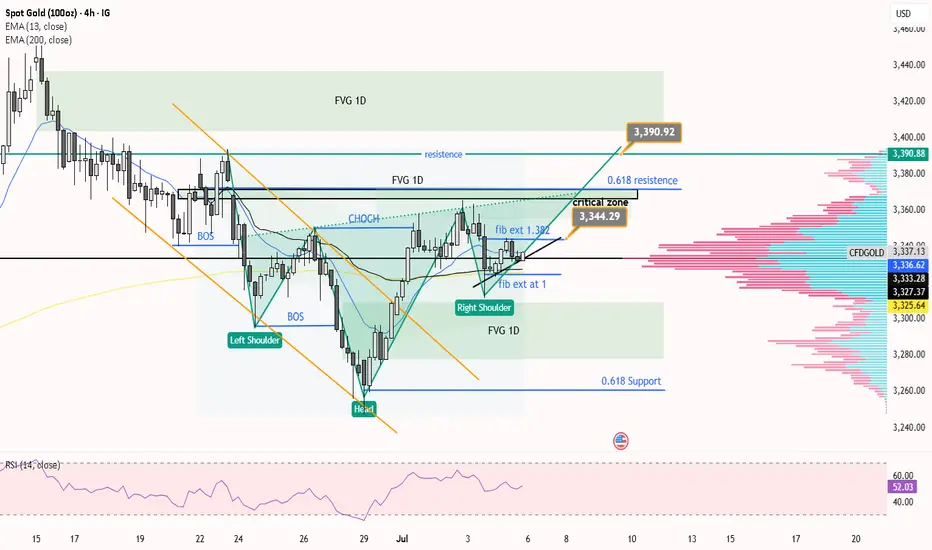
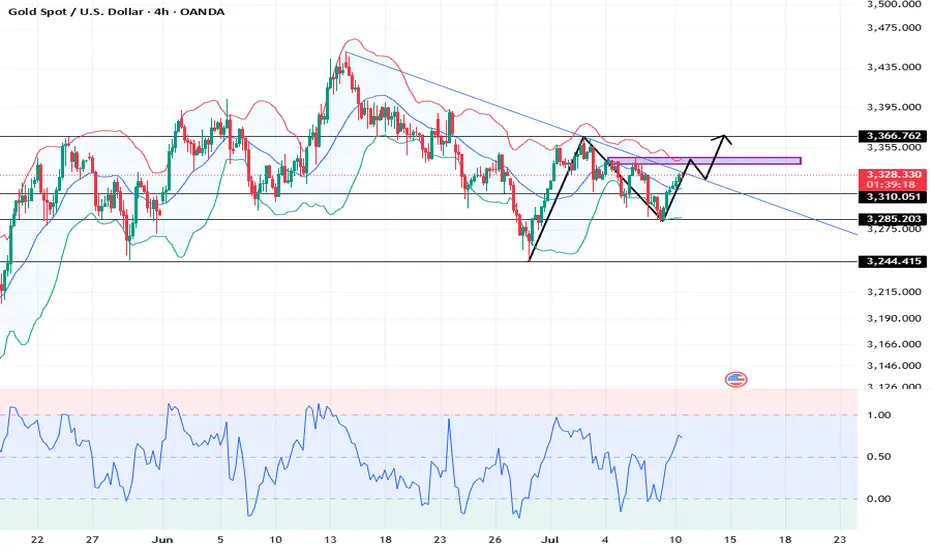
Looking at the big picture, it looks bullish for Gold. I see an inverse head and shoulders pattern forming. Also, the EMA and VWAP are below the price, which is a bullish sign. Gold also broke out of falling wedges and then moved back a little (a retracement), which is another bullish signal.
There is an important area I call the critical zone. This zone is between $3344 and $3364. It's important because it has a Fibonacci extension (between 2 and 1.618), a small FVG (Fair Value Gap) from the 1-day chart, and a resistance level from the 4-hour chart (at 0.618). This critical zone is important on both the 1-hour and 4-hour charts.
My idea is this: If the price of Gold goes above $3344, we can expect it to move higher into that critical zone, maybe up to $3364.
But, if you look very closely, there is also an ascending triangle pattern. This means we need to wait. It's best to wait until the price clearly breaks out (moves up strongly) or breaks down (moves down strongly) from this triangle before you open any trade.
Fundamental analysis:
FOMC Meeting Minutes (July 9):
Impact on Gold: Stronger (less rate cut chance) = Negative/Neutral for Gold. Weaker (more rate cut chance) = Positive for Gold. Volatility expected.
Trump's Tariff Deadline & Announcement (July 9 onwards):
Impact on Gold: New/higher tariffs = Strongly Positive for Gold (safe haven demand). This is the biggest risk/opportunity.
US Dollar ($) Trend:
Impact on Gold: US Dollar is downtrending = Positive for Gold.
US Bond Yields:
Impact on Gold: If yields fall = Positive for Gold. If yields stay high/rise = Neutral/Negative for Gold, but other factors (tariffs, central bank buying) might reduce this negative impact.
XAUUSD – Gold Surges on Safe-Haven Flows and Strategic BuyingXAUUSD is rebounding from the bottom of a descending channel, showing signs of breaking through the short-term resistance around $3,332.700. If price holds above this level, the bullish momentum could extend toward $3,350 and beyond.
On the news front, President Trump's announcement of new import tariffs on multiple countries has triggered safe-haven inflows into gold. Meanwhile, consistent buying from central banks and the ongoing trend of global de-dollarization continue to provide solid support. Unless a major negative shock occurs, gold is likely to maintain its upward momentum in the short term.
Gold: Market analysis and strategy for July 10.Gold technical analysis
Daily chart resistance level 3345, support level 3245
Four-hour chart resistance level 3340, support level 3285
One-hour chart resistance level 3330, support level 3310.
Yesterday, gold bottomed out and rebounded, standing above 3310, breaking the previous downward rhythm. The breakthrough of the previous opening means that gold is likely to continue to rise. The current market is bullish above 3310. You can buy around 3310. The upper resistance is 3340/45 area. The gold price runs in this area. If the top signal appears at a small level, you can sell.
In terms of intraday operations, it is recommended to sell in the 3340-45 range after rising, and buy when it falls back to 3310. It runs in a narrow range and can be scalped.
SELL: 3343 near
BUY: 3310near
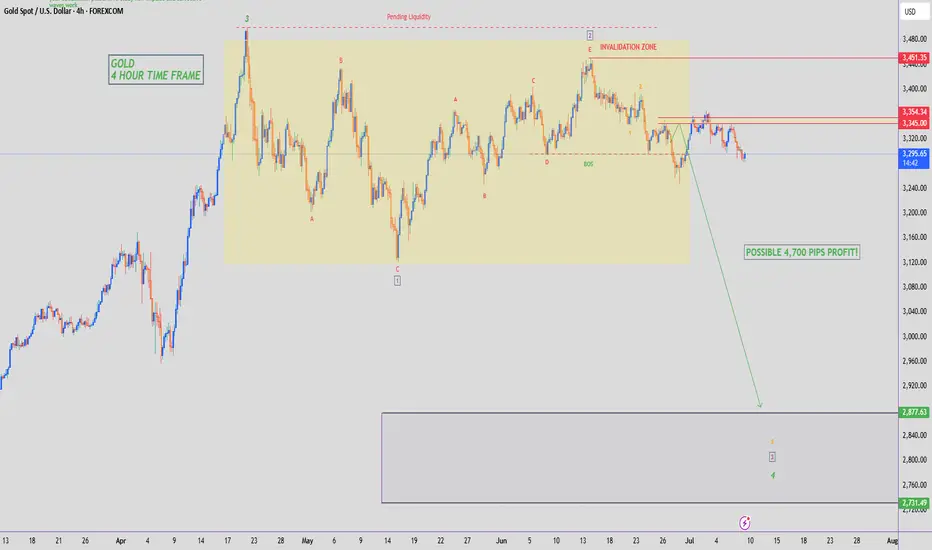
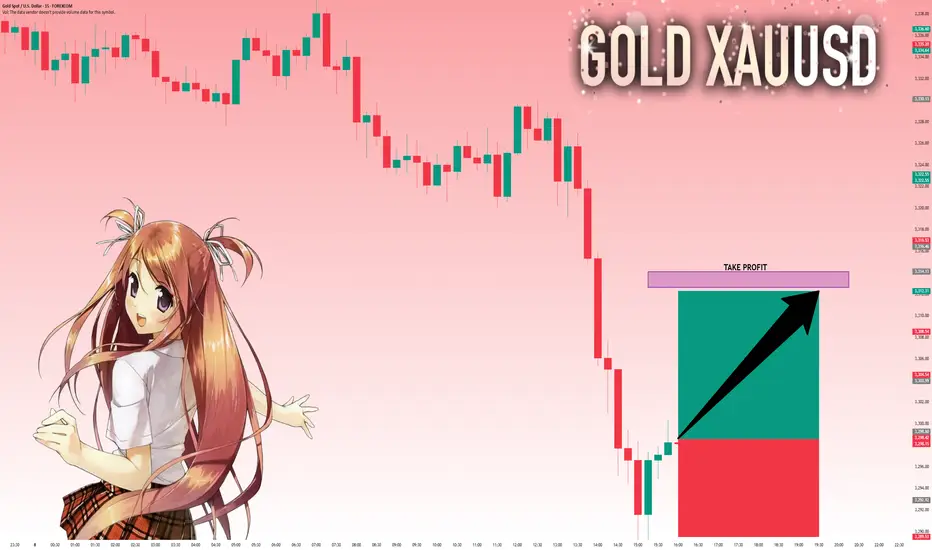
GOLD - SHORT TO $2,800 (UPDATE)Gold has dropped even lower overnight during the Asian market session. We're now running 500 PIPS in profit & hopefully this is only the BEGINNING of this huge move.
Being extremely careful here, as Gold is currently at a make or break sort of area.
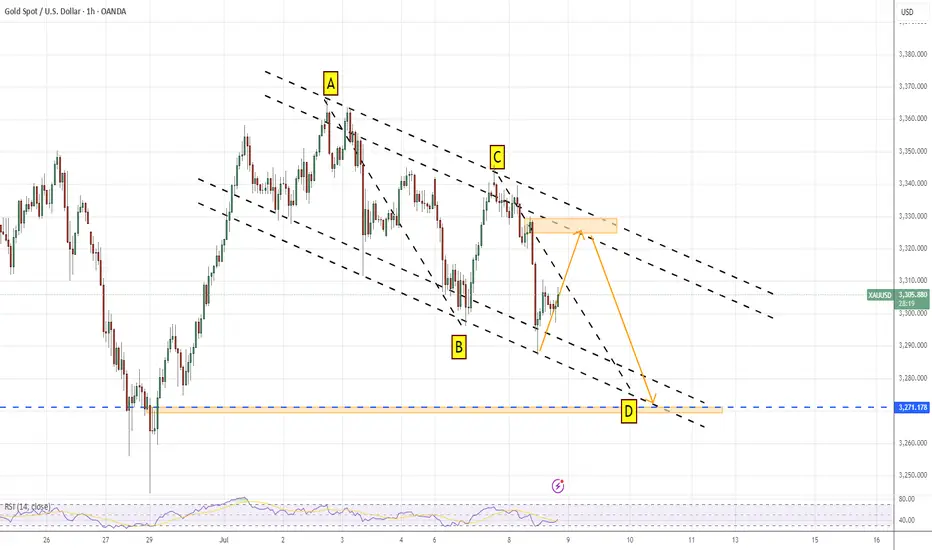
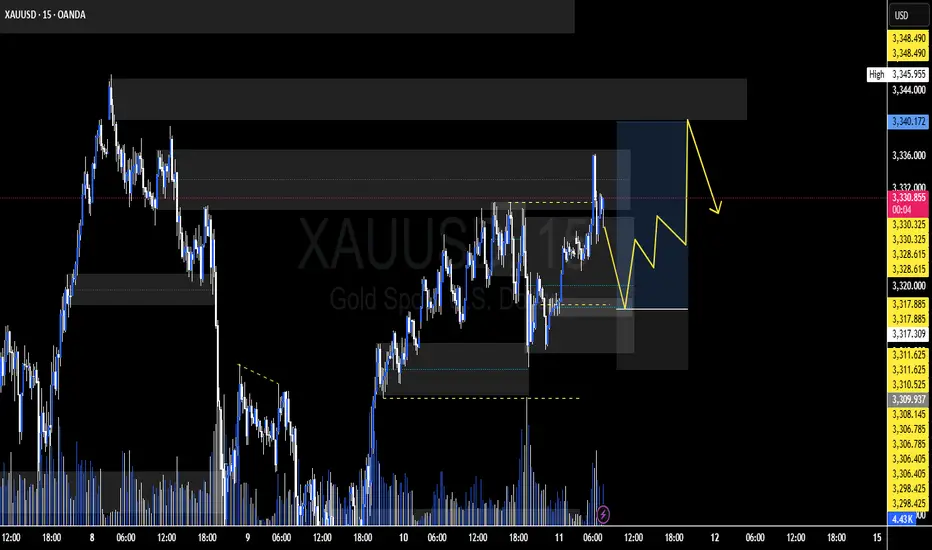
XAUUSD hour chart observationGold's hourly chart is clearly moving within a channel
There is a high probability of a rebound in the short term.
The key position is at the upper edge of the channel.
This happens to be the supply area【3324...3329】 of the hourly chart.
If there is a good reversal signal in the supply zone, you can try shorting.
Things to pay special attention to , If there is no reversal signal,Not suitable for short orders
short term Target:Approximately at the position where AB=CD is completed
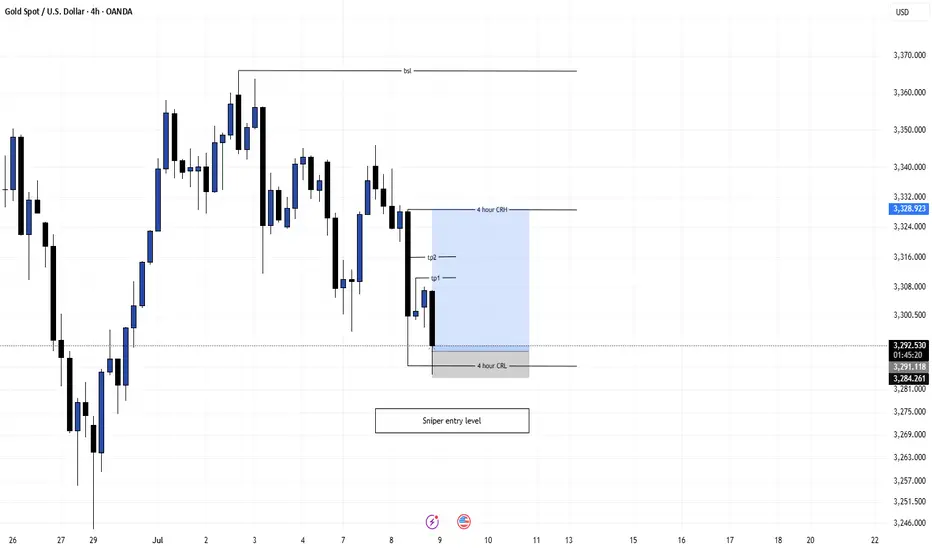
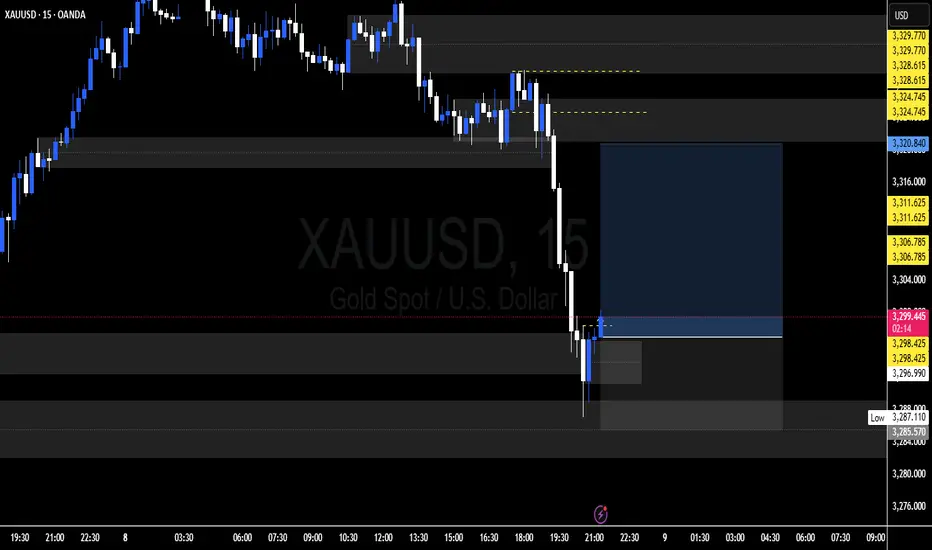
Gold (XAUUSD) – July 9 | M15 Bearish Pullback After H4 OB Tap🟡 Gold (XAUUSD) – July 9 Analysis | H4 OB Tapped, M15 Still Bearish
The market has just tapped into the H4 order block near 3280 (3288–3275) — a level we’ve been tracking closely.
However, price action shows that the H4 pullback is still active and not yet complete.
Yesterday, Gold respected the H4 supply zone (3342–3345) exactly as anticipated.
Since then, price broke below the M15 low at 3296 , confirming that bearish momentum remains valid on the lower timeframe.
🔍 Structure Breakdown
• H4: Pullback ongoing
• H4 OB: 3288–3275 (just tapped)
• M15: Broke below 3296 → Bearish trend continuation confirmed
• Current M15 State: In pullback phase
⚠️ Key Consideration:
While we are looking at bearish opportunities, keep in mind that the H4 OB (3288–3275) is a significant demand zone.
If the market begins to reclaim structure and breaks the Lower High(H4 supply zone), this could signal resumption of the H4 uptrend .
Until that happens, we remain cautiously short — but prepared to adapt.
📌 What We’re Watching
Despite the H4 OB tap, M15 remains bearish until proven otherwise.
So the focus stays on short opportunities — no longs unless structure shifts.
📍 Key M15 POI for Rejection:
→ 3322–3326 (Order Block)
→ If price pulls into this zone and gives M1 confirmation (ChoCh + micro BoS)
→ We’ll plan short setups aligned with current trend
If this zone fails, or structure flips bullish, we’ll wait patiently for a potential revisit of the H4 supply zone (3342–3345) — which remains a valid short area for high-probability setups.
🧠 Summary:
✅ H4 OB (3288–3275) tapped
❌ No bullish reversal yet — M15 still bearish
🔍 Watching 3322–3326 for possible short
📉 Bias: Bearish until structure shifts
But be flexible — if LH breaks, the game changes.
📖 Respect the structure.
The chart doesn’t reverse because you want it to —
It reverses when the market is done moving the other way.
📘 Shared by @ChartIsMirror
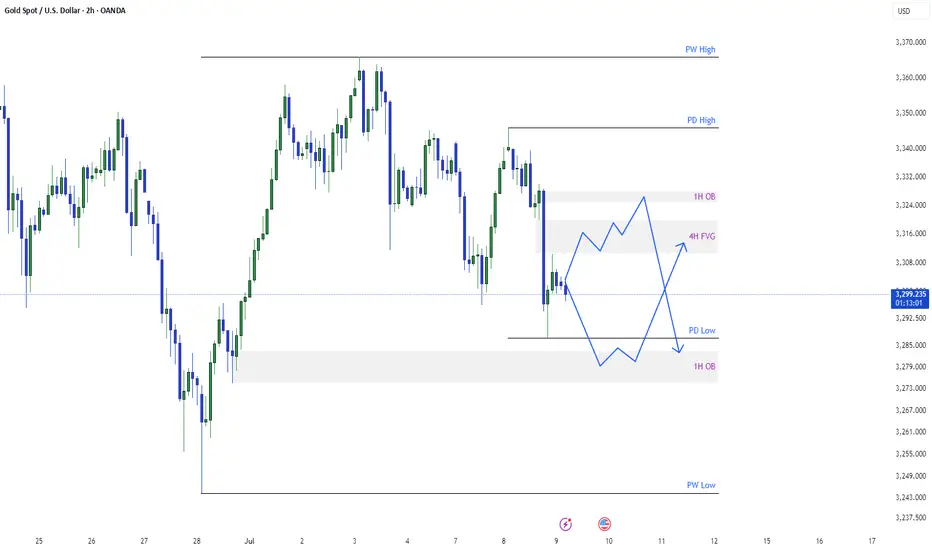
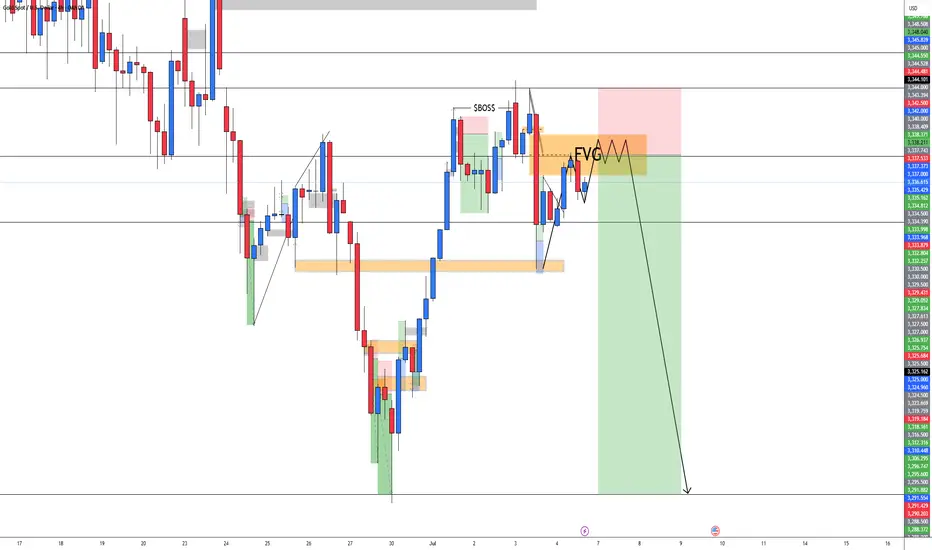
Gold Wants to Go lowerSee my previous analysis for gold I described I will take the low and has taken already. now the daily candle shown good sell. today there are two possibilities. Either gold will have pullback or will go further in sell. I have given both possibilities in my analysis.
For Pull Back: It may take the previous day low and then retraces back to 4 hour FVG or to the order block residing at 3324.
For Further sell : It may pull back to 4 hour FVG and then goes back to take previous day low.
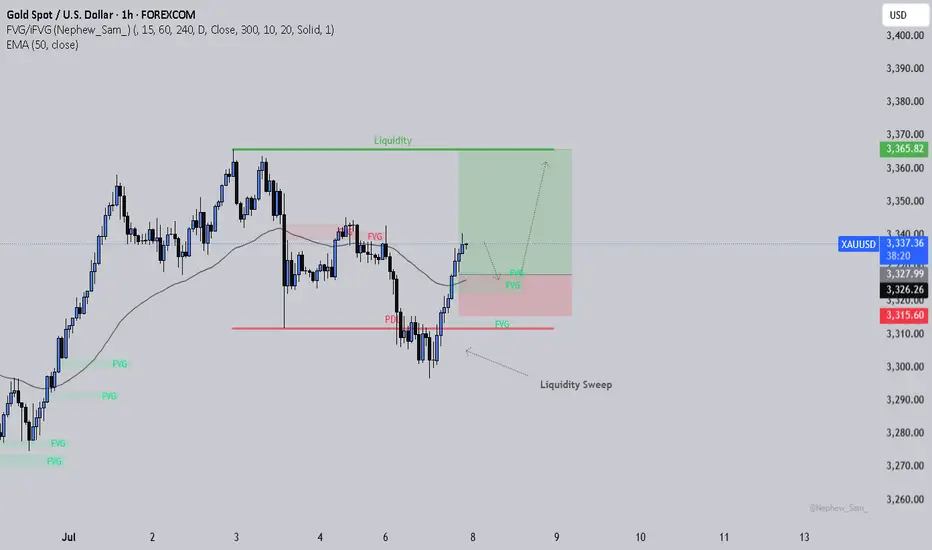
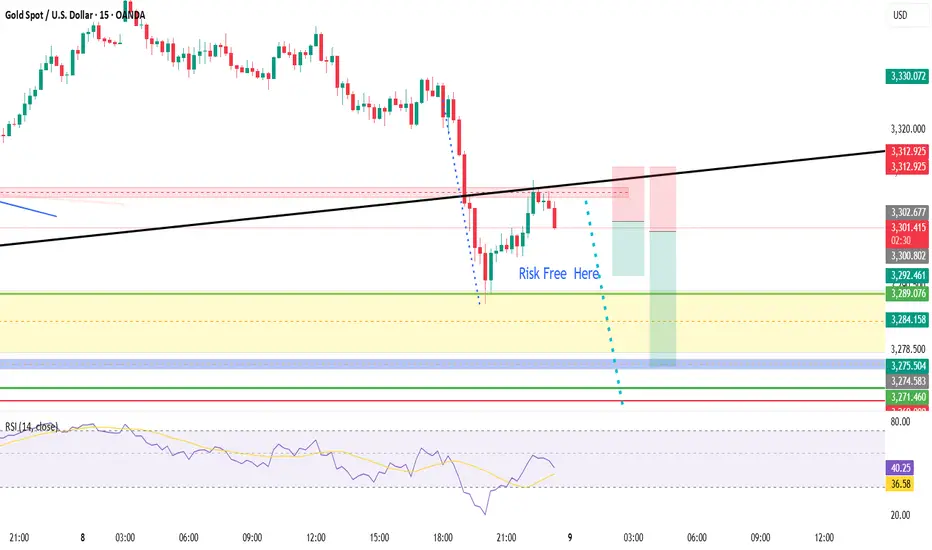
Following Price Flow to the Next TargetPrice swept liquidity below the previous day’s low and then powered back up, breaking structure to the upside. Now it’s sitting above the 50 EMA, moving through fair value gaps left by the rally. I’m watching for a possible pullback into the FVG zone near the EMA. If that level holds, price could look to reach for the liquidity above around 3,365.
But here’s what matters most. Even if this ends up being a losing trade, I’d rather take that loss knowing I stuck to my plan than catch a random win by breaking my rules. Because long-term, winning trades that come from impulse actually set you up for future damage. They teach bad habits.
Losses that happen inside your system? Those are simply the cost of doing business. They protect your discipline and keep your edge intact. Over time, that’s exactly what allows you to stay in the game and grow your account.
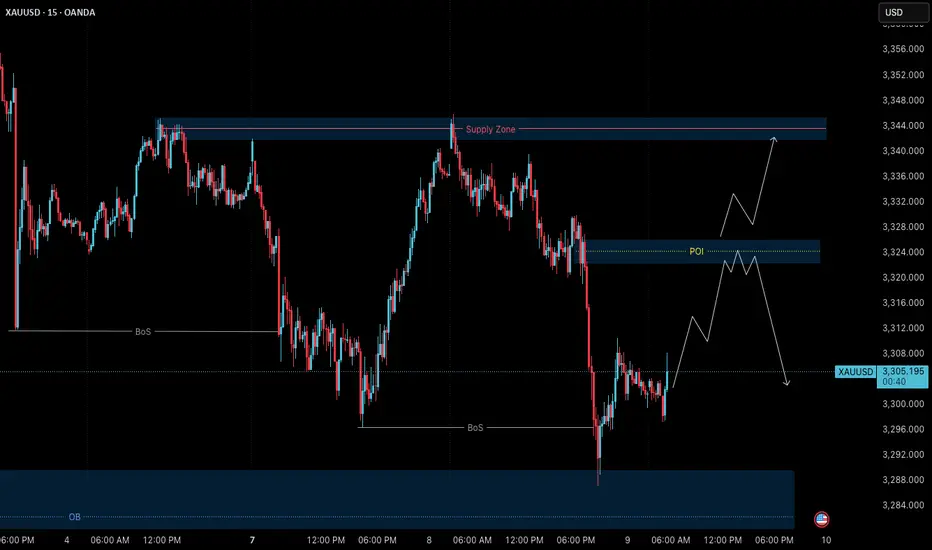
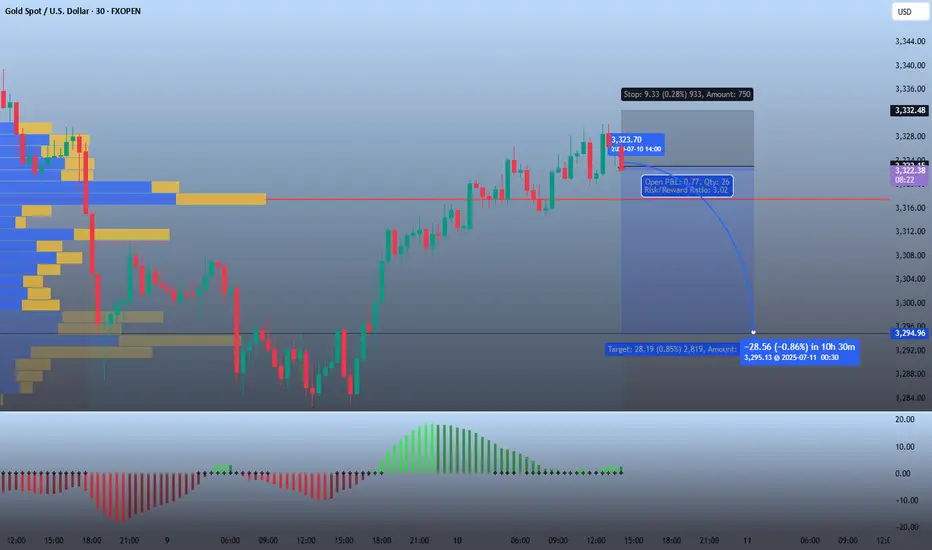
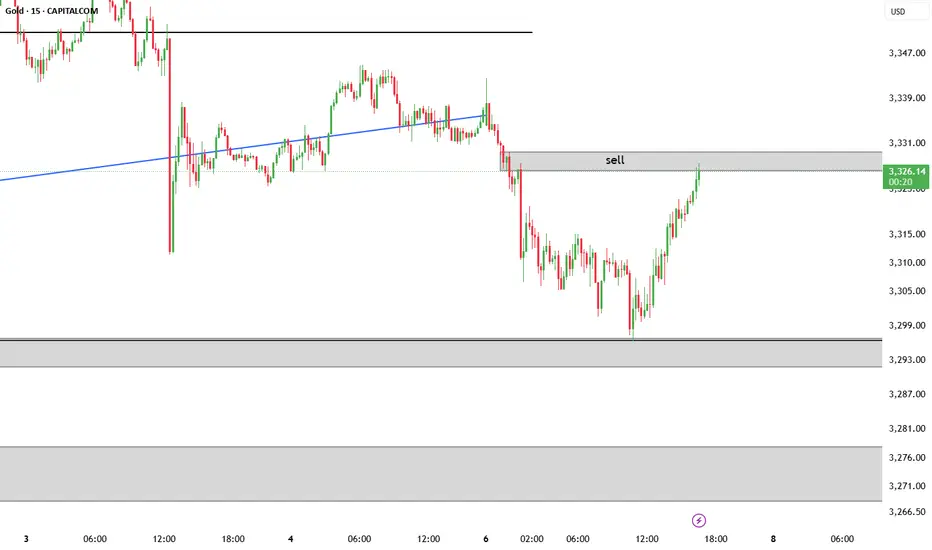
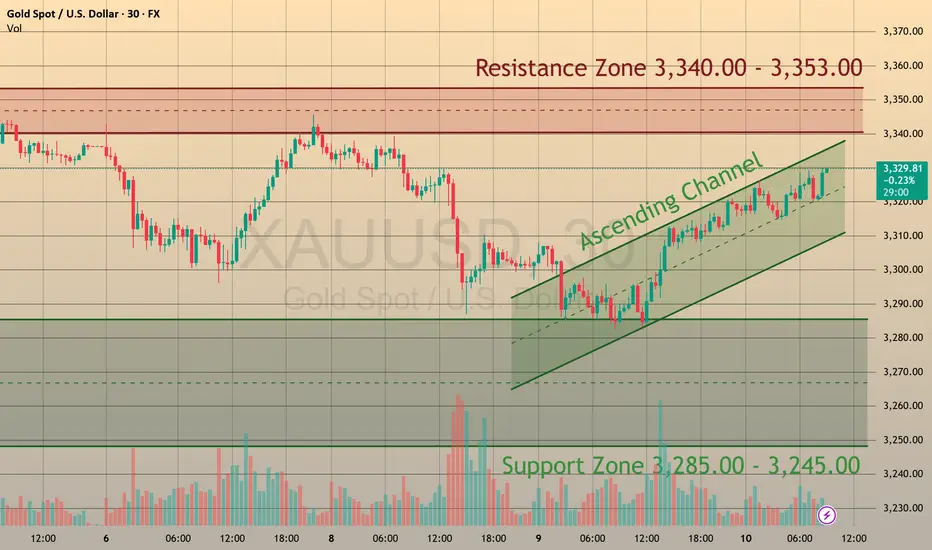
XAU/USD 30-Min Bearish Setup📉 XAU/USD 30-Min Bearish Setup – July 10, 2025
Gold is currently showing signs of short-term exhaustion after a steady climb from sub-$3,300 levels. Price action is stalling just below $3,326, aligning with a low-volume node on the volume profile, suggesting weak continuation momentum.
🔻 Short Setup Parameters:
Entry: $3,323.70
Stop Loss: $3,332.48 (0.28%)
Take Profit: $3,295.13
Risk/Reward Ratio: 1:3.02
Target Move: -28.56 pts (-0.86%)
Expected Duration: ~10 hours
📊 Technical Factors:
Volume Profile: Price is stalling near a previous high-volume resistance band
Bearish Divergence: Histogram shows momentum fading (MACD histogram flattening)
Market Structure: Lower highs and potential intraday double-top forming around $3,326
📌 A break below $3,320 could confirm this bearish bias and accelerate the move toward $3,295 zone. Setup remains valid while price stays under $3,326.50.
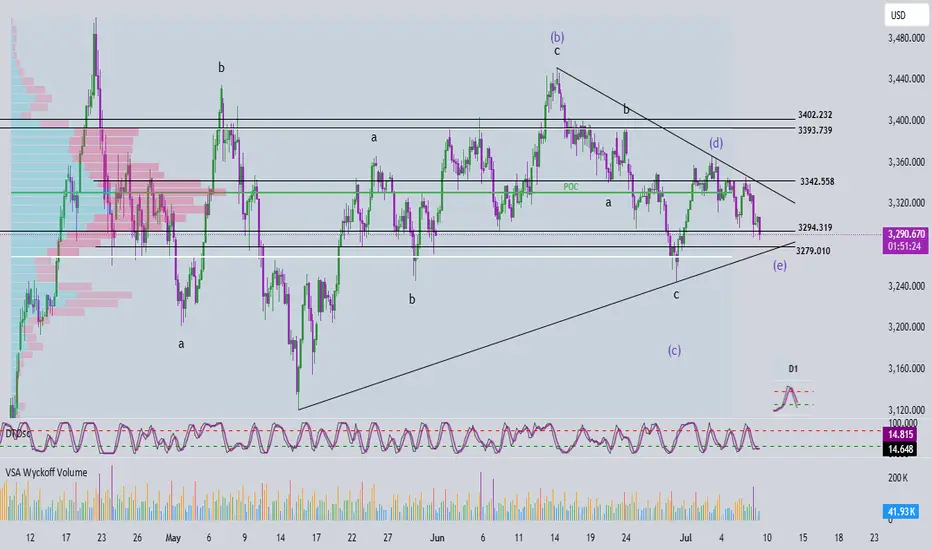
Elliott Wave Analysis – XAUUSD July 9, 2025
🔻 Momentum Analysis
D1 timeframe: Momentum is approaching the oversold zone and may reverse upwards today or tomorrow.
H4 timeframe: Momentum is already in the oversold zone. The two momentum lines are converging, signaling weakening downward pressure and a potential reversal.
🌀 Elliott Wave Structure
The price level around 3318 (previous buy zone) failed to hold, despite a ~100-pip bounce before continuing to decline.
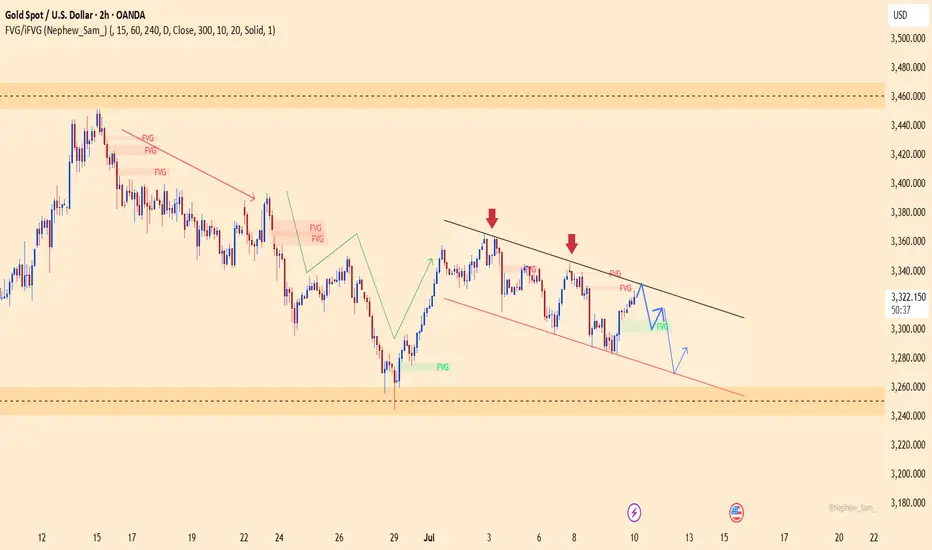
Currently, price is nearing the lower boundary of a contracting triangle – a typical abcde corrective pattern.
Based on the current wave structure:
- Wave d (purple) appears to be complete.
- Price is now likely forming wave e, expected to end near 3279, which coincides with the triangle’s bottom support.
If the pattern holds, a strong breakout above the upper triangle boundary is expected once wave e completes.
However, note: the formation of a triangle during a corrective wave often signals that the uptrend is nearing its end in the longer term.
📌 Trading Plan
Given the complex 3-wave structure typical of triangles, risk is elevated, so:
Trade with reduced position size, or
Preferably wait for a confirmed breakout above the triangle before entering.
Suggested Trade Setup:
✅ Buy Zone: 3280 – 3277
❌ Stop Loss: 3270
🎯 Take Profits:
TP1: 3309
TP2: 3342
TP3: 3390
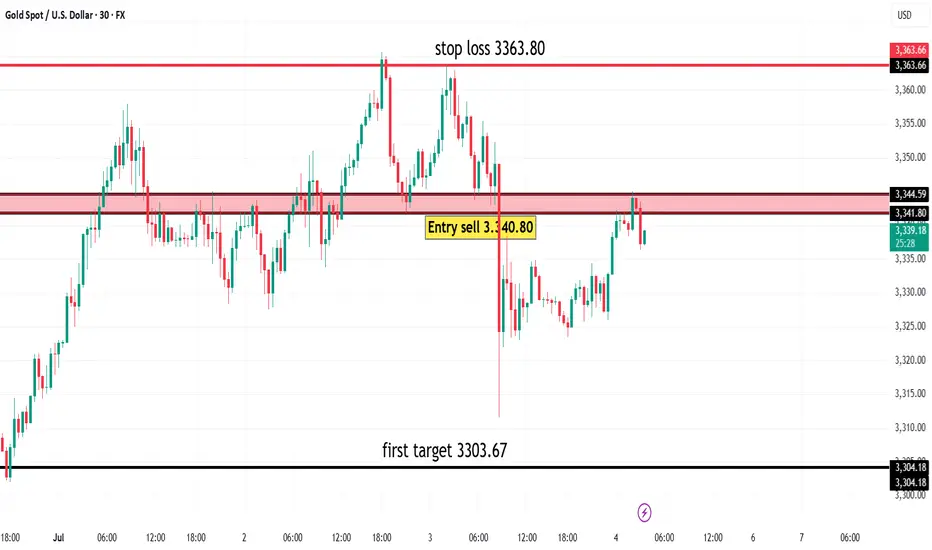
XAU/USDgold in frame 30 mins is good opportunity to sell from 3,340
with stop 3,352
target is 3303.67
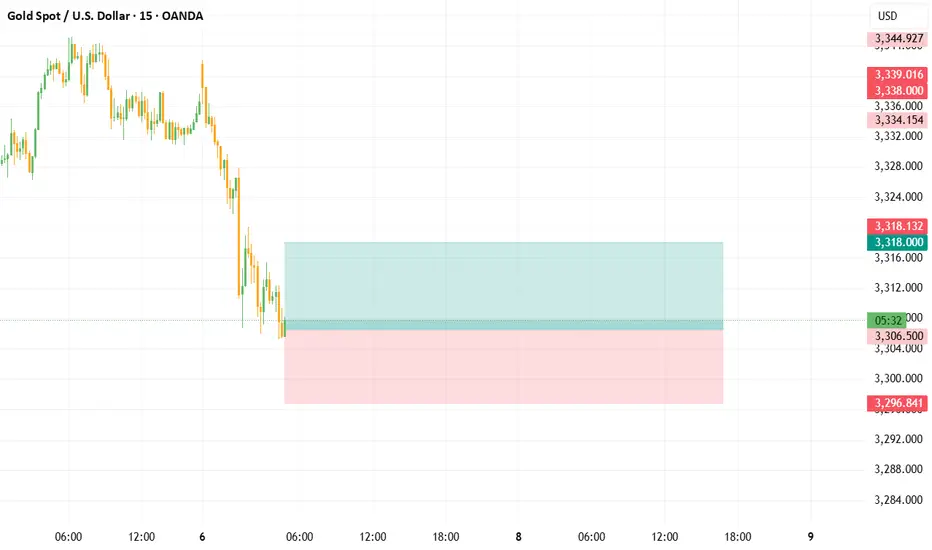
XAUUSD BEARISHAccording to the SMC and FVG concept, I am seeing bearish momentum in Gold. We have to wait for the proper rejection from FVG to sell the GOLD.
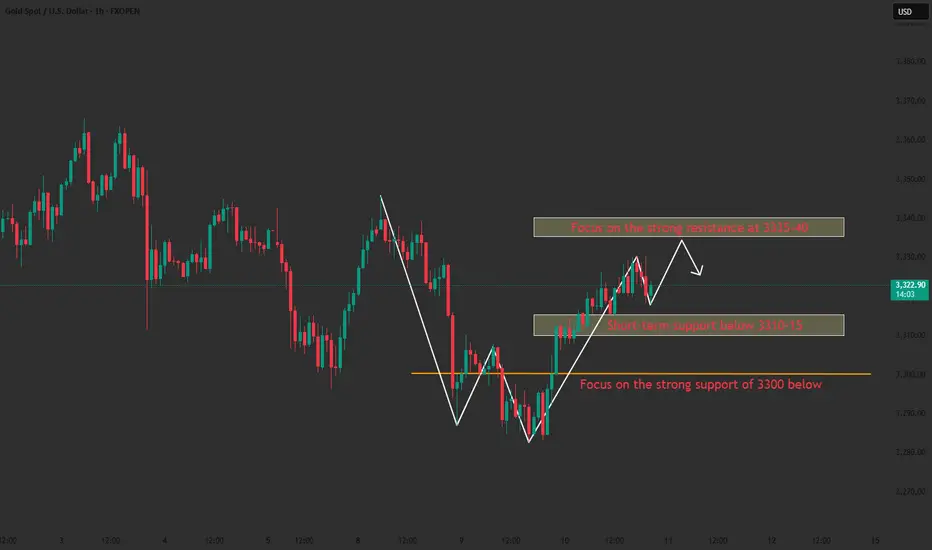
Key point layout suggestionsThe current gold market is showing a weak rebound pattern. Although there was a small rebound on Wednesday, if it cannot stand above 3330, the overall trend will still be weak.
From the daily level, the support level is 3300 and the resistance level is 3335. The price is oscillating between the middle and lower tracks of the Bollinger Bands, and there is a possibility of upward or downward breakthrough.
Focus on the H4 cycle trend: if the rebound can stand above 3330, the price may further rise to 3335 US dollars;
Once it stands at 3335, it can be basically confirmed that the callback is over, and the subsequent challenge of 3345 resistance level may be repeated.
It is recommended to adopt a long-on-dip strategy near the support level, focusing on the support strength of the 3310-15 area below; the resistance level of 3335-3340 should be paid attention to above.
In terms of specific operations, if the price rebounds to the 3335-3340 range, short selling can be considered; if it pulls back to the 3310-3315 range, long selling can be considered.
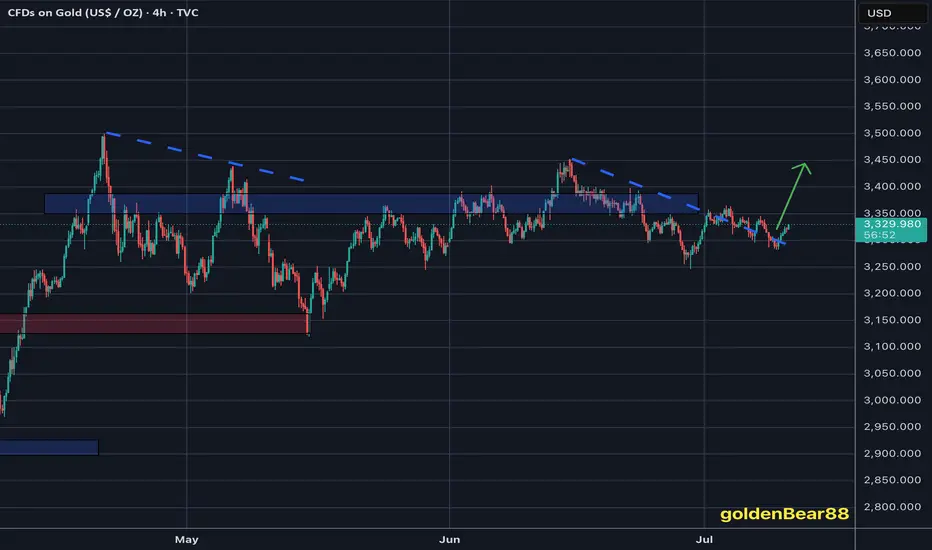
Gold reverses on new Bull legTechnical analysis: Gold has made an important Bullish step towards full scale Hourly 4 chart’s reversal as it almost recovered the #3,330.80 pressure point. That makes Hourly 4 chart practically Neutral but leaning on the Bullish side, however well Supported within #3,300’s belt now, which has held on multiple occasions so far. As mentioned throughout my remarks, Hourly 4 chart is still Neutral as said, but invalidated Descending Channel has expanded giving me Buying signs that Gold may test #3,352.80 psychological benchmark on current Fundamental mix (if #3,337.80 gets invalidated, Gold can kick-start aggressive upswing towards #3,345.80 zone / wall of Resistance lines first and #3,352.80 benchmark in extension. Gold was mainly correlated with DX during first Months of the Year as there was no shift which lifts the probability that July will also be DX Month is (#91.99%) since Bond Yields were on downtrend, taking strong hammering and broke all Support zones, and Gold was also on Short-term decline which confirms my Gold - DX correlation on #Q1 opening, so look for pointers there. Remember, when you are unsure of the Medium-term direction on Gold always look for clues on DX and Trade accordingly. Only when DX Trades on Weekly chart’s Higher High’s Lower zone, I will be able to note with a Higher degree of certainty that the Bearish reversal on Gold is sustainable.
My position: I was Selling Gold until #3,282.80 all the way and was aware that if #3,277.80 - #3,282.80 gets invalidated, Gold will continue with the decline, and reversal there will deliver Bullish leg. I have engaged #3,284.80 Buying order and closed near #3,300.80 benchmark. Then re-Sold aggressively from #3,304.80 towards #3,298.80. Bought #3,307.80 and kept my order all the way towards #3,315.80. Current session I will re-Buy Gold with Scalp orders aggressively, do not Sell today / my practical suggestion.
Gold Extends Gains Amid Uncertainty FOREXCOM:XAUUSD
XAUUSD is currently moving within the $3,270 – $3,360 range 📈, holding steady under buying pressure over the last few hours ⏳.
🌏 During today’s Asian and early European sessions, gold climbed to around $3,330 🥇, extending gains as investors monitored trade tensions and absorbed the latest FOMC Minutes 🗂️. A weaker U.S. dollar 💵⬇️ continues to support gold, attracting safe-haven flows 🛡️ amid ongoing market uncertainty.
📊 Meanwhile, the Fed’s June meeting minutes 🪙 revealed disagreements among officials 🤔 on the timing and scale of potential rate cuts 🔻. While most anticipate some easing later this year, views range from cuts as early as July to no cuts until year-end. The Fed maintains a cautious, data-driven approach 🧭, citing tariff-related inflation risks, slowing consumer spending, and a strong labour market as key factors for their policy outlook.
👀 We will continue to monitor gold closely for potential breakout or reversal signals within this range. Stay tuned for updates!
GOLD: Move Up Expected! Long!
My dear friends,
Today we will analyse GOLD together☺️
The market is at an inflection zone and price has now reached an area around 3,298.60 where previous reversals or breakouts have occurred.And a price reaction that we are seeing on multiple timeframes here could signal the next move up so we can enter on confirmation, and target the next key level of 3,312.65.Stop-loss is recommended beyond the inflection zone.
❤️Sending you lots of Love and Hugs❤️
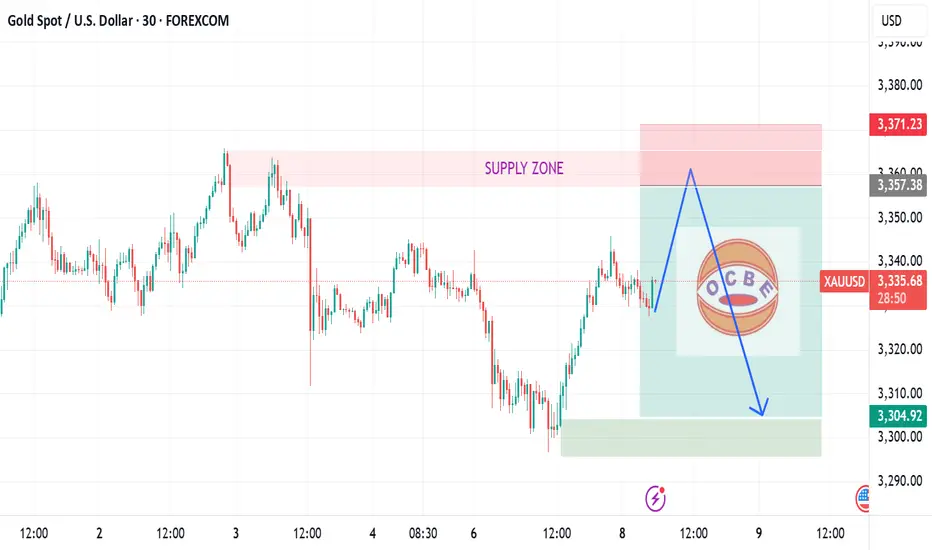
XAUUSD short movePrice is rising towards our supply zone, any bearish reaction cloud lead price to fall.