Gold Finding Next Demand ZoneGold is always an uptrend currency. It has been uptrend for years. Now it's time to pullback. It is finding demand zone to react. 3300 area is a valid zone.
XAUUSD trade ideas
XAUUSDDon't take trades until the end of the summer.
Longterm 5K.
Short/Midterm its going to 3.500 but for the moment we locked inside of a consolidation.
The market it's waitting for news for start new moves.

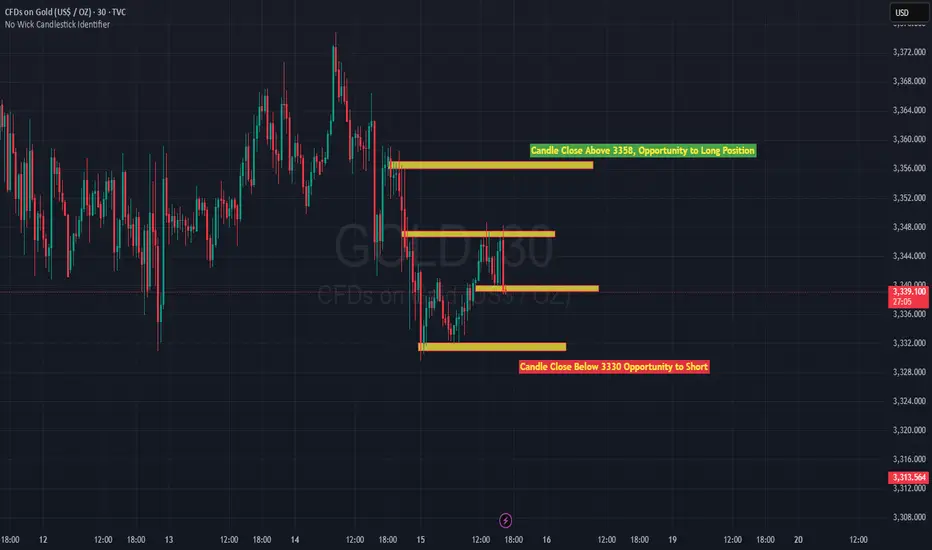
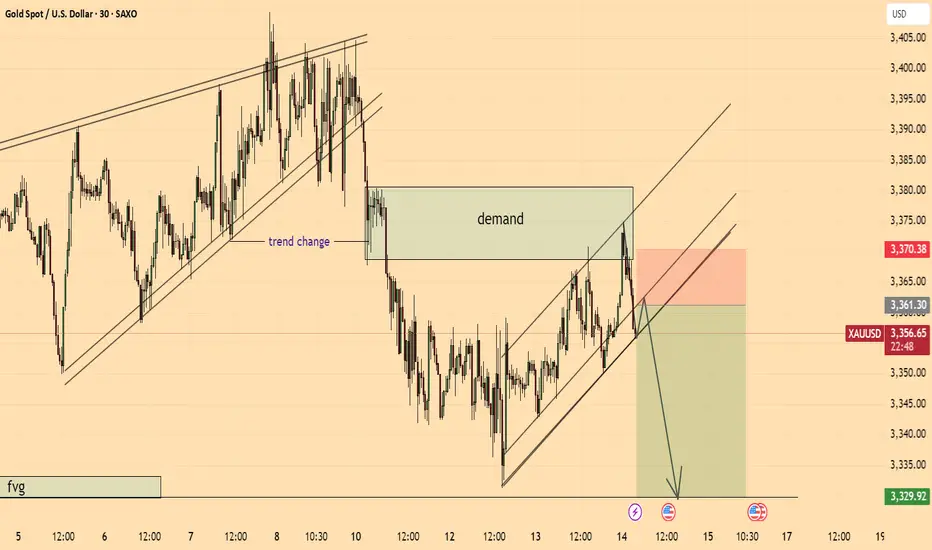
M30 Gold Analysisthis is what i Look, M30 Gold naked chart,
trade what you see not what you think
Good Luck
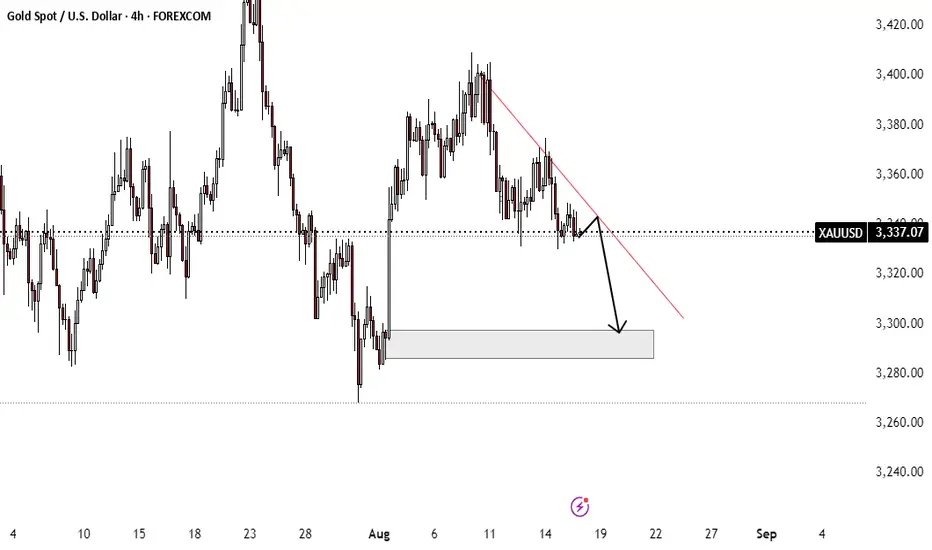
XAUUSD Intraday Analysis – August 15, 2025 (4H Chart)On the 4H timeframe, Gold (XAUUSD) is currently trading around 3,337 USD, moving sideways after the recent drop. Here’s the detailed outlook:
1. Trend & Price Structure
Main Trend: Short-term bearish bias remains intact, confirmed by the descending trendline and EMA 20/50/100 positioned above price.
Price is testing the 3,337–3,329 USD support zone (light green area), which is the most recent swing low.
Price action shows slowing bearish momentum with several long-tailed candles, suggesting a possible technical rebound.
2. Key Support & Resistance Levels
Immediate Resistance:
3,347–3,351 USD (EMA20 + EMA50)
3,354–3,356 USD (local high + Fibo 38.2%)
3,375 USD (Fibo 61.8% + strong H4 resistance)
Key Support:
3,337–3,329 USD (short-term support)
3,300 USD (psychological level + previous demand zone)
3. Trading Strategy Ideas
Bullish Scenario (Buy):
Buy if price breaks and closes above 3,351 USD on H4, targeting 3,356–3,375 USD, stop loss below 3,338 USD.
Bearish Scenario (Sell):
Sell if price breaks below 3,329 USD, targeting 3,300 USD, stop loss above 3,347 USD.
Apply strict risk management with R:R ≥ 1:2.
4. Overall Assessment
The market is consolidating at a strong support zone.
Without a clear bullish breakout above EMA levels, the bearish trend may resume.
Traders should wait for a confirmed breakout candle with matching volume before entering positions.
Note: This analysis is for educational purposes only and not financial advice. Follow for more trading strategies and real-time updates.
Short-Price has broken trendline and tested.
-Price has broken support level to create resistance level.
-Anticipation of a test of the on the resistance level to confirm sell.
-Anticipation of a new trend all together.
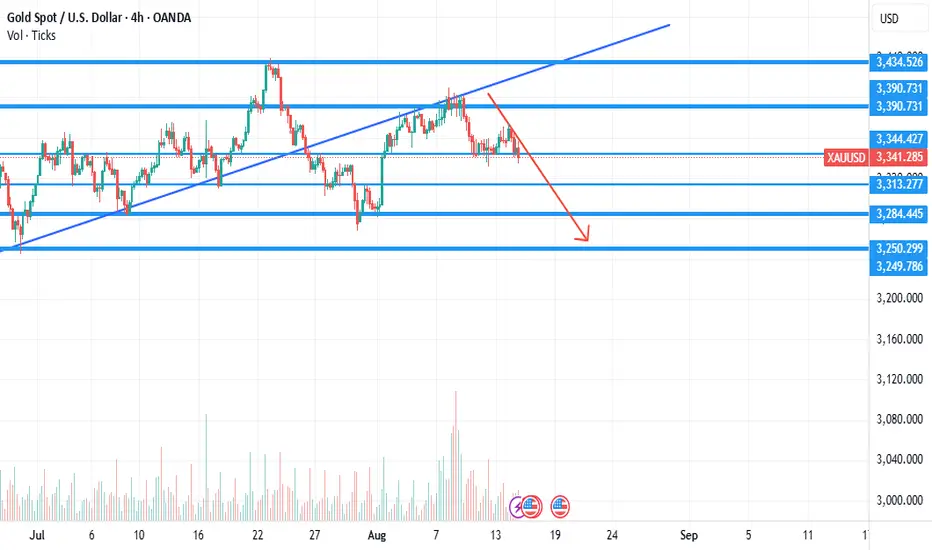
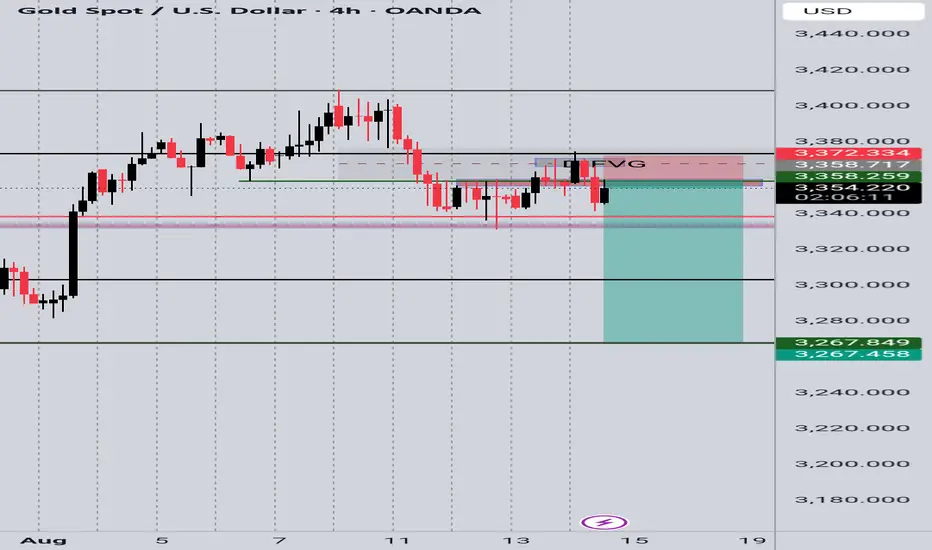
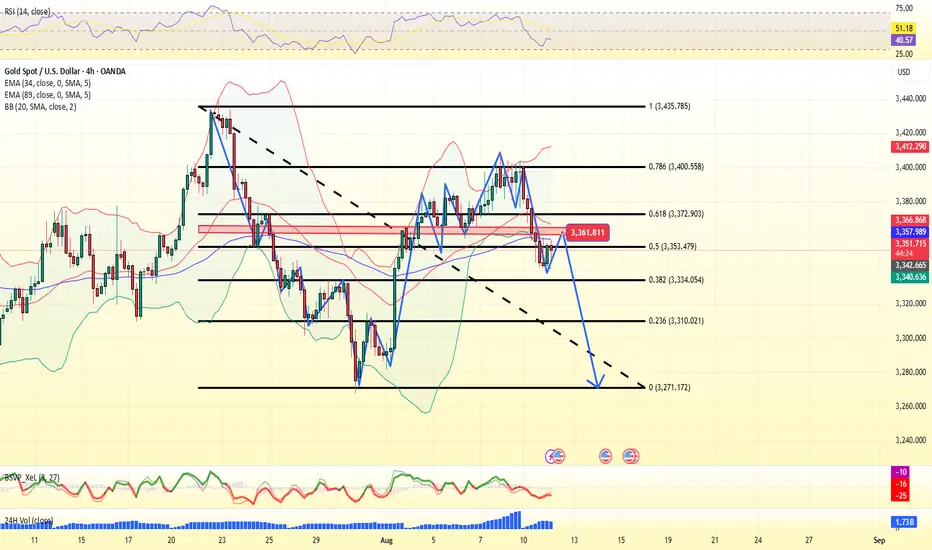
XAUUSD Long-Term Sell IdeaBias: Bearish
Reasoning:
Fair Value Gap (FVG) rejection – Price tapped into the supply/FVG zone around 3,358 – 3,372 and showed rejection.
Lower highs forming – Market structure suggests bearish momentum as bulls failed to push beyond recent highs.
Liquidity targets below – There’s untapped liquidity and imbalance resting near the 3,268 level and potentially lower towards 3,200.
Macro outlook – Strong USD and hawkish Fed stance could continue to pressure gold in the mid-term.
Entry zone: 3,358 – 3,372 (already tested)
Short-term target (TP1): 3,268
Long-term target (TP2): 3,200 – 3,180 zone
Invalidation (SL): Close above 3,380
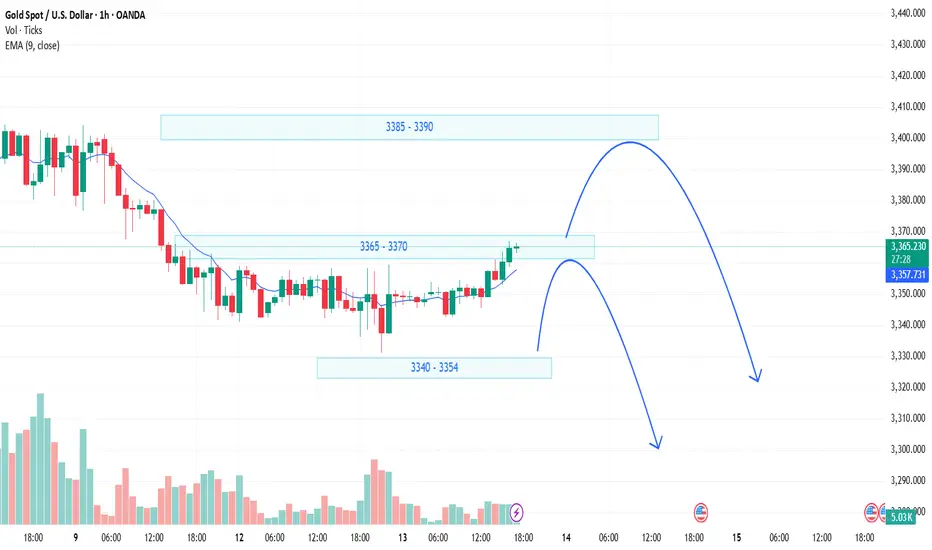
Gold Trading Strategy XAUUSD August 13, 2025Gold Trading Strategy XAUUSD August 13, 2025:
Gold prices recovered slightly, currently trading around $3,351/oz, positive US inflation data for July has reinforced market expectations that the US Federal Reserve (FED) will cut interest rates in September, while a weaker US dollar has boosted gold's appeal.
Fundamental news: Data from the US Bureau of Labor Statistics showed that the Consumer Price Index (CPI) increased 2.7% year-on-year in July, lower than the expected 2.8% and unchanged from June. Core CPI increased 3.1% year-on-year and 0.3% month-on-month, the largest increase in six months.
Technical analysis: The sideways range of 3,340 - 3,360 has not been broken yet. The MAs are showing signs of moving sideways, showing the tug-of-war between buyers and sellers. RSI H1 has started to move towards the buy zone, RSI H4 is heading towards the average line. There is a high possibility that gold price will have a correction according to RSI of H4 and increase strongly again.
Important price zones today: 3340 - 3345, 3365 - 3370 and 3385 - 3390.
Today's trading trend: SELL.
Recommended orders:
Plan 1: SELL XAUUSD zone 3367 - 3369
SL 3372
TP 3364 - 3355 - 3345.
Plan 2: SELL XAUUSD zone 3387 - 3389
SL 3392
TP 3384 - 3374 - 3364 - 3345.
Plan 3: BUY XAUUSD zone 3340 - 3342
SL 3337
TP 3345 - 3355 - 3365 - 3385 - OPEN.
Wish you a safe, successful and profitable trading day.💗💗💗💗💗
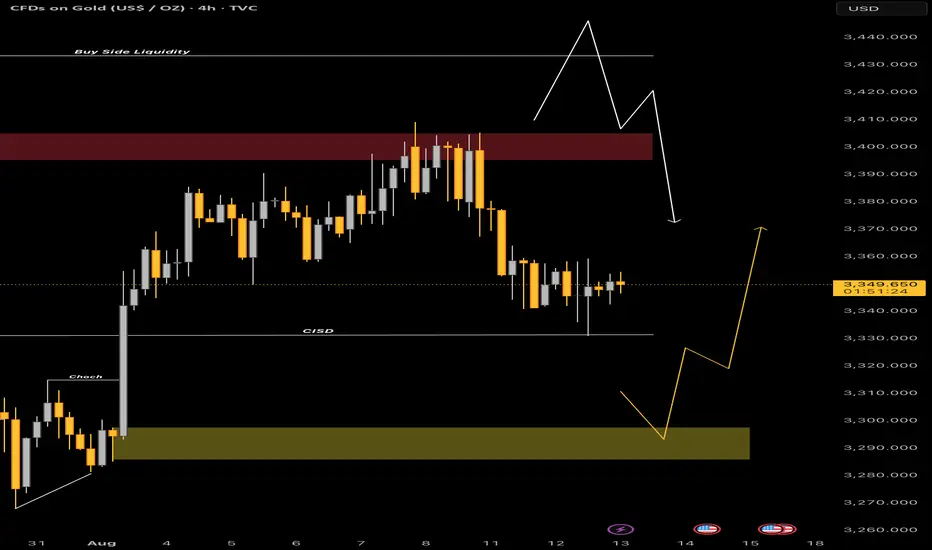
GOLD H4 PRICE UPDATE #XAUUSD#XAUUSD #GOLD #XAU
Gold Consolidating Between 3360 / 3340
First #GOLD Want To Take Breakout From Buyside Or Sell Side
If Gold Take The Buyside liquidity Then We Considering Sell Trades
Target the blue box (Engulfing Bullish Box) + (Order Block Box)
#GOLD JUST FLY FROM OUR BUY CISD ENTRY
#GOLD SMT Then Fly
Gold Buying From 3,300 Or 3,280
Targeting Price 3400 With Breakeven
Gold Selling From 3,440 / 3,460
Targeting Price 3,300 / 3,280
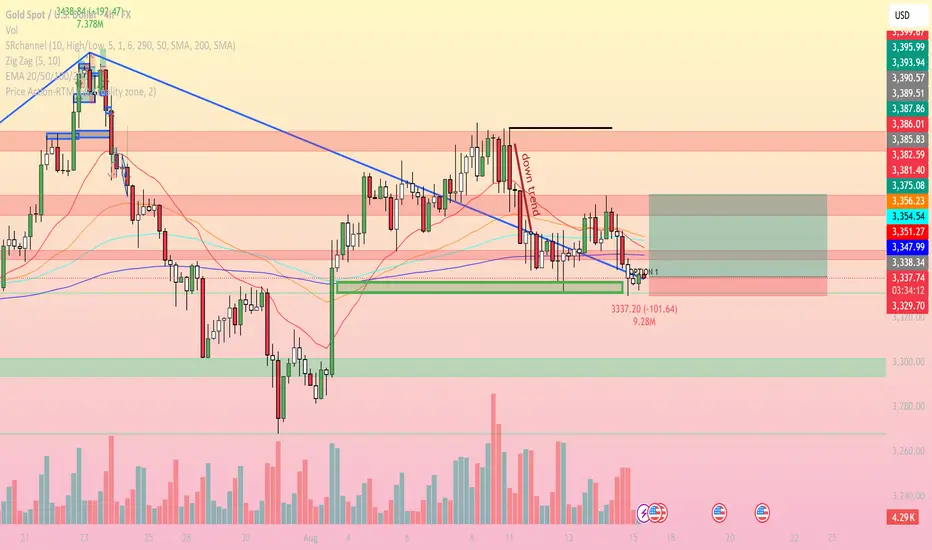
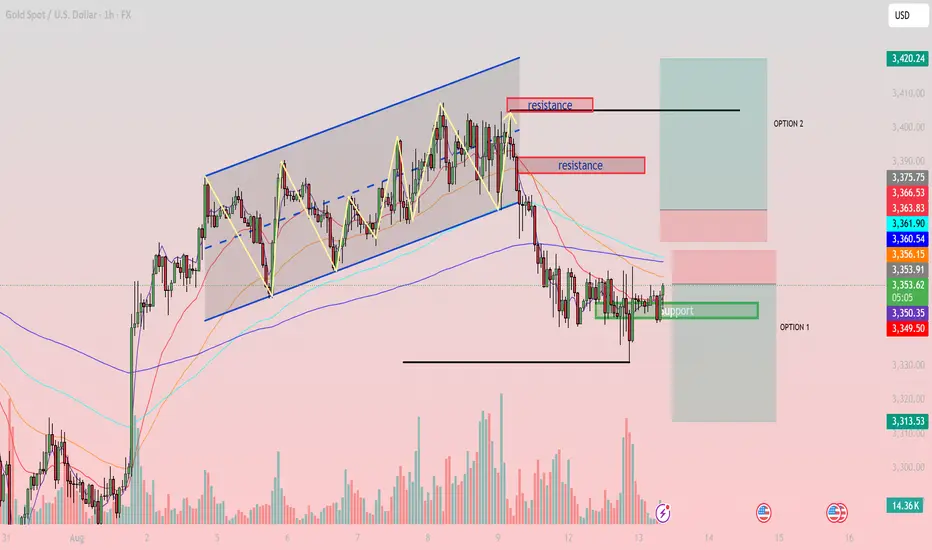
XAUUSD H1 Technical Outlook - Key Levels & Strategies for Today1. Trend & Price Structure
Previously, gold moved within an ascending channel but broke down on Aug 9, accompanied by strong selling pressure.
The price is now consolidating sideways around the 3,350 – 3,351 support zone (Option 1), with decreasing volume.
Short-term EMAs (EMA20, EMA50) are still below EMA200, indicating the short-term trend remains bearish.
2. Key Support & Resistance Levels
Immediate Support: 3,350 – 3,351 (a breakdown could send the price toward 3,325).
Near-term Resistance: 3,360 – 3,361 (aligned with EMA50 on H1).
Major Resistance: 3,375 – 3,380 (Option 2).
Deeper Support: 3,311.
3. Fibonacci Analysis
The recent drop from 3,390 to 3,346 shows the 0.5 retracement at ~3,368 and the 0.618 retracement at ~3,375.
Both levels overlap with strong resistance, increasing the likelihood of a bearish reaction from these zones.
4. Trading Strategies for Today
Scenario 1 (Preferred – Short): Wait for a pullback toward 3,360 – 3,375. If a reversal signal forms (e.g., pin bar, engulfing), consider short positions.
TP: 3,351 → 3,325
SL: Above 3,380
Scenario 2 (Countertrend – Long): If the price holds above 3,350 and breaks 3,361 with strong volume, consider a quick long trade toward 3,375.
SL: Below 3,346
Note: The H1 trend remains bearish, so long trades should have tighter risk management.
5. Additional Confirmation Signals
RSI on H1 is around 45–50, showing a neutral zone – watch for a breakout from the current range for confirmation.
Volume is decreasing, suggesting a potential volatility breakout soon.
Keep these levels on your watchlist and wait for a clear breakout or rejection before entering trades to avoid false moves.
Reasons for gold price plunge in today's trading session 11/8Gold prices fell 1% on Monday as markets focused on upcoming talks between the United States and Russia over the Ukraine conflict, along with July data that could bring more concerns about the Federal Reserve's interest rate outlook.
Gold was trading at $3,363.31 an ounce at 0703 GMT, having hit its highest since July 23 on Friday. US gold futures for December delivery fell 2% to $3,423.10 an ounce.
"Easing geopolitical tensions over the Ukraine war sent gold prices lower, following Friday's announcement that US President Donald Trump will meet Russian President Vladimir Putin on US soil"
Meanwhile, US consumer price data is due on Tuesday, with recent tariffs expected to push the core index up 0.3%, taking the annual rate of growth to 3%, above the Federal Reserve’s 2% target.
“If inflation is high, the US dollar could strengthen and make it difficult for gold to rise. However, I think gold prices will still be supported as investors buy on dips.”
The recent weaker-than-expected US jobs report has increased expectations that the Fed will cut interest rates in September. Markets are pricing in about a 90% chance of easing in September and at least one more cut before the end of the year.
XAUUSD SELL SETUPGold already on a level of supply zone after the liquidity grab , and on 1hr time frame we already seeing a change of structure and distribution schematic .. also looking from chart pattern thats also a possible head and shoulder pattern.. looking to sell if the retrace back to retest that order block
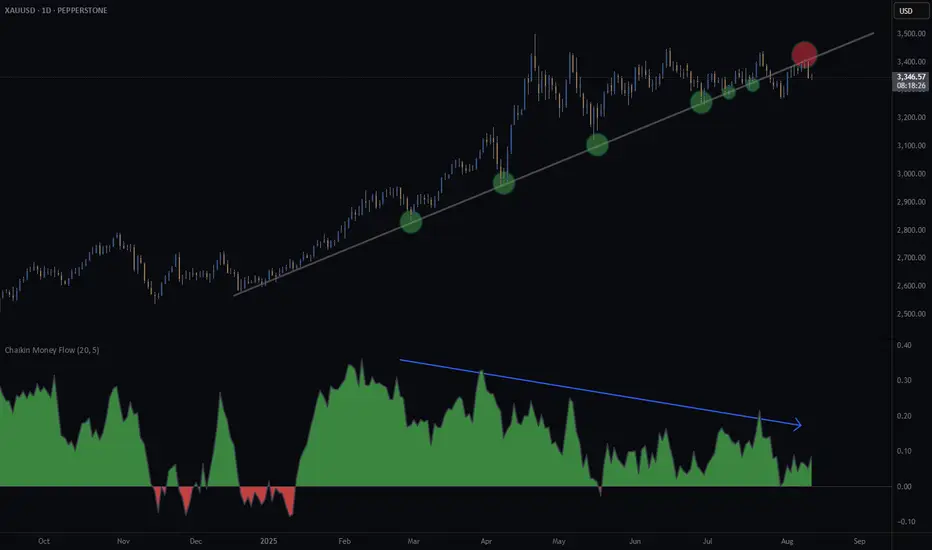
Has Gold finally topped?Since December 2024, gold has held above a key diagonal support line (see chart).
On 25 July 2025, price broke below a medium-term diagonal support — and recent action looks more like a break-and-retest than a full recovery.
The Chaikin Money Flow is also showing negative divergence, suggesting buying pressure is weakening even as price tried to push higher. That’s often a warning sign for potential trend reversals.
Could this be the start of a deeper move down, or just a pause before new highs?
What’s your take — has gold topped?
Gold next move (Read Description). Hello, Traders.
As you see gold has changed its direction after the NFP News. It was in down trend after the NFP News its flying to the my moon.
Gold is just flying and making breakouts of resistance areas. In my view gold wants to fly and it wants to hit buy side liquidity and then we can see the waterfall.
Gold can continue the trend and if price pullbacks it can touch the area 3365 - 3353 and then can fly.
Don’t trade against the trend, analyse the market before opening the trades.

THE KOG REPORT - NFP UPDATE 1H 1H:
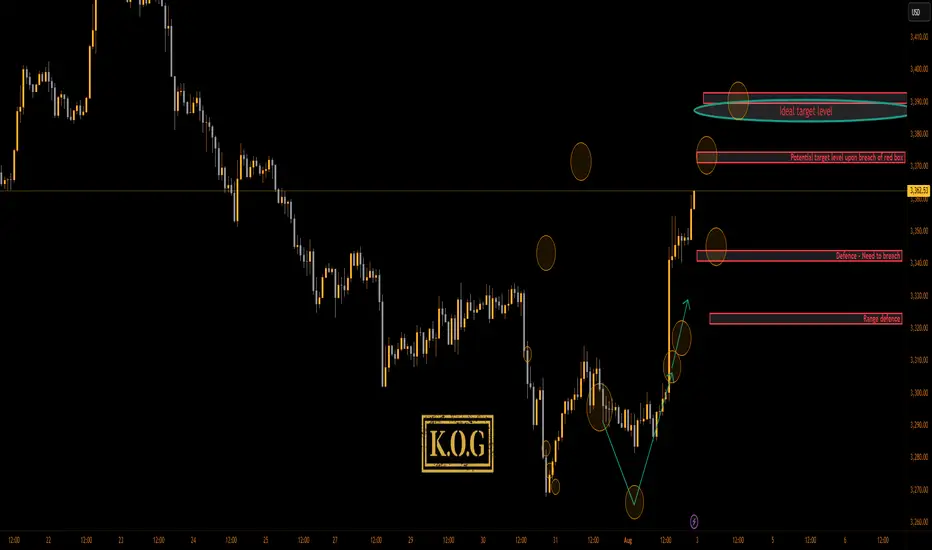
This is the chart we used last week for the FOMC and NFP KOG Reports. From the chart we can see the low was captured for FOMC and NFP didn’t give us an undercut low. We’ve kept the potential target box from the Report and for now we’ll stick with it. Red box defence is active below at the 3340-5 level and the ideal target stands above in the oval as long as we remain above the 3340 bias level.
KOG’s bias for the week:
Bullish above 3340 with targets above 3370, 3373, 3379 and above that 3384
Bearish on break of 3340 with targets below 3330, 3320 and below that 3310
RED BOXES:
Break above 3365 for 3372, 3375, 3379, 3384 and 3390 in extension of the move
Break below 3350 for 3346, 3340, 3335 and 3330 in extension of the move
Please do support us by hitting the like button, leaving a comment, and giving us a follow. We’ve been doing this for a long time now providing traders with in-depth free analysis on Gold, so your likes and comments are very much appreciated.
As always, trade safe.
KOG
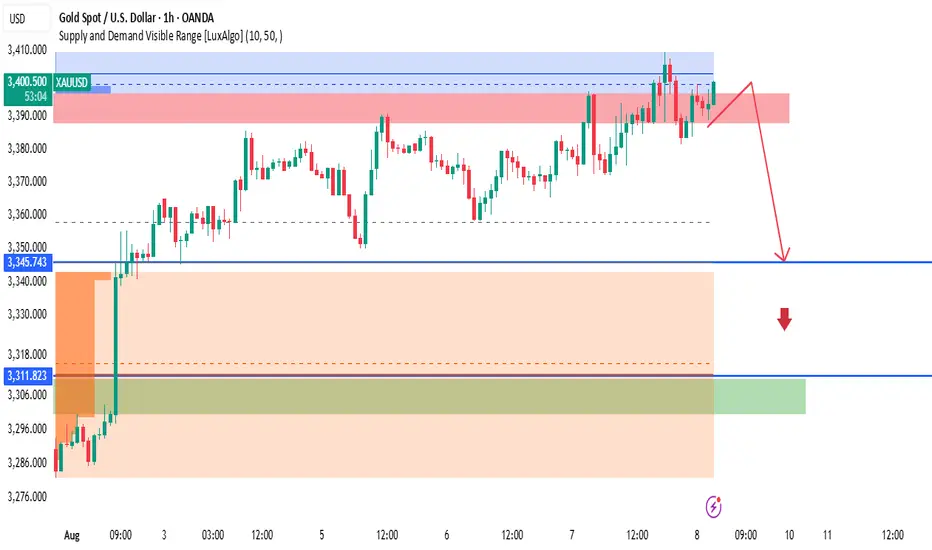
XAUUSD – Bearish Rejection at Supply Zone, Eyes on 3345On the 1H chart, XAUUSD is currently testing a strong supply zone around 3,395 – 3,400, coinciding with a visible range high-volume node. Price has shown multiple rejections from this area, suggesting that sellers are stepping in.
Key Observations:
Supply Zone: 3,395 – 3,400 (red zone) – price failing to break and sustain above.
Demand Zone: 3,311 – 3,318 (green zone) – previous accumulation area.
Mid Support: 3,345 – potential first target for short positions.
Market Structure: Multiple lower highs forming near supply; possible double top pattern forming.
Volume Profile: High selling pressure in the current region.
Plan:
Expecting a potential rejection from the supply zone with a move down towards 3,345, and if broken, further downside to the 3,311 demand zone. Stops should be placed above the recent swing high at ~3,400 to protect against false breakouts.
Bearish Confirmation:
Clear rejection candle from supply
Break of minor intraday support at 3,370
Increasing selling volume
Disclaimer:
This is for educational purposes only, not financial advice. Always do your own analysis before entering trades.
XAUUSD GOLD H1 ANALYSIS BUY NOW 3365 XAUUSD (Gold) Trade Update:
Gold is currently a buy at 3365, with an upside target of 3420. The support area is at 3348, while the resistance is seen around 3380. Traders who have been following my analysis are advised to hold their positions strongly and stay confident in the setup. This move aligns with the ongoing bullish momentum, so stay focused and manage your trades accordingly.
sell There is a strong demand zone at trade line but I found some liquidity at bottom so i going for it ,i gonna sell when it response the trade line
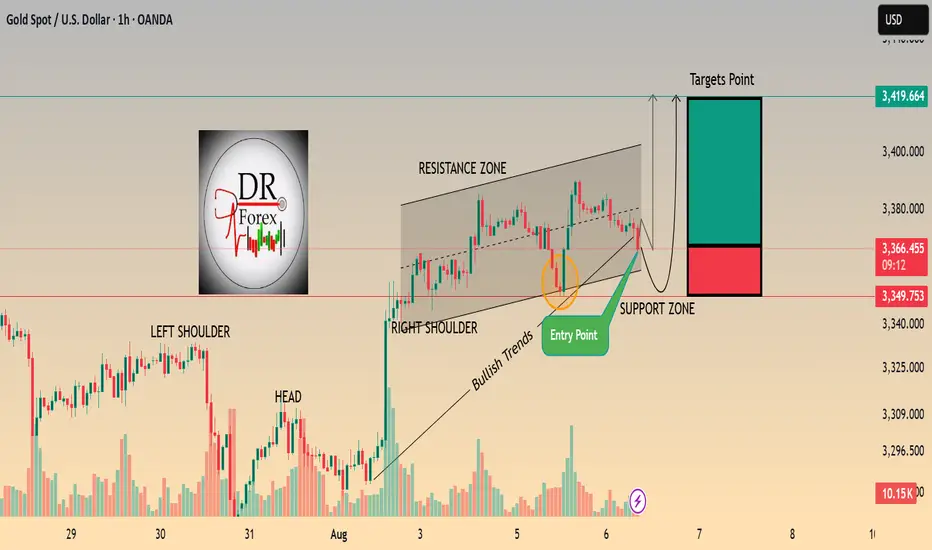
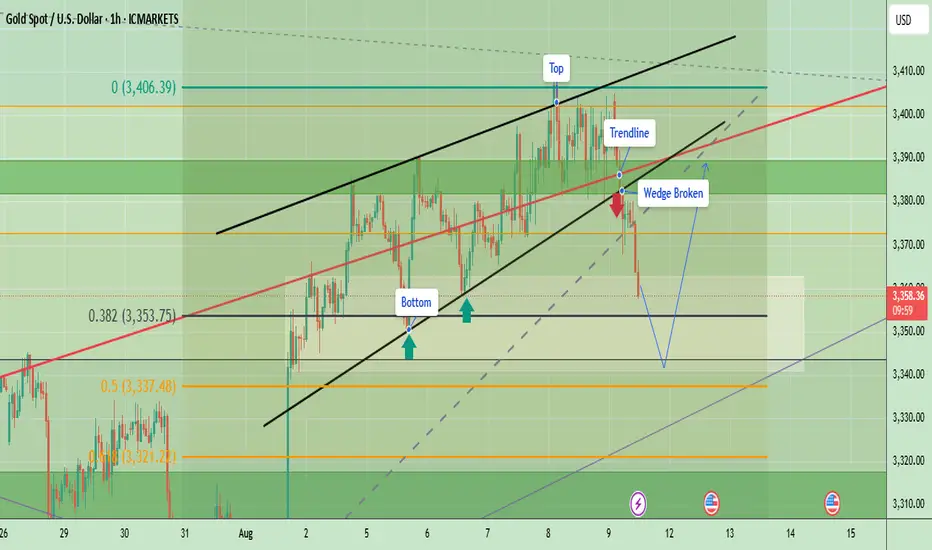
Gold Breaks Rising Wedge – Bearish Targets AheadGold recently broke down from a rising wedge pattern near the $3,385–$3,390 area, signaling potential bearish momentum. Price is currently trading around $3,360, staying below the broken wedge support and also below the main trendline. This breakdown aligns with a shift from short-term bullish to corrective/bearish movement. The trend has shifted bearish unless it reclaims $3,375–$3,388. Short-term bias favors more downside toward $3,350 and $3,342
Key Levels to Watch
- Immediate Resistance: $3,370 – $3,375 (wedge breakdown retest zone)
- Major Resistance: $3,388 – $3,395 (trendline and previous supply zone)
- Immediate Support: $3,350 – $3,352 (short-term Fib and horizontal support)
- Major Support: $3,335 – $3,340 (next demand area)
- Extended Downside Target: $3,322 (Fib 0.22 level)
Note
Please risk management in trading is a Key so use your money accordingly. If you like the idea then please like and boost. Thank you and Good Luck!
GOLD → Consolidation and correction before growthFX:XAUUSD continues to consolidate after a strong rally. The market is returning to a bullish trend, but a correction is possible before growth continues...
Gold is rising amid expectations of Fed policy easing. The market is finding support amid:
a 90.5% probability of a Fed rate cut in September, weak US employment data, and dovish comments from Fed officials.
The market is waiting for news that could determine further movement. ISM Services PMI data: strong figures could temporarily support the dollar, while weak figures could increase pressure on the USD. Questions about the Fed's independence after Trump fired the head of the BLS. Gold is maintaining its upward momentum, but its dynamics will depend on macro statistics and the Fed's response.
Technically, the focus is on the local trading range of 3385 - 3363 - 3353.
Resistance levels: 3385.4, 3433
Support levels: 3362, 3353, 3345
A retest of support and holding the price above key support could trigger a continuation of the uptrend, but it is important to pay attention to the fundamental background.
Best regards, R. Linda!

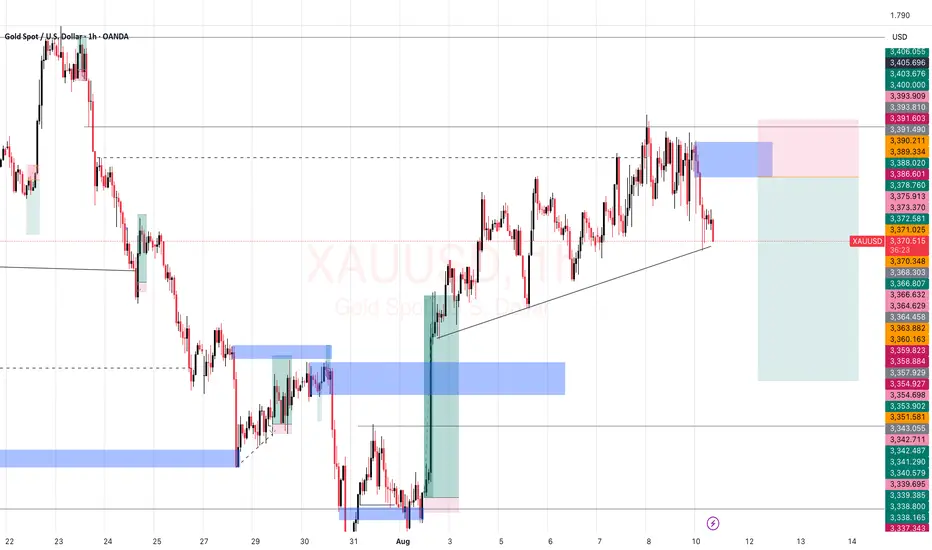
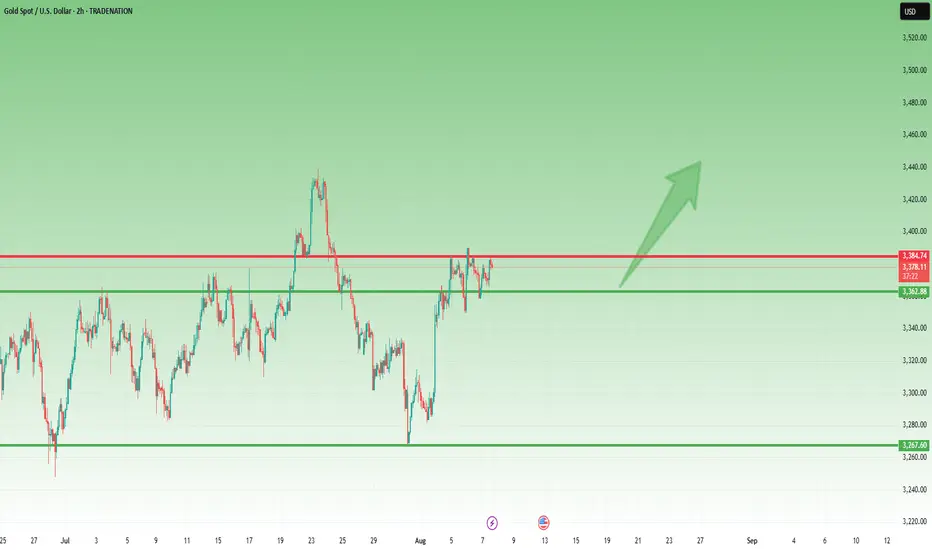
Gold – Bulls Hold the Line, Pressure Builds for Upside BreakoutIn yesterday’s analysis, I argued that following Tuesday’s reversal — which printed a strong continuation bullish Pin Bar — buyers had regained control despite the intraday pullback.
For this reason, I suggested looking to buy dips, as the structure remained constructive.
And once again, during yesterday’s session, the scenario repeated itself.
The drop toward the 3360 zone was met with renewed buying interest, keeping the bullish structure intact.
________________________________________
🔍 Technical Context – Higher Lows Building Pressure
At the time of writing, Gold is trading around 3380, a short-term resistance area that has capped gains so far.
However, the technical picture remains bullish:
Starting with Monday’s low at 3340, which came after a strong impulsive leg up, price has printed a clear succession of higher lows.
This behavior strongly suggests increasing buying pressure and builds the case for a potential breakout to the upside.
________________________________________
🎯 Trading Bias – Holding My Long Position
My bias remains bullish.
In fact, I’m currently holding a long position, entered yesterday, which is now running with a 150 pips unrealized profit.
I’m sticking with the trade, anticipating that a confirmed break above 3380–3390 could trigger upside acceleration toward my final target — a 750 pips profit objective.
________________________________________
🔄 What to Watch Next
• Daily close: A close above 3380=3385 zone would add confirmation to the bullish thesis.
• Key support: The zone around 3360 is now support.
• Breakout trigger: A move above 3380–3385 could unleash momentum buying and open the path to higher levels.
________________________________________
Let’s stay patient and let the market confirm the breakout.
Until then, the structure favors the bulls. 🚀
Disclosure: I am part of TradeNation's Influencer program and receive a monthly fee for using their TradingView charts in my analyses and educational articles.
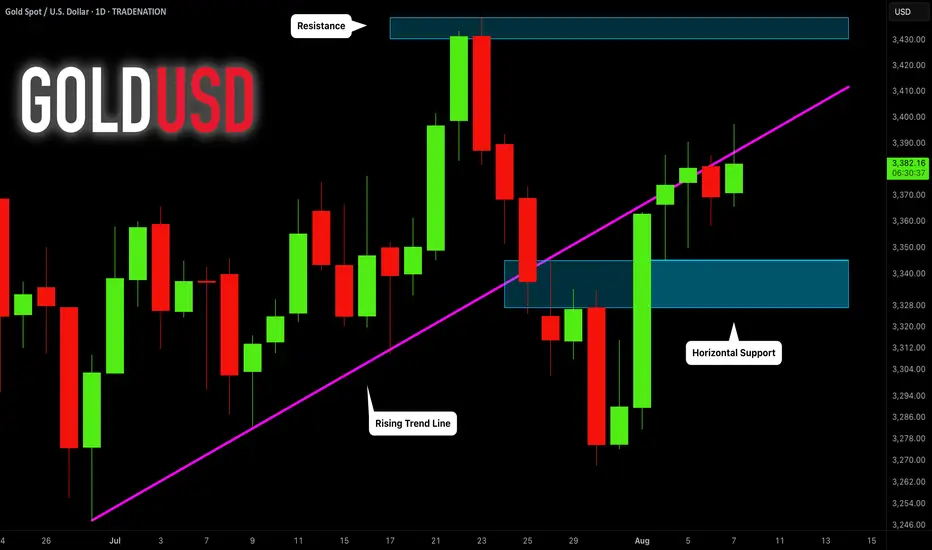
GOLD (XAUUSD): Technical Analysis Ahead of Trump
One of the important news for today is Trump speech during
the late New York session.
Here is my brief technical outlook for Gold ahead of that.
As we discussed on the yesterday's live stream, the price
is now coiling on a recently broken rising trend line that serves
as a vertical resistance now.
A bullish breakout of that and a daily candle close above
will provide a strong bullish confirmation and push the prices to 3430.
Alternatively, very bearish news today may trigger a retracement
to an underlined horizontal support.
Let's see how the market is going to react tonight.
❤️Please, support my work with like, thank you!❤️
I am part of Trade Nation's Influencer program and receive a monthly fee for using their TradingView charts in my analysis.
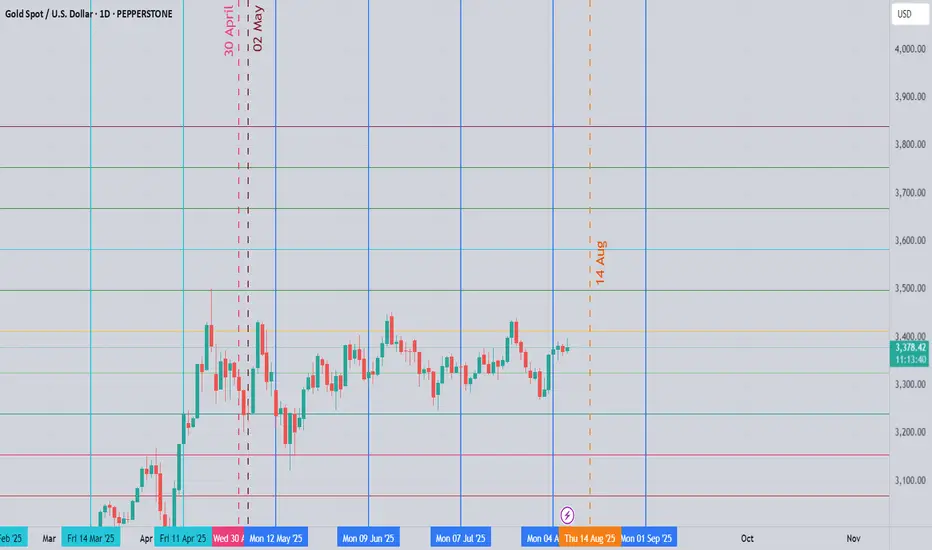
Quarterly Shit Analysis - Sept - Dec 2025 - XAUUSDMy last three quarterly analysis proved correct. In the last analysis, I predicted that gold will move within a range, it did happen.
For the new quarter, here is my new analysis. Between 14 Aug 2025 to 01 Sept 2025, I expect the following:
1- Scenario 1: Bullish Trend
Since May 2025, #XAUUSD has created good bullish indications on the Daily and Weekly Charts. Therefore, it could start a new trend.
Conditions: Gold must close a strong bullish daily candle above 3452 first , then another strong daily bullish candle above 3500. The closure of a strong daily candle above 3452 should happen between 14 Aug to 01 Sept. The closure of the daily candle above 3500 is fine to happen after September 1st.
Targets: If the conditions above are met, Gold will start a new bullish trend. The targets will be: 3668, 3750, 3840 and 4,000 or 4043.
If Gold closes a strong daily candle above 3500, the ideal support lines to buy gold will be 3451, 3400, 3364, 3330 and 3300. The best support line, if Gold makes deep retracements will be 3228 and 3162.
2- Scenario 2: Expanded Range (Likely Scenario)
The range for the previous quarterly analysis was from 2956.5 to 3500, but for most of the past months since May 1st, Gold has been moving between 3262 to 3452. It is possible that Gold remains in the wider range (2956.5 to 3500), but makes wider moves. This scenario is possible because gold already reached a historic high in April and then entered a wide range, therefore it is possible to remain in the same range for the rest of the year.
This means gold could make deeper retracements into 3228, 3168, 3092, and 3024 and then go up towards, 3330, 3364 and 3452. When it reaches 3300, 3364 and 3452, then it starts new bearish moves again.
Conditions: Gold fails to close daily bullish candles above 3500 and fails to close daily bearish candles below 2956.5. The ideal condition is if gold closes a strong daily bearish candle below 3228 or 3162 between 14 Aug to 01 Sept 2025.
3- Scenario 3: Bearish Move (Unlikely Scenario):
If Gold closes a strong daily candle below 2956, then it will start a surprising bearish trend and will move towards: 2812, 2640 and 2550. This is not a likely scenario.
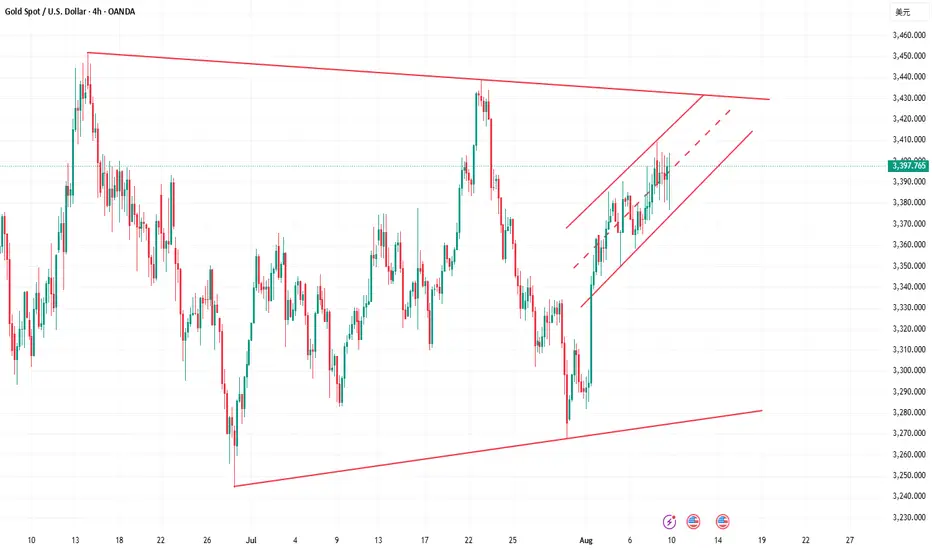
Golden opportunities are not hard to grasp.Gold Market Forecast for Next Week: Gold News Analysis: The US dollar strengthened on Friday, but it is poised for a weekly decline as weak economic data led traders to price in the possibility of more interest rate cuts this year. Investors also assessed US President Trump's Federal Reserve nominations. Gold prices experienced a roller-coaster week from August 4th to 8th, particularly during the past two trading days, when reports of gold bar tariffs sparked market panic. Despite the White House's eventual clarification of the reports, gold prices remained near the peak of uncertainty, hovering around $3,400. Gold prices tested the $3,400 mark several times this week, but despite increasing expectations of a Fed rate cut and Trump's nomination of dovish Fed officials, prices remained above that level. Until Friday's news of gold bar tariffs, gold prices surged above the $3,400 mark, reaching a high of $3,409, the highest level since July 24th. Following the panic caused by the gold bar tariffs, and despite the US clarification of the reports, analysts and retail investors remain bullish on gold prices for next week. Next week, gold prices will focus on the meeting between Trump and Putin, as well as speeches by several Federal Reserve officials on the economic outlook, and the release of the July unadjusted CPI annual rate.
Gold Technical Analysis: Looking at the current gold price trend, after Friday's pullback and negative close, will gold prices continue to decline next week, or will they rebound and rise? I believe the former is unlikely. The possibility of a new low exists, but it is low. Several attempts at the 3380 support level have failed to break. First, looking at recent price trends, gold prices have continued to rise, with higher highs and lower lows, indicating that the 3268 support level is valid. After rebounding to 3409, it began to fall, closing near 3397, demonstrating the 3380 support level and the strength of bullish sentiment. This suggests that gold prices are currently range-bound at a high level. However, given that the support level remained intact and the price closed above it, the possibility of gold prices breaking below 3380 next week is ruled out. Gold prices failed to break below 3380 on Friday as expected, and the overall trend of rising, falling, and closing lower shows that bulls still have the upper hand. However, I think it is not advisable to conclude that bulls will control the market next week. Although bulls have repeatedly tested 3410 without success, the decline has not been strong. In other words, if the bulls were truly strong, there would be no decline the next day, and the opening of next week should continue to rise. However, the current gold price has not only slowed down its rise, but also shown signs of decline, which means that bears are still holding the 3410 resistance level.
Based on the above, we recommend a low-to-long strategy for early next week, supplemented by high-to-short strategies. Regarding support, watch out for 3380. After yesterday's repeated dips, this will become a key defensive point for bulls at the beginning of next week. A test or break of this resistance level is expected. An unexpected break below would disrupt the bullish short-term trend, with a high probability of seeing 3368 or a continuation of the decline to the 3350 area. However, we prefer a move higher above 3380. Regarding resistance, watch out for the 3410 area. Although this area is at 0.382, the dividing line between 3268 and 3500, and also represents resistance from Friday's high, after adjustments and with bullish momentum, the probability of a breakout is increasing. Therefore, we recommend focusing on the 3343 area, which provides strong resistance from the previous high and also represents the dividing line at 0.236. Upon first approaching or touching this area, try to enter a medium-term short position. On the whole, the short-term operation strategy for gold next week is recommended to focus on shorting on rebounds and long on pullbacks. The short-term focus on the upper side is the 3410-3420 line of resistance, and the short-term focus on the lower side is the 3380-3370 line of support.