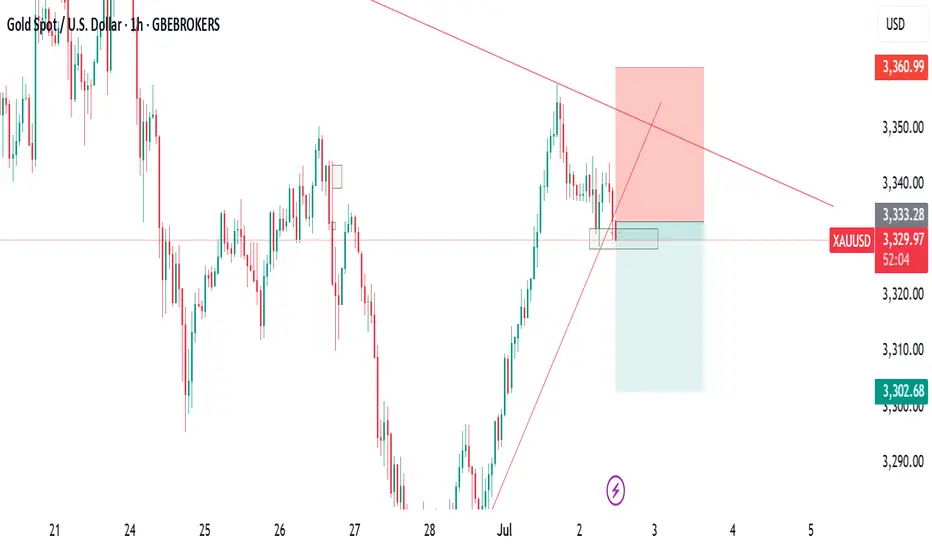
Time to shoot GoldAs you see on chart
we have reached a very srtong resistance @ 3350
SL 3355
TL 3305
RR 3:1
Good Luck
WeGo
XAUUSD trade ideas

Gold on high time frame
"Hello traders, focusing on gold, the price recently swept liquidity around $3,250 and displayed strong signals indicating a potential upward movement. The next target could be around $3,400."
If you need further clarification or have more details to discuss, feel free to share!
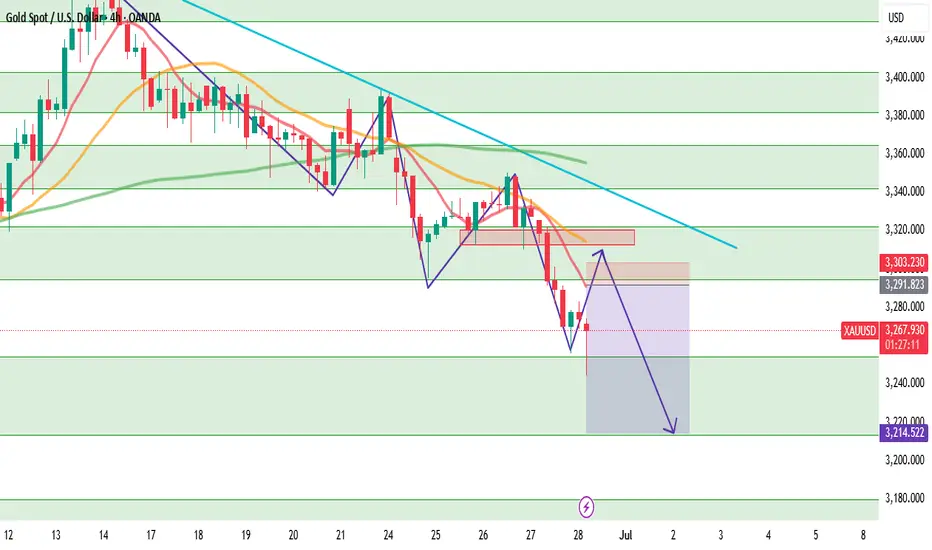
XAUUSD Analysis – June Monthly CloseGold starts the week with a weak bounce attempt after a strong bearish momentum on Friday, which pushed the market below the key 3254 support. The downtrend structure remains valid with a clear pattern of lower highs and lower lows on the 4H chart.
At the moment, price is trapped inside the 3254–3295 range. Despite the strong bearish pressure, we have yet to see a meaningful correction after the sharp drop on June 28th. This opens the door for a potential intraday pullback to test minor supply and moving average resistance near 3291–3297.
However, today is monthly candle close, which means increased volatility and possible false breakouts—especially during US sessions. Traders should be cautious with breakout traps, especially around 3305–3310, where stop hunting might occur.
The bigger picture still favors the bears unless gold manages to break and hold above the descending trendline and the EMA cluster.
📌 Trade Setup (Short Bias – Intraday Correction)
SELL zone: 3291 – 3297
SL: 3303 (Above supply & EMA test zone)
TP1: 3278
TP2: 3255
TP3: 3215
This is not a high-conviction swing setup but a tactical short based on potential rejection from previous supply and dynamic resistance. Small lot size is recommended due to the wider stop-loss and low R/R reward unless high volatility plays in our favor.
📊 Key Intraday Levels
R3: 3342
R2: 3322
R1: 3295
Pivot: 3254
S1: 3214
S2: 3180
S3: 3123
GOLD GOLD ,different broker different candle close on different time frame, this is dishonesty and it will affect the structure of the market.
GOLD GOLD ,different broker different candle close on different time frame, this is dishonesty and it will affect the structure of the market.
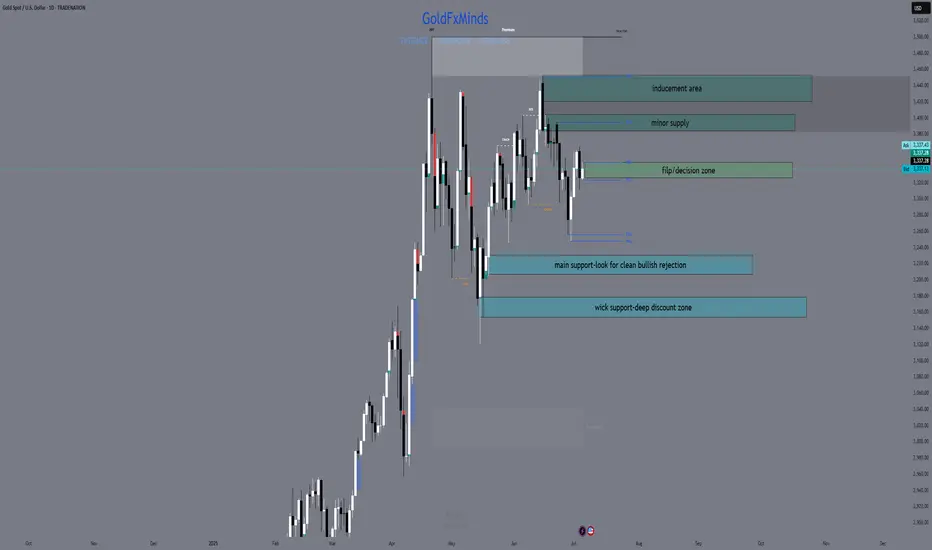
XAUUSD Daily Outlook – July 7, 2025👋 Hey traders, welcome to the fresh week! After the Friday selloff, gold is approaching a key inflection point. Let’s break down what’s happening on the Daily chart and how to approach it with clarity — no guessing, just precision.
Stay focused. The real opportunity is always in how you prepare.
🌍 Macro + Sentiment
Market remains sensitive to yield shifts and broader risk sentiment (BRICS summit also continues)
Price remains elevated in premium territory after months of vertical flow — but structure is finally showing re-accumulation or re-distribution?
📈 Daily Bias
Neutral to bearish until the 3330–3344 zone fully flips cleanly as support
Structure shows lower highs, strong wick rejections in premium zones, and a need for confirmation
🧠 What the chart tells us:
Price is compressing between a D1 FVG (below) and unfilled premium OB (above)
Friday’s low wicked into a small imbalance — but was not a clean tap into the main OB
RSI is midrange, EMAs are flat, and momentum is indecisive
We're either gearing up for a bullish FVG reclaim or prepping for a deeper drop into discount
⚠️ Key Zones to Watch
🔵 Support Zones (Buy Zones)
3230–3208
→ D1 Fair Value Gap + unmitigated bullish OB + discount pricing
→ Valid only with clean bullish rejection. High interest for sniper entries if price returns.
3170–3154
→ Untapped daily OB + historical support wick + aligns with deeper discount zone
→ Stronger bounce zone if 3230 fails. Confluence with fib retracement & RSI likely oversold here.
🔴 Supply Zones (Sell Zones)
3420–3450
→ Premium FVG + D1 OB combo + previous bearish rejection wick
→ High probability inducement area. Valid only if price fails to hold 3344 flip.
3388–3402
→ Minor supply + internal structure break level
→ Short-term reaction area. Lower conviction but watch for rejection if price overextends.
🟡 Decision / Flip Zone
3327–3344
→ Former support now turned resistance
→ If this zone flips bullish and holds, bias shifts to continuation. If rejection occurs, confirms retracement deeper into discount.
✅ Conclusion
The market is entering a decision week — no rush. Let the chart guide you.
Clarity comes not from prediction, but preparation. This chart isn’t hindsight — it’s a live framework.
✨ Final Thought
If this chart feels clear, that’s because it was built with intention — not after the move, but before it happens.
The difference between noise and precision is structure.
And we don’t guess — we prepare.
🚀 If you appreciate detailed, real-time structure like this, hit follow and join the traders who value clean execution over hype.
💬 Drop your bias below — bullish or bearish this week?
📢 Disclosure: I use Trade Nation's broker feed on TradingView and I'm part of their influencer program.
📉 This is educational content and not financial advice.
U.S. stocks are closed, how to operate gold volatility📰 News information:
1. Geopolitical situation
2. Tariff implementation and interest rate cut bill
📈 Technical Analysis:
Gold has maintained a volatile pattern recently, lacking a sustained unilateral trend. The unclear short-term direction of DXY has limited the volatility of gold. The market has repeatedly shown a mixture of high-rise decline and downward recovery. It is unable to effectively break through the previous high and lacks the momentum to break downward. The short-term pressure during the day is concentrated on the 3340-3345 line, and the upper middle track is at 3350. If it fails to effectively break above 3350, then gold may fall further. On the contrary, if it can stand above the middle track 33350, then gold may rise further. The short-term support below is near the 3323 line. If it fluctuates during the day, maintain a high-altitude low-multiple cycle.
🎯 Trading Points:
SELL 3340-3350
TP 3330-3320-3310
BUY 3320-3310
TP 3340-3350
In addition to investment, life also includes poetry, distant places, and Allen. Facing the market is actually facing yourself, correcting your shortcomings, confronting your mistakes, and strictly disciplining yourself. I hope my analysis can help you🌐.
FXOPEN:XAUUSD PEPPERSTONE:XAUUSD FOREXCOM:XAUUSD FX:XAUUSD OANDA:XAUUSD TVC:GOLD
Excellent NFP sessionAs discussed throughout yesterday's session commentary: "My position: Gold is Trading within #3,350's belt which represents crossroads for the Short-term. Either #3,362.80 - #3,368.80 break-out to the upside towards #3,377.80 strong Resistance, or #3,342.80 - #3,352.80 break-out to the downside towards #3,327.80 Support. Current Price-action is ideal for Scalping since I don't expect major movement until tomorrow's NFP numbers."
Firstly I have re-Sold Gold almost all Wednesday's Asian session from #3,360's (Wednesday - Thursday) closing my orders on #3,352.80 then re-Bought Gold with set of aggressive Scalping orders from #3,345.80 towards #3,352.80. As NFP numbers were delivered, I have waited for decline to find a Support and Bought Gold aggressively from #3,312.80 and closed on #3,320.80. Later on, #3,332.80 Sold again (#4 aggressive Scalps) and closed on #3,327.80 and with mentioned order finalized excellent NFP session.
Technical analysis: The Short-term Price-action is Trading within #3,327.80 - #3,352.80 belt as I can easily spot idle movements on Hourly 4 chart with #3,327.80 Support bounces but regardless, Gold is Trading within my predicted values. Spot though on the Hourly 4 chart how Technicals are showcasing different / mixed values, and Gold is isolated within Neutral Rectangle with detectable Higher Low’s Upper and Lower zone. This is what I described on my commentary as an Bearish Divergence (BD) and is usually a first alert that the trend might be pointing to even stronger takedown. See how the very same divergence has Traded since November - April. On the November #12 Low, the Price-action started rising on an Ascending Channel but only once the structure formed a new Low. Then again after mentioned Low’s, Gold started rising until the next Bullish Divergence (which means, after local Low's tested, Gold engaged parabolic uptrend). I am monitoring closely #MA50 on Daily chart which is pointer for new #1 - #3 Month cycle.
My position: I will take no new orders as I am Highly satisfied with my returns / also it is holiday in U.S. as I do not expect major moves throughout the session (only ranging candles with Low Volume). Enjoy the Profits and have a great weekend!
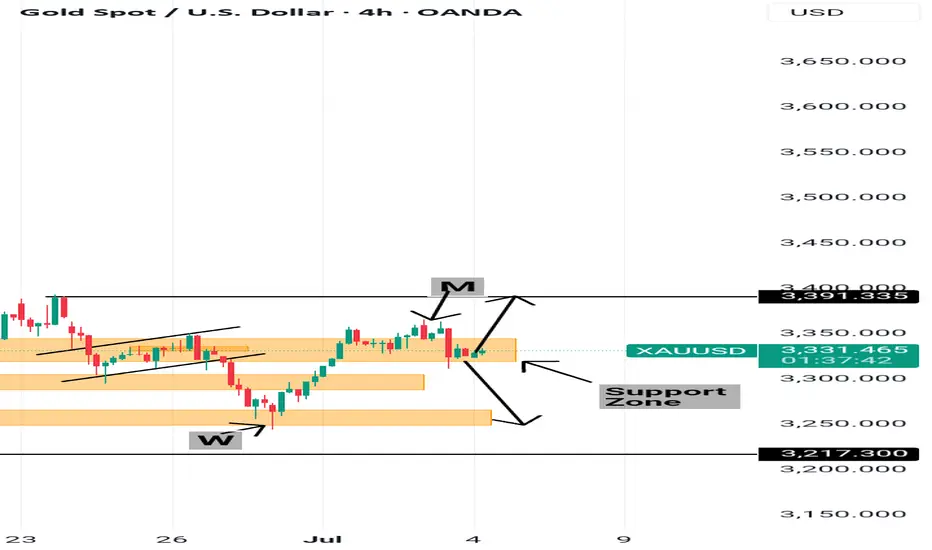
Neutral probabilities Gold seems to be forming the right shoulder of and inverse head and shoulders pattern (IH&S) which would thus translate to a push upwards to 3391.355 to complete the pattern.
Equally there is a bullish channel with a clear M at the top where the bearish movement began.
There is a consolidation without a clear indication of whether its a continuous bearish pattern that will drop all the way to 3249.416 or it form a W formation.
Only time will tell.
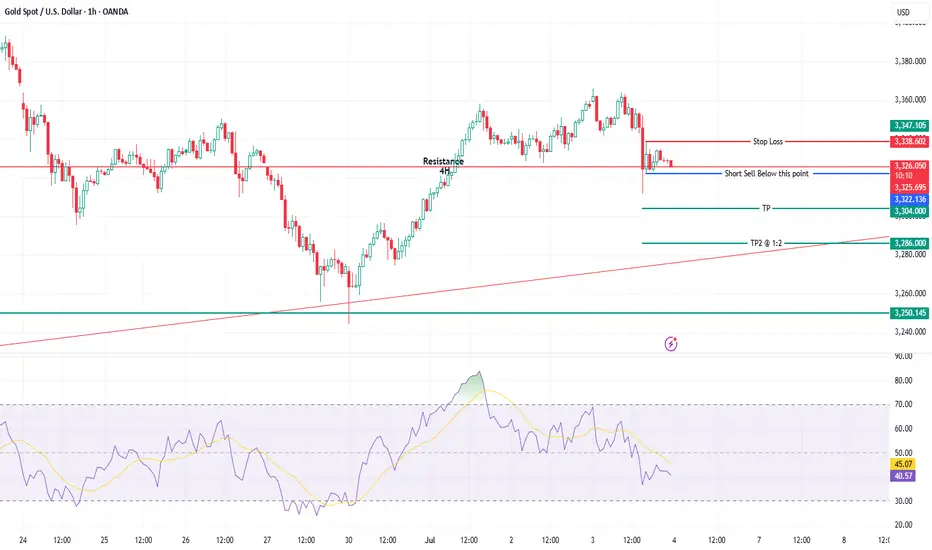
XAUUSD Glitter is fading away. Gold has been under pressure for quite a few days. In the day it shed a handful of money from its value. In this process it had an intraday penetration of 4 hour support and resistance level. Albeit it retraced back quickly but it is trading in the range. If it brakes the range downward we may initiate the short sell.
For convenience all the levels have been marked on the chart.
Have profitable trading
GOLD - SHORT TO $2,800 (UPDATE)NFP today pushed Gold prices down. As I've shown you all plenty of times throughout the years now, fundamentals ALWAYS follows our technical bias.
Start learning to read the charts & stopping watching the news. Everything will fall into the right place for you.
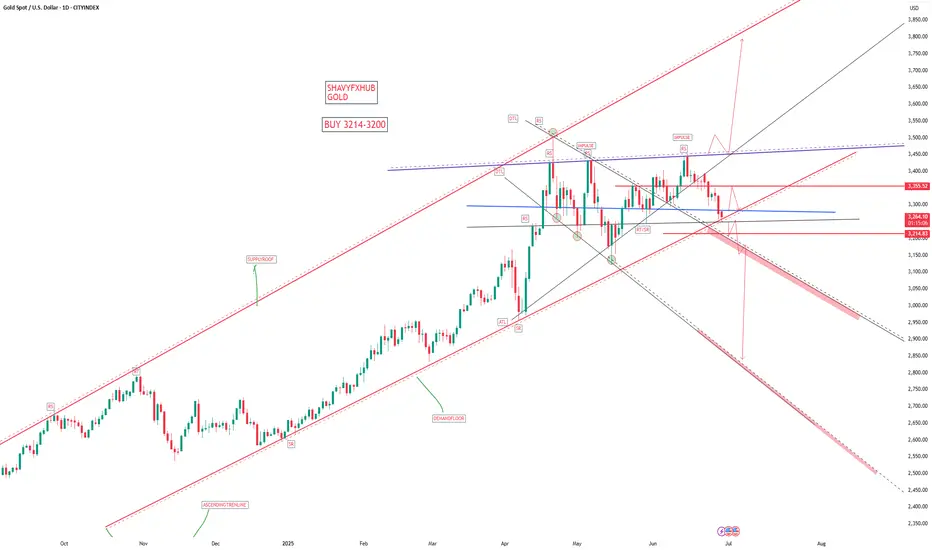
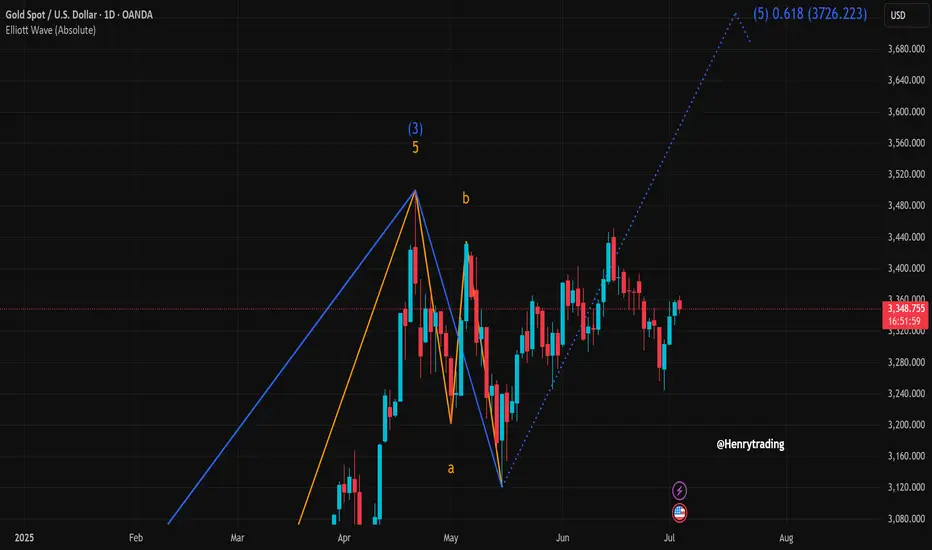
Elliott Wave Analysis of XAUUSDOn the daily chart of XAUUSD, we are witnessing a clearly defined Elliott Wave structure, with the potential formation of an extended wave (5) targeting the $3,726 region — aligned with the 0.618 Fibonacci extension. This is a key technical signal that could capture the attention of both long-term investors and strategic swing traders.
1. Elliott Wave Overview:
Wave (3) concluded at the peak around $3,365, followed by a textbook a-b-c corrective pattern.
Waves "a" and "b" are clearly identifiable, with wave "c" appearing to have completed.
The current price action suggests a rebound from the bottom of wave c — a strong indication of a possible start to wave (5).
2. Wave (5) Target Zone:
The Fibonacci 0.618 extension projects a target near $3,726 — a significant price level the market could approach if bullish momentum builds up.
This level also serves as a psychological resistance zone, so expect possible volatility as the price nears this area.
3. Price Behavior & Confirmation Signals:
Recent candlestick formations reveal renewed buying interest, with multiple bullish candles showing long bodies and lower wicks.
Holding above the key support around $3,300 is crucial for confirming the formation of an uptrend.
A breakout above the $3,365 high (wave (3) peak) would be a strong signal that wave (5) is in motion.
4. Suggested Trading Strategies:
Buy limit: Consider entries around the $3,310 – $3,320 support zone on a retest.
Buy breakout: Trigger entries if price breaks decisively above $3,365 with strong volume.
Take profit: Gradually scale out positions around the $3,680 – $3,726 area.
Stop loss: Place stops below the wave c bottom — under $3,245.
5. Conclusion:
XAUUSD is currently in a sensitive phase with a high probability of a bullish breakout. The Elliott Wave structure shows that there is still considerable upside potential. However, traders should maintain strict risk management, as wave (5) formations often involve significant price swings.
Gold next target NFP News As you know, today is NFP news and my target in the news is that gold should go to 3391 which is becoming the best position for a buy. If you are satisfied with my analysis, then you can play and this is my analysis.
GOLD The ADP Non-Farm Employment Change for July 2,have a forecast of 99,000 jobs, compared to the previous month’s very weak result of 37,000—the lowest since March 2023. The ADP National Employment Report is a monthly indicator that tracks changes in non-farm private sector employment in the US, based on anonymized payroll data from ADP’s clients, covering about one-fifth of all US private employment.
Who is responsible?
The report is produced by the ADP Research Institute, part of Automatic Data Processing (ADP), in partnership with the Stanford Digital Economy Lab.
Why it matters:
The ADP report is viewed as a leading indicator for the official Non-Farm Payrolls (NFP) report from the Bureau of Labor Statistics (BLS), released two days later.
It provides early insight into US private sector job growth and labor market health, and significant deviations from forecasts can move financial markets.
Note that the ADP report covers only private sector jobs, not government employment, so its numbers can differ from the official NFP.
Summary Table:
Report Date Forecast Previous Responsible Department
July 2, 2025 99,000 37,000 ADP Research Institute (ADP)
In summary:
The ADP Non-Farm Employment Change report, produced by the ADP Research Institute, forecasted a rebound to 99,000 jobs in June after a very weak 37,000 in May, providing an early signal on the health of US private sector employment.
(2)US10Y drops to historical low to 4.193% and currently broken 1hr descending trendline at 4.281% ,4.3% resistance will be watched for breakout buy bond buyers.
(3) DXY Key Points:
The DXY measures the US dollar’s strength against a basket of six major currencies: the euro (57.6% weight), Japanese yen (13.6%), British pound (11.9%), Canadian dollar (9.1%), Swedish krona (4.2%), and Swiss franc (3.6%).
After peaking near 110.075$ in January 2025, the index has softened , trading near 96.600-101.966.on weekly TF 101.966 was a retest to broken weekly demand floor .
The dollar’s decline reflects market expectations of Federal Reserve rate cuts later in 2025, easing inflation pressures, and some geopolitical easing.
the DXY to rebound will henge and depend on Fed policy and global economic conditions.
GOLD buyers are watching for the direction of trade ,
Chinese Demand and Policy:
China is one of the largest gold consumers and holders. Domestic demand, central bank gold purchases, and monetary policy in China heavily influence XAU/RMB. If China’s economy slows or trade tensions with the US worsen, demand for gold as a safe haven may increase, supporting XAU/RMB even if the dollar is strong.
China's recent opening of the Shanghai Gold Exchange's (SGE) first offshore gold vault in Hong Kong on June 26, 2025, represents a significant development with potential, albeit indirect, implications for XAU/USD (gold priced in US dollars) .
Key Aspects of the Hong Kong Gold Vault:
Location and Operation: The vault is located in Hong Kong and operated by Bank of China's Hong Kong unit .
Yuan-Denominated Trading: All transactions and settlements in the vault are denominated exclusively in yuan, either via cash or physical bullion delivery . Two new yuan-denominated gold trading contracts were launched alongside the vault .
Strategic Objectives:
Increased Influence on Gold Pricing: China, as the world's leading gold producer and consumer, aims to gain greater control and influence over global gold pricing mechanisms .
Yuan Internationalization: The initiative seeks to accelerate the international usage of the yuan, supporting China's broader de-dollarization efforts . This allows China to import gold in yuan, reducing reliance on the US dollar for commodity trading .
Enhanced Global Reach: The vault expands the SGE's physical infrastructure beyond mainland China, creating a new gateway for international gold trading and solidifying Hong Kong's role as a key financial hub .
Physical Settlement: It facilitates the physical settlement of gold contracts outside mainland China .
Implications for XAU/USD:
While the new vault directly promotes yuan-denominated gold trading, its implications for XAU/USD are primarily indirect and long-term:
De-dollarization Efforts: By promoting yuan-denominated gold trading, China is actively working to reduce global reliance on the US dollar in commodity markets . If successful, a more diversified global gold trading landscape could gradually diminish the dollar's sole influence over gold prices, potentially leading to less direct inverse correlation between the dollar and gold .
Increased Demand and Liquidity: The vault aims to attract more international participants to yuan-denominated gold markets, potentially increasing overall gold demand and liquidity in the Asia-Pacific region . While this demand is primarily yuan-driven, a generally stronger global gold market could indirectly support XAU/USD .
Price Discovery: The establishment of offshore yuan-denominated gold trading creates an alternative price discovery mechanism . This could, over time, offer a benchmark that is less directly tied to dollar-centric factors, which might subtly influence XAU/USD by diversifying global pricing inputs .
Market Fragmentation vs. Integration: This move could be seen as a step towards fragmenting the global gold market by creating a distinct yuan-based ecosystem, or conversely, as a way to integrate China more deeply into the international gold market by offering new access points . The ultimate effect on XAU/USD would depend on whether this leads to more cohesive or more disparate global gold price movements.
In summary: China's new Hong Kong gold vault is a strategic move to boost the yuan's role in commodity trading and increase China's influence in global gold pricing. While it primarily impacts yuan-denominated gold, its long-term success in de-dollarization efforts could indirectly, over time, alter the dynamics and correlations currently observed in XAU/USD.
XAU/USDPrice action trading is a methodology where traders make decisions based on the interpretation of actual price movements on a chart, rather than relying primarily on lagging indicators. It involves observing and analyzing candlestick patterns, trend lines, support and resistance levels, and volume to identify potential trading opportunities and manage risk. The focus is on understanding the story the market is telling through its price behavior.
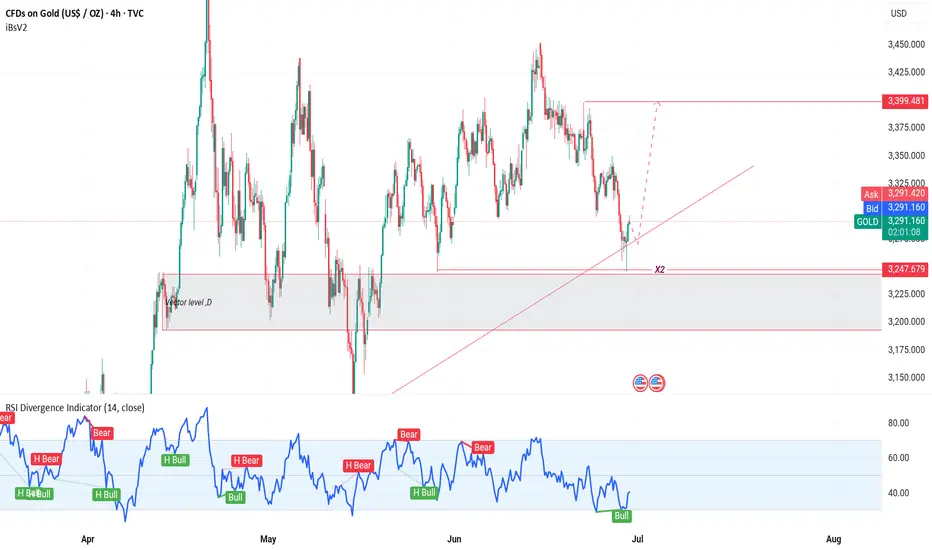
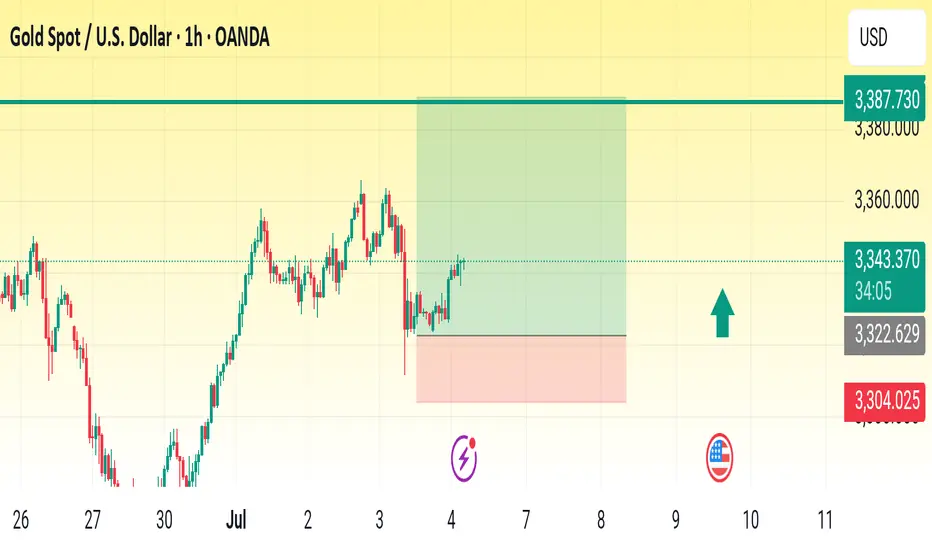
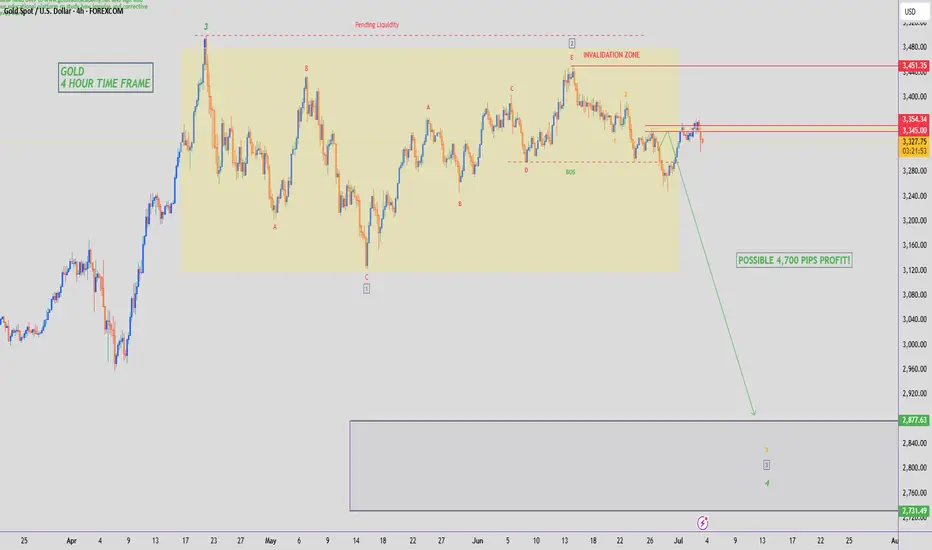
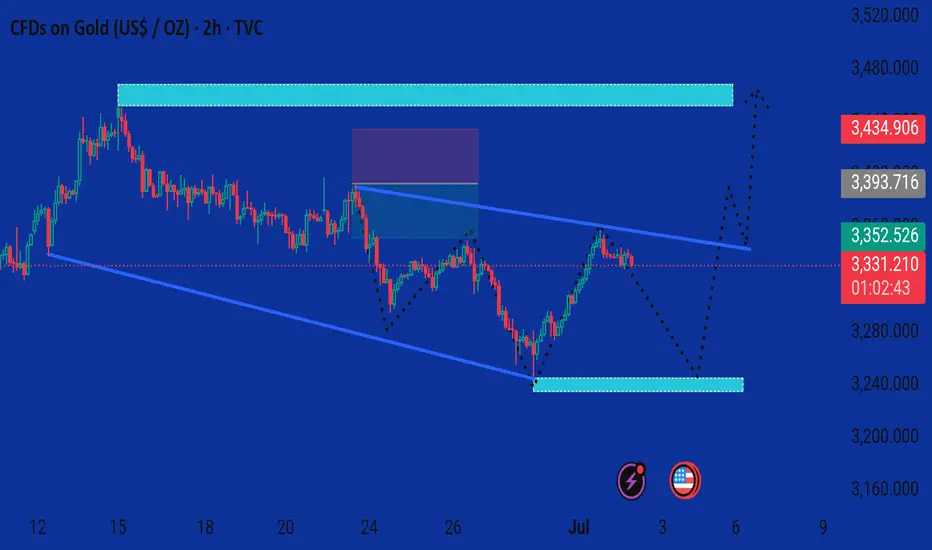
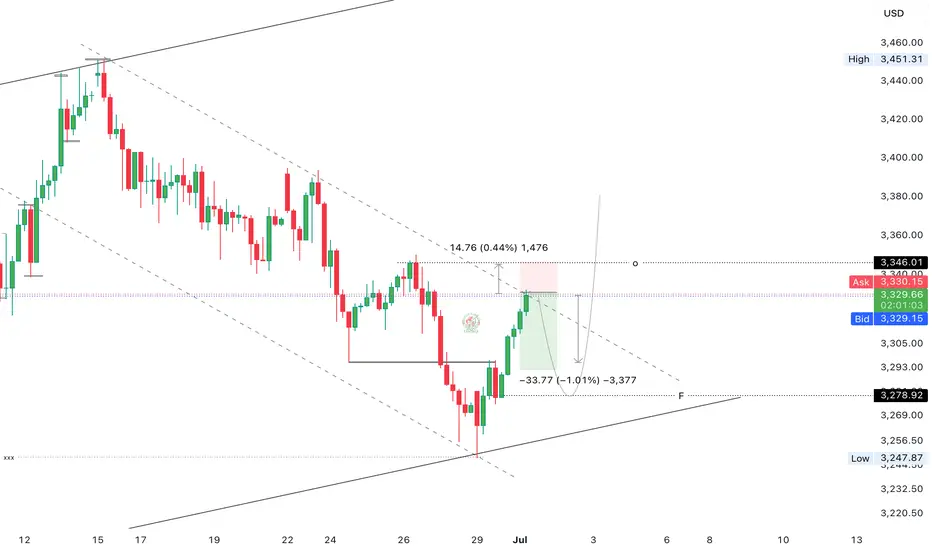
Xauusd market This chart presents a bullish analysis for Gold (CFDs on Gold, 2h timeframe), with the price currently at 3,332.110, showing a slight decline of 0.20%.
Key Observations:
1. Support Zone (~3,250):
A strong demand zone is highlighted near 3,250, where price previously rebounded.
This zone is marked with icons (lightning bolt and U.S. flag), possibly indicating high-impact news or events expected around that area.
2. Current Price Action:
Price recently broke a downtrend line and rallied.
Currently pulling back near the 3,330 level, indicating a potential short-term retracement.
3. Projected Scenarios (Dotted Lines):
Primary Path (Bearish Short-Term → Bullish Mid-Term):
Price may dip back into the 3,250 support zone.
From there, a bullish reversal is anticipated, targeting:
First resistance: ~3,400
Second resistance: ~3,450
4. Resistance Zones:
Two clear supply zones are marked:
~3,400: First target zone after a bounce.
~3,450: Final target zone if bullish momentum continues.
---
Summary:
The chart suggests a potential bullish continuation after a pullback. A retracement to around 3,250 could provide a strong buying opportunity with upside targets near 3,400–3,450, depending on price action and upcoming news catalysts.
Would you like a trading plan based on this setup (e.g., entry, stop-loss, targets)?
GOLD Massive Short! SELL!
My dear followers,
This is my opinion on the GOLD next move:
The asset is approaching an important pivot point 3350.4
Bias - Bearish
Safe Stop Loss - 3363.2
Technical Indicators: Supper Trend generates a clear short signal while Pivot Point HL is currently determining the overall Bearish trend of the market.
Goal - 3328.2
About Used Indicators:
For more efficient signals, super-trend is used in combination with other indicators like Pivot Points.
Disclosure: I am part of Trade Nation's Influencer program and receive a monthly fee for using their TradingView charts in my analysis.
———————————
WISH YOU ALL LUCK
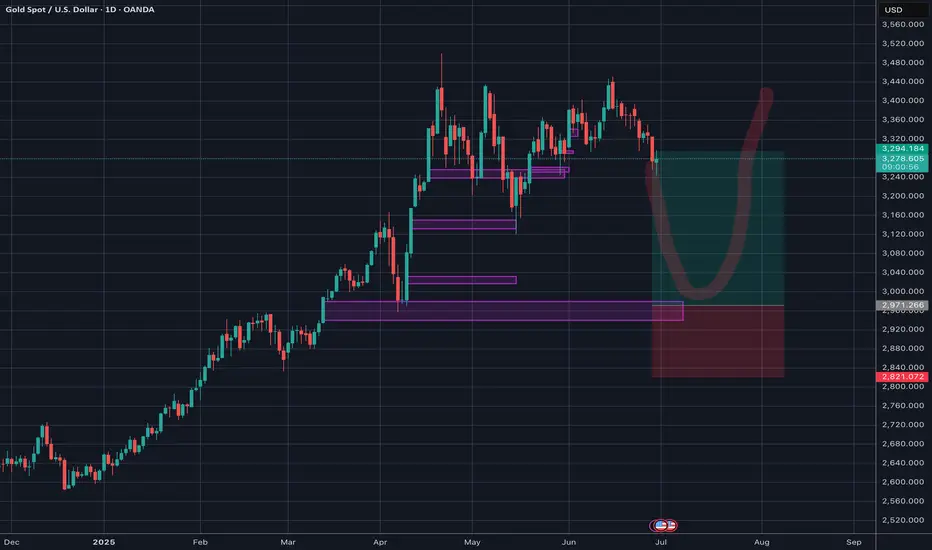
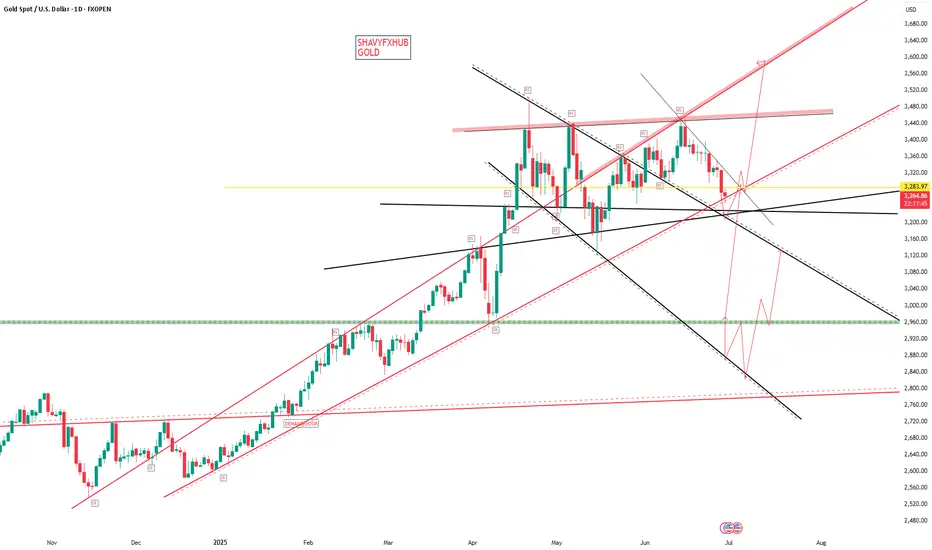
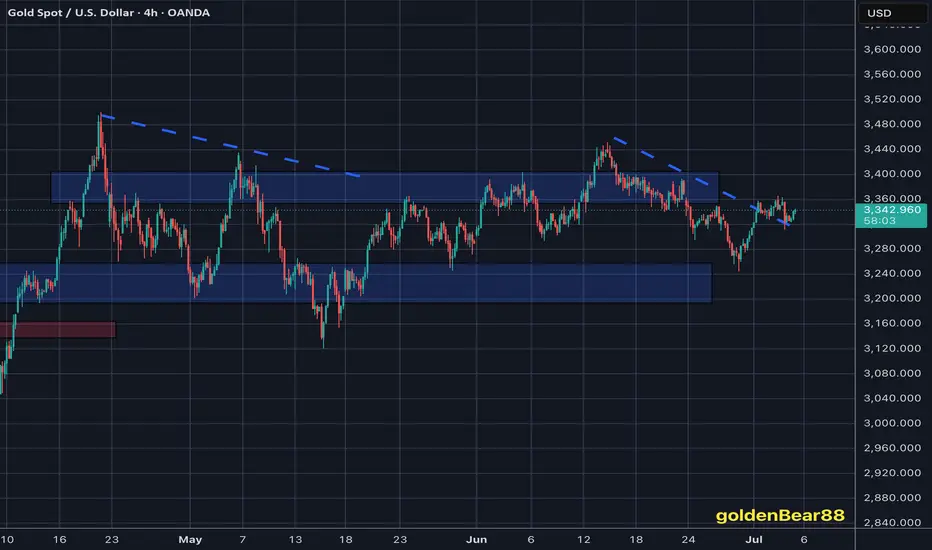
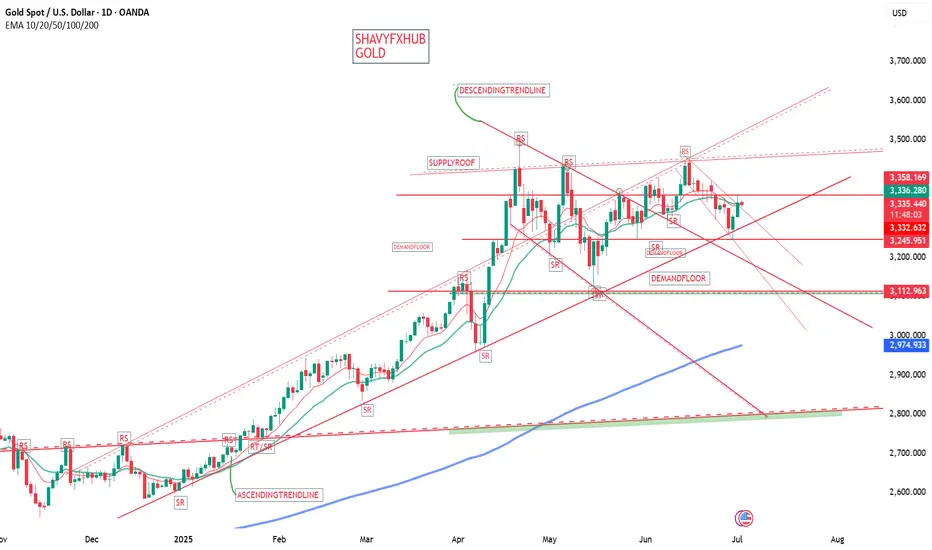
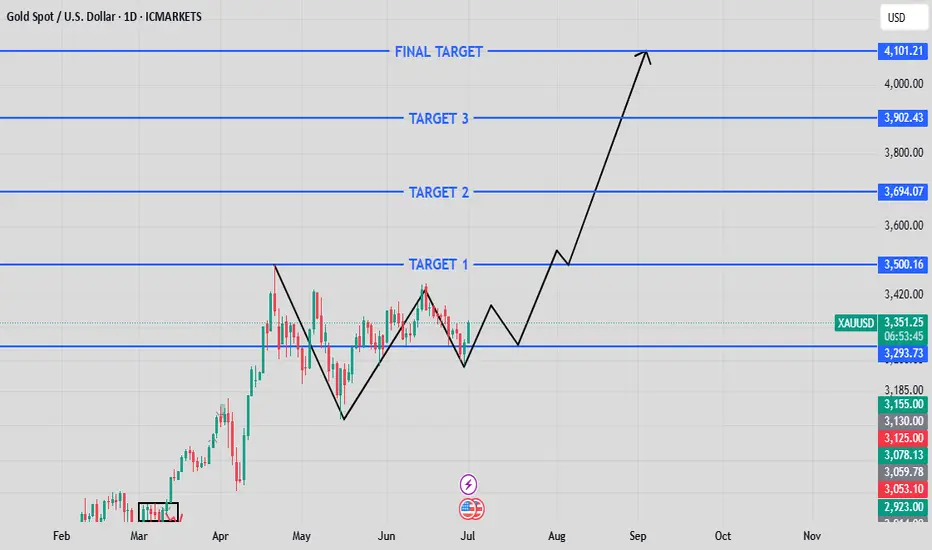
XAUUSD MONTHLY/WEEKLY ANALYSISWhat we’re seeing here on **XAUUSD (Gold Spot)** is a **classic higher-timeframe accumulation pattern** followed by **a potential explosive bullish leg**.
After a strong move up in April, we witnessed a **textbook V-reversal**, consolidation, and now — **a higher low** forming around the \$3,290 zone. That’s our key demand level. 💥
✅ If this higher low holds and price starts pushing with volume, we may be gearing up for a **multi-phase breakout** with the following potential targets:
🔹 **Target 1:** \$3,500
🔹 **Target 2:** \$3,694
🔹 **Target 3:** \$3,902
🎯 **Final Target:** \$4,101+
This isn’t just a short-term scalp setup. This is a **position trade opportunity** for those with patience and precision. The structure is clean, momentum is returning, and the levels are marked.
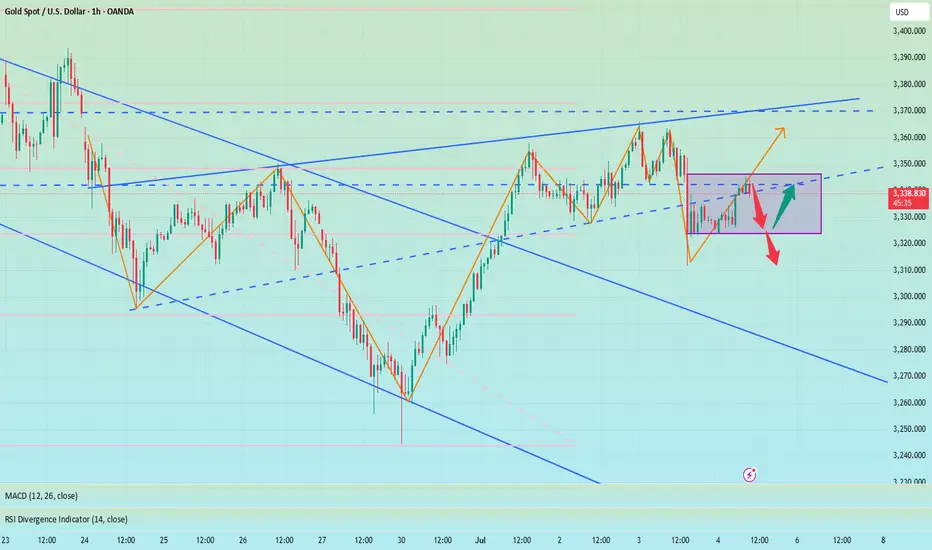
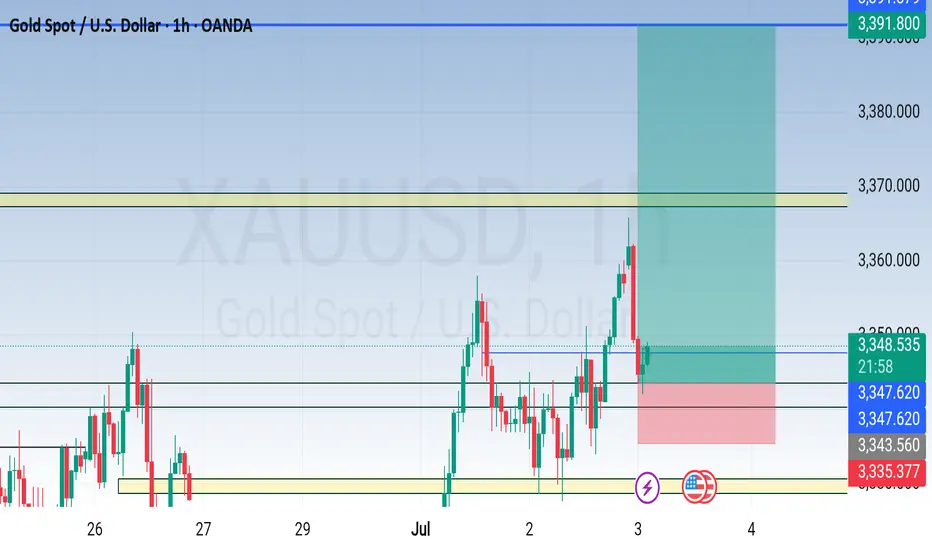
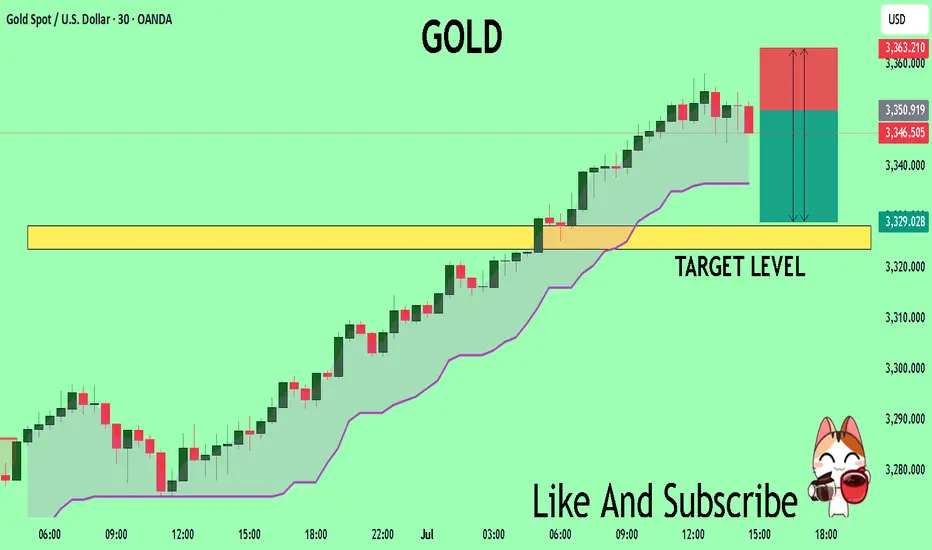
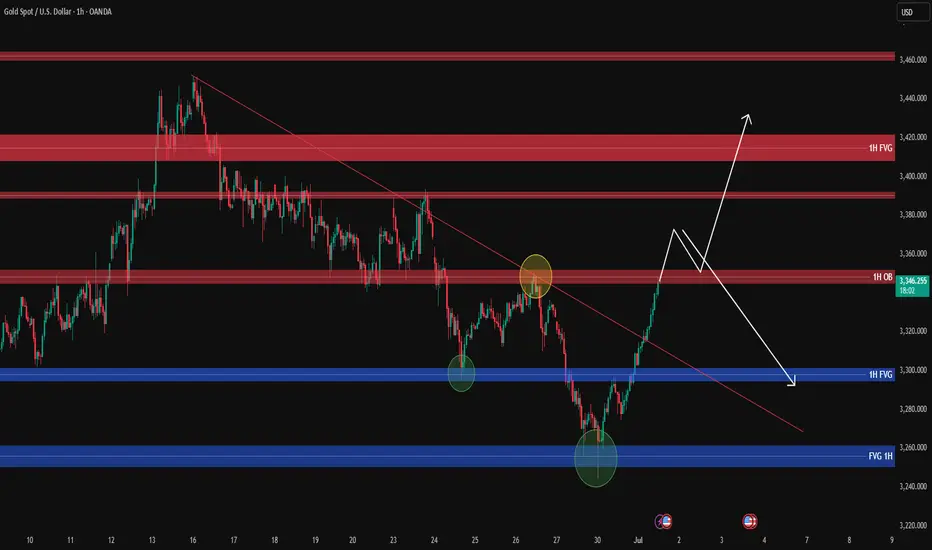
XAUUSD analysis - 1H FVG and OB SetupsBack after a few days with our gold update.
We’re on the 1-hour timeframe, and price has been respecting our levels perfectly, especially in the two blue boxes (1H FVGs) where we got precise reactions. These reactions are marked with green circles, showing areas where we entered on lower timeframes like 3m or 5m.
Currently, gold is sitting at a key area marked with a yellow circle (1H supply zone / resistance). If this area breaks strongly without a fakeout, we could potentially target higher resistance zones above.
Stay sharp and ready to catch clean reactions.
Key levels for confirmation:
3345-3358 (current important zone)
3300 (major 1H OB / support)
3420 (major 1H OB / resistance)
—
📊 ProfitaminFX | Gold, BTC & EUR/USD
📚 Daily setups & educational trades
📱 IG: @profitamin.fx
Gold Completes Move to 3330s, Poises for Second-Half ShiftGold market price fills through 3330's from 3270's, aligning with the second-half of the year’s candle formation. A bullish build-up is being poised around 3296, yet caution remains as price trades within a bearish channel between 3250’s and 3330’s. A breakout could signal a shift in market sentiment going forward. follow for more insights ,comment for more opinions , and boost idea
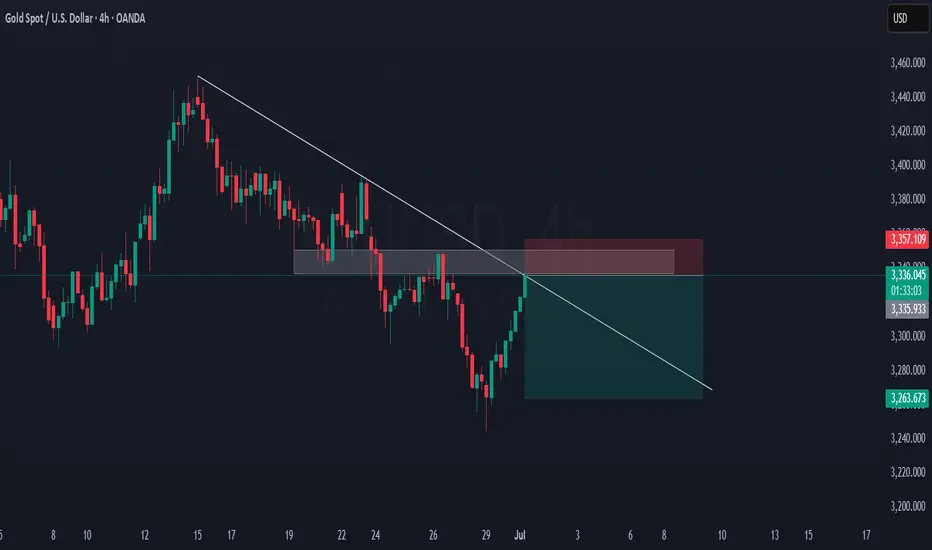
GOLD Sell OpportunityHey guys. Longer term outlook on Gold today.
The 4h chart is showing a short opportunity. You can see that it is following the trendline and price came back to test an area of interest.
I will suggest to look for entries on the 15min chart.
Good luck!