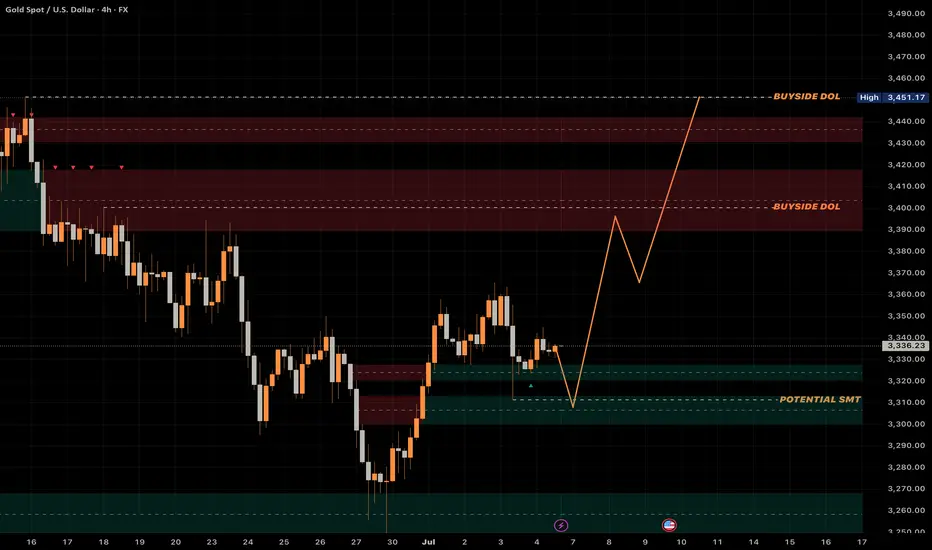
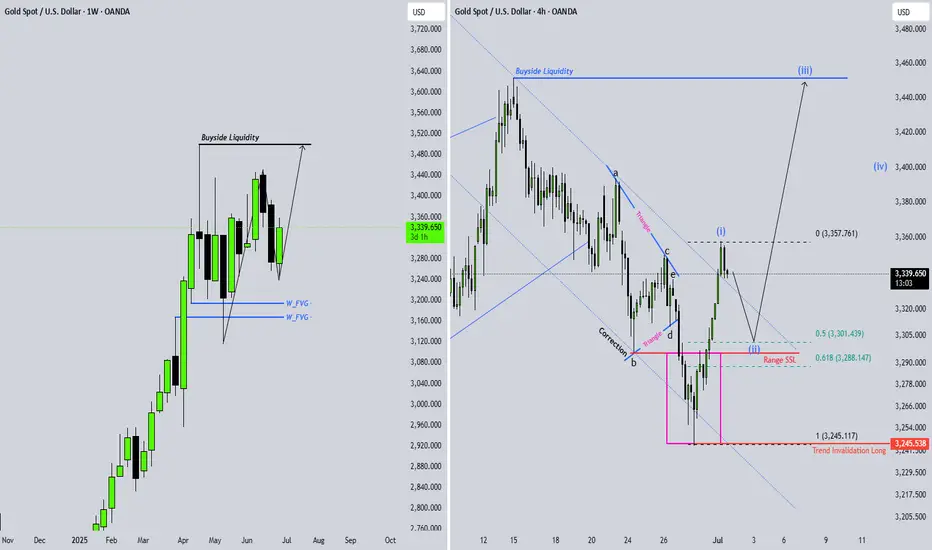
Weekly Bias - XAUUSD (Gold) 7th Jul’25 to 11th Jul’25Anticipating bullish continuation following last week’s move.
Watching for a potential SMT to form within the weekly cycle, with price likely pushing up to target buyside liquidity.
XAUUSD trade ideas
I hold on to my short position and wait patiently.Currently, gold continues to rebound to around 3358, and there has been no decent retracement during the rebound, so during the trading period, apart from chasing the rise, there are almost no opportunities to go long on gold; so is the steady rise in gold during the day brewing a bigger rally?
I think there are three reasons for the continued rise of gold:
1. The continued weakness of the US dollar provides support for the strong rise of gold;
2. The trapped long chips have recently shown self-rescue behavior, and strong buying funds have driven gold up;
3. The market intends to eliminate and kill a large number of shorts in recent times;
Based on the above reasons, I think it is not a wise decision to chase gold at present; on the contrary, I still prefer to short gold in the short term, and I still hold a short position now; the following are the reasons to support my insistence on shorting gold:
1. The US dollar has a technical rebound demand after a sharp drop, which will limit the rebound space of gold and suppress gold;
2. After the recent trapped long chips successfully rescue themselves, they may cash out in large quantities, thereby stimulating gold to fall again;
3. While killing the shorts, the market has also lured a large number of long funds to a certain extent. Based on the above reasons, I currently still hold short positions near 3345 and 3355, and hope that gold can retreat to the 3335-3325 area.
The bears will take the 3290-3280 area stronglyGold started to fall from 3342 during the day and fell below 3300 at one point. Gold is in an obvious short position, and during the London market, gold continued its downward momentum without any decent rebound. Gold is in an extremely weak state. In the absence of a rebound in the London market, I think New York is very likely to continue to fall.
According to the current structure, gold is facing technical suppression of the head and shoulders in the short term, which greatly limits the rebound space of gold and suppresses the rebound limit within 3335. As the center of gravity of gold moves down, the resistance in the short term moves down to the 3315-3325 area. After breaking through 3330, the downward space has been opened up to a certain extent. So don’t be fooled by the false bullish candle that appear near 3330. Gold will inevitably continue to fall to the 3290-3280 area.
The 3290-3280 area is bound to be won, so shorting gold is still the first choice for short-term trading. You can consider shorting gold with the 3315-3325-3335 area as resistance, and look to the target area: 3295-3285-3275.
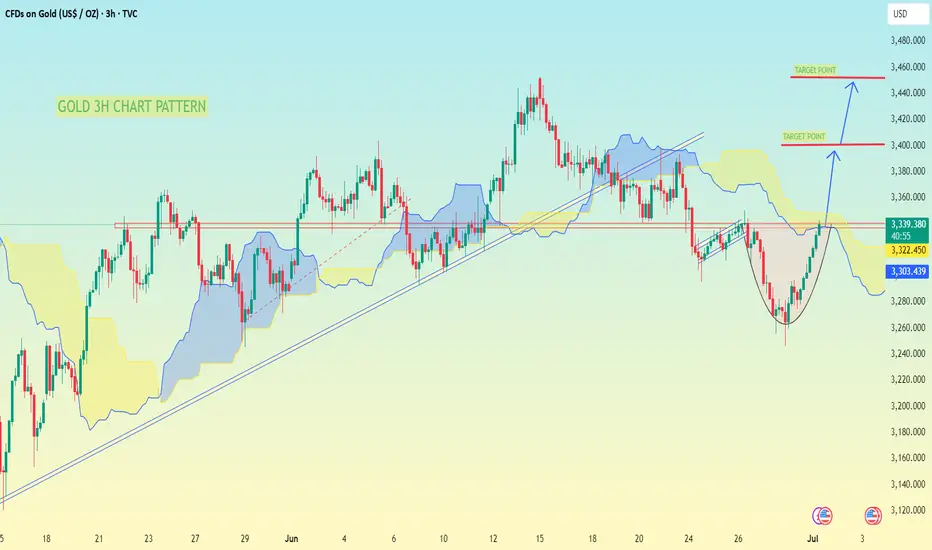
GOLD 3H Chart Pattern, I have marked a cup formationGOLD 3H Chart Pattern, I have marked a cup formation, which often indicates a bullish reversal setup. Based on the chart:
Key Levels:
Current Price Zone: Around 3,323 - 3,330
First Target: Near 3,380 - 3,400
Final Target: Near 3,440 - 3,460
Analysis:
Price is forming a cup pattern with resistance around 3,380 - 3,400
Break above 3,400 could lead towards the final target zone of 3,440 - 3,460
Watch for price reaction near Ichimoku Cloud; clean breakout above the cloud confirms bullish momentum
Suggested Targets:
✅ First Target: 3,380 - 3,400 USD
✅ Second Target: 3,440 - 3,460 USD
Note: Wait for confirmation above 3,330 - 3,340 and bullish momentum to continue.
If you want, I can also give stop-loss and entry suggestions based on this chart. Let me know!
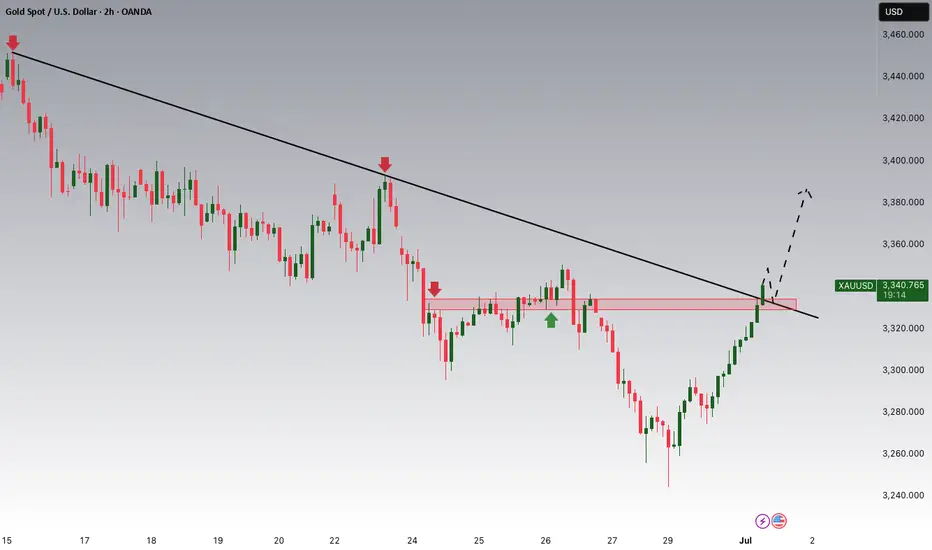
Gold Breakout and Potential RetraceHey Traders, in today's trading session we are monitoring XAUUSD for a buying opportunity around 3,330 zone, Gold was trading in a downtrend and successfully managed to break it out. Currently is in a correction phase in which it is approaching the retrace area at 3,330 support and resistance area.
Trade safe, Joe.
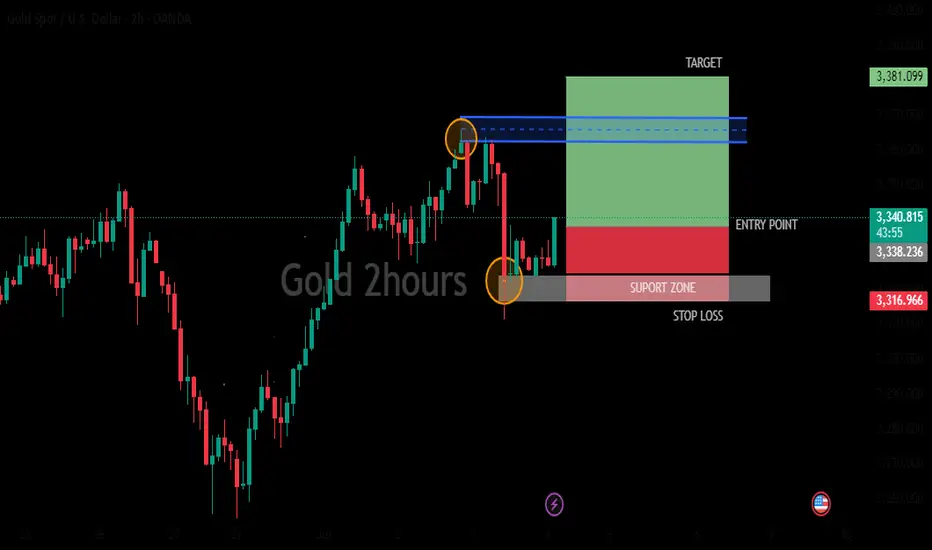
GOLD 2HOURS BULISH ANALYSISMarket may be going buy side and the presence of indicators and other tools suggests that the user is actively monitoring and analyzing the market.target price (green bar) stop loss (red bar) entry point (blue line)
XAUUSD Bullish and bearish. Which one first?
📉 Gold and NDX: Seasonal Patterns and Short-Term Outlook
Historically, gold tends to show weakness during the first three weeks of July, often setting the stage for one last leg up before institutional selling kicks in on U.S. equities. Based on seasonal patterns, this aligns with a typically bullish phase for the Nasdaq (NDX), which often extends until around July 24, with the usual volatility along the way.
From there, gold tends to recover, historically offering a 3–5% return into mid-September. Keep in mind, this is purely based on statistics—always do your own analysis.
🔎 This week’s short-term setup:
We may see a push higher in gold later today and into tomorrow, followed by potential downside during the second half of the week. While there might be brief upside opportunities, I won’t be taking any long positions—only looking to sell rallies—since the short-term trend remains more bearish than bullish.
Stay sharp and trade safe. 📊

XAUUSD Update : Bullish MomentumToday's New York market session has made gold prices rise with quite strong momentum.
Prepare to surf the Bull's wave.
Have a blessing day !
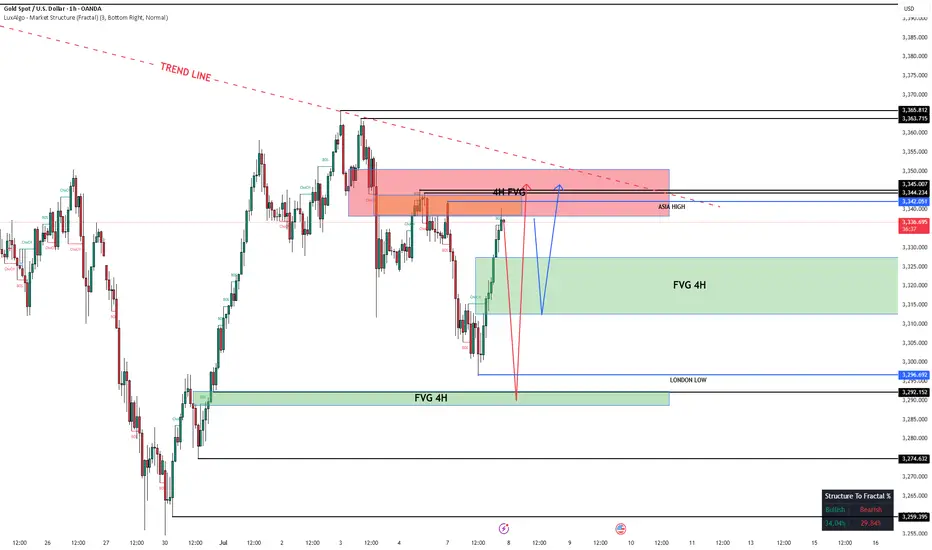
Tuesday Outlook on Gold (XAU/USD)
After Monday’s move into the 4H Fair Value Gap and rejection near the trendline and Asia High, I’m expecting a corrective move to start Tuesday.
I’m currently watching two possible downside targets:
🔸 Scenario 1: A short-term drop into the upper part of the 4H FVG (around 3320–3310) – this zone could act as intraday demand and cause a quick bounce.
🔸 Scenario 2: A deeper retracement toward the unfilled imbalance around 3290–3280, lining up with the London Low and completing the 4H FVG.
This would be a more significant liquidity sweep before a potential bullish reaction.
From both zones, I’ll be looking for price action to confirm a possible long setup back toward the trendline and above.
Let’s see how Tuesday plays out.
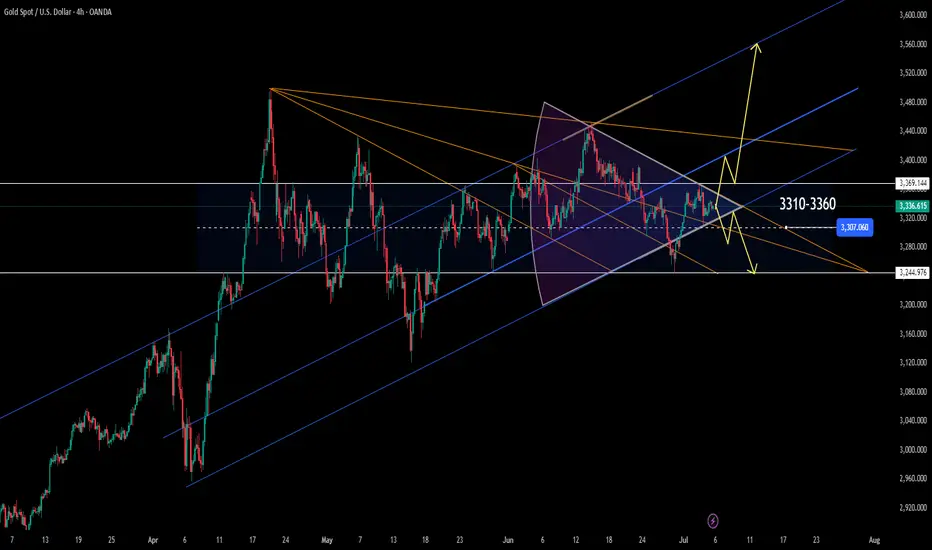
Analysis of gold price rise and fall on MondayAnalysis of gold price rise and fall on Monday
The probability distribution of gold price trend next Monday is as follows:
Probability of rise: 55%-60%.
Support factors include: the expectation of Fed rate cuts has been strengthened, the dollar is weak, the tariff deadline is approaching, triggering safe-haven demand, and the momentum of short-term rebound in the technical aspect.
Probability of decline: 35%-40%.
Risk factors include: strong resistance at 3360 points on the technical side, temporary relief of geopolitical risks, and profit-taking pressure.
Probability of sideways fluctuation: 5%-10%.
If there is a lack of catalysts, the gold price may fluctuate in the range of 3310-3360, waiting for new clues.
Operation strategy reference:
Long position strategy: If the gold price falls back to the 3310-3315 area and stabilizes, you can go long with a light position, set the stop loss below 3300, and the target is 3325-3330 (it can go up to 3335-3340 after breaking through).
Short-selling strategy: If the gold price rises to the 3350-3360 range, you can short with a light position, set the stop loss above 3360, and target 3325-3330 (after breaking through, look down to 3310--3300-3280).
Fundamentals
Weight analysis of key influencing factors:
Subsequent impact of US non-farm payrolls data: If the detailed interpretation of non-farm data next Monday continues to ferment, it may provide support for gold.
Expected changes in the tariff decision on July 9: Next Monday will be the last trading day before the suspension of US trade tariffs (July 9), and market concerns about the Trump administration's possible increase in tariffs may heat up.
Any relevant news or official statements may trigger safe-haven funds to flow into gold.
Key technical game:
The battle between the $3310 support level and the $3360 resistance level will continue to dominate the short-term trend.
If the opening price remains above the 3330-3340 range next Monday, it may test the 3360 resistance; if it falls below 3310, it may fall to the 3280 support.
Trends of the US dollar index and US Treasury yields: The US dollar index has recently fallen to a two-year low (96.875), and US Treasury yields have also fallen (10-year yields are 4.228%). If this trend continues, it will be good for gold.
Geopolitical risk dynamics: Although the situation in the Middle East has not escalated further, it is still in a tense state, and sudden news may disrupt the market at any time.
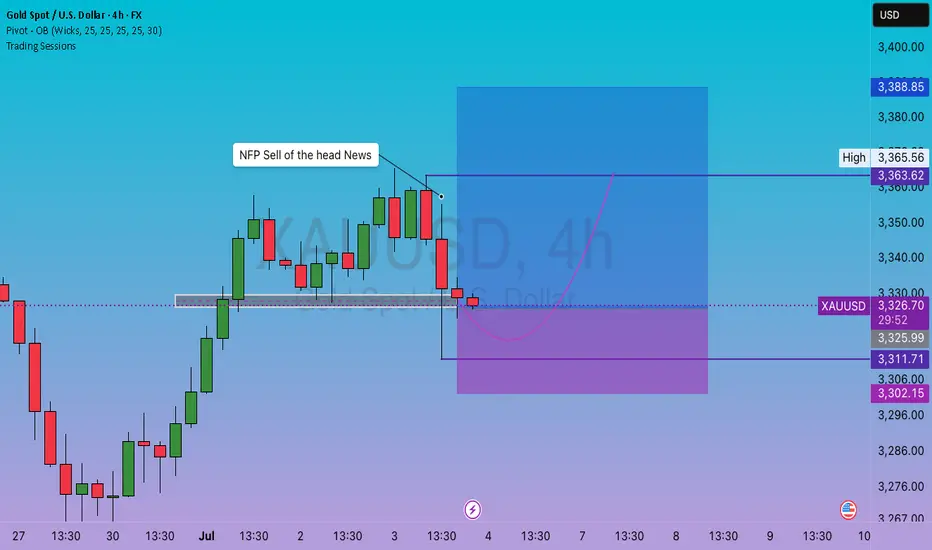
GOLD LONGToday's news only corrected the dollar, it did not create a new bottom. So we buy with capital management in mind.
First target 3357 at the time of the news.
Second target 3380
SL' 3302
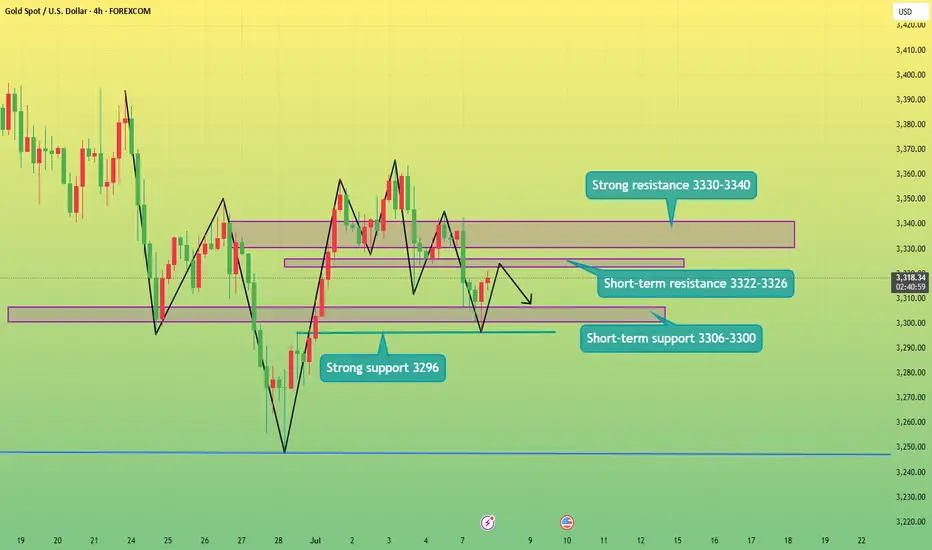
Gold bottomed out and rebounded to fluctuateGold, the price opened at 3342 in the morning and then fell back. The article emphasizes the bearish structure of the 4H chart, and the bearish trend continued to 3311-3295 in the afternoon; the actual price fell to 3296 and then rebounded in the evening, and the 4H chart closed at 22:00 and turned into a big positive, and it will rebound and fluctuate at night;
Short-term support 3306-3300, strong support 3296; short-term resistance 3322-3326, strong resistance 3330-3340;
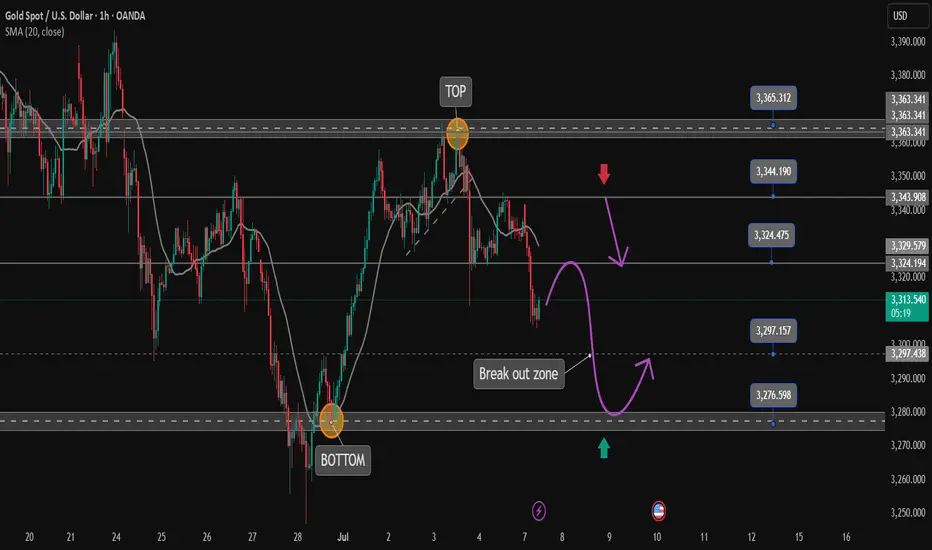
Trend Continuation After NonfarmToday's D1 candle started to continue the trend of NF with a decrease to 3306 in the Asian session this morning.
The bearish structure of Gold Price will continue in today's trading session towards important support zones.
The downtrend of Gold was only broken with a candle closing back above 3324. And the downtrend may reach support 3275 today.
Support 3297-3275
Resistance 3324-3343-3364
SELL Trigger: Break support 3296
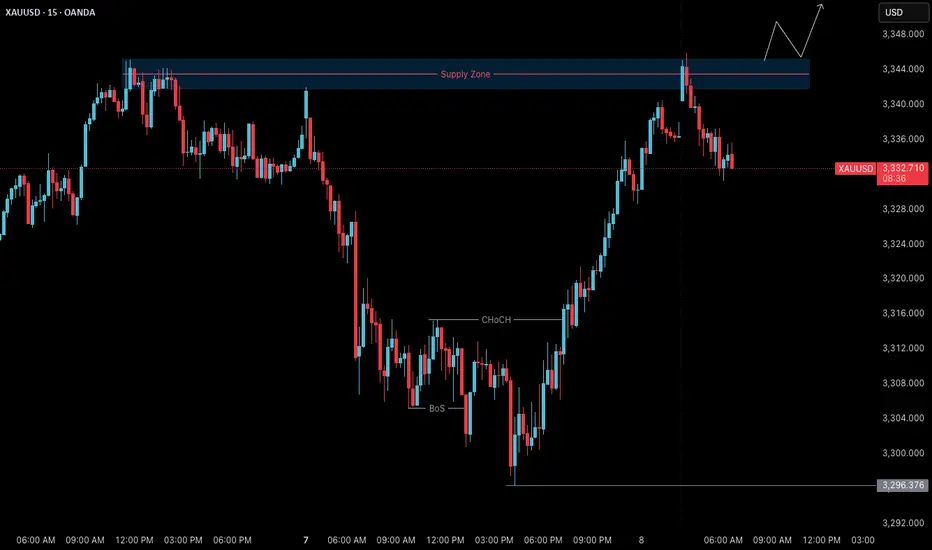
Gold (XAUUSD) – July 8 Analysis | Decision Day at H4 Supply Zone
Gold is currently trading inside a key H4 supply zone (3342–3345) , and today’s session could act as a pivotal turning point for the ongoing structure.
We are now in a region where the H4 may either complete its pullback and resume the uptrend — or allow price to drop deeper toward 3280 before any bullish continuation.
Market Structure Overview
• H4 Trend: Still in a pullback
• M15 Trend: Gave a Change of Character (ChoCh) in the previous session
• Break of Structure (BoS): Not yet confirmed on M15
This puts us in a state of unconfirmed reversal . Without a clean BoS, this could still be a liquidity grab .
Key Levels & Current Setup
📍 H4 Supply Zone: 3342–3345
→ This is where price is currently reacting
→ Sellers may step in here if the broader pullback continues
📍 M15 Structure Status:
→ ChoCh already occurred
→ Price is in a retracement phase
→ BoS is needed to confirm a shift and signal the end of H4 pullback
What Today’s Session Will Decide
🔸 If M15 breaks structure upward (BoS):
→ H4 pullback may be complete
→ Bias turns bullish
→ We’ll plan long setups from M15 POIs with M1 confirmation
🔸 If M15 fails to break and reverses:
→ This could be a liquidity grab
→ Sellers may push price lower
→ Next downside target: 3280 H4 order block , still valid
⚠️ Reminder: Be Prepared for Both Scenarios
• No M15 BoS = No bias
• Wait for structure, not emotion
• Do not force long trades without confirmation
• 3280 remains a high-probability target if rejection confirms
Final Thoughts
This is a structure-led market — we don’t predict, we prepare.
Today’s price action may bring directional clarity.
Structure over speculation.
Let price show intent.
Then act with process, not impulse.
📘 Shared by @ChartIsMirror
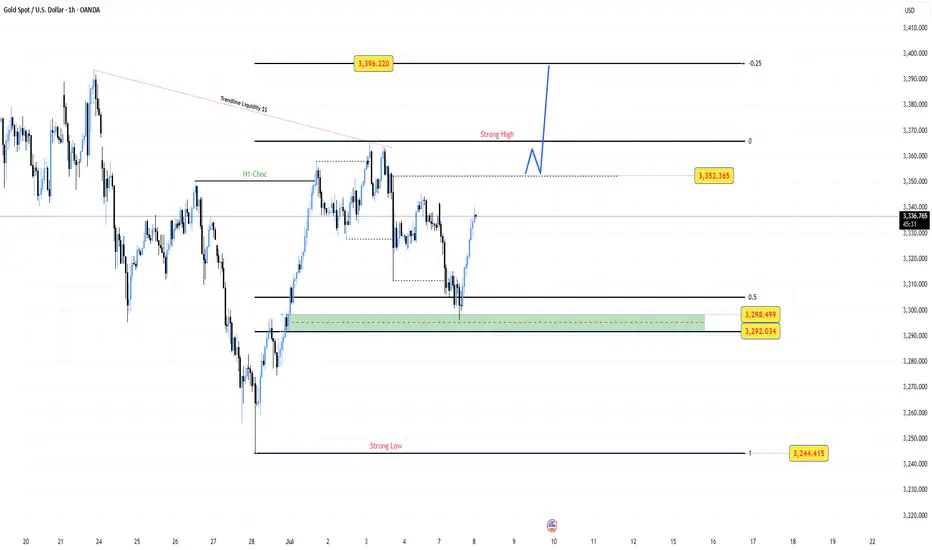
#XAUUSD – H1 High Probability Setup
📊 **#XAUUSD – H1 High Probability Setup** 🔍
If you recall our **morning analysis**, we clearly mentioned that price is likely to **mitigate the zone below 3300** —
and as expected, **price tapped into 3296**, which aligned with both the **H1 Order Block** and **Golden Fibonacci zone** 🎯📉
---
📈 **Current Setup in Progress:**
We're now watching for a **bullish H1 candle close above 3353** 🔼
Once confirmed, we’ll execute a **layered buy strategy**:
🔹 **50% entry at activation** (above 3353)
🔹 **30% on retracement** (if price dips 50–60 pips below entry)
🔹 **Remaining 20%** if price dips **70+ pips** below entry zone
---
🛡️ **Stoploss:** 3338–3337 (slightly wide due to structure)
This is why we **scale into the trade** — for **better risk management** and **position control** ✅
🎯 **Minimum Target:** 100–150 pips
🏁 **Extended Target (Optional):** 3396 – for those who can hold with conviction 📊💰
---
🧠 *Follow structure, manage risk, and trust the plan. High probability setups don’t need to be rushed.*
Gold BullishAfter exiting a correction, the first impulse (Wave 1) appears. I expect a retracement of at least 50% of the Fibonacci.
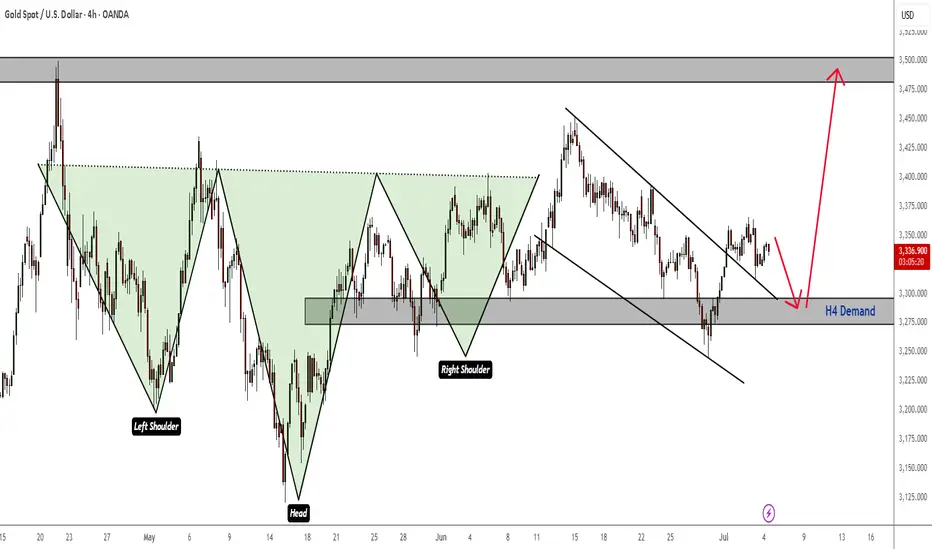
Gold Bullish Structure - Awaiting A RetestThat inverted head and shoulders pattern on is what is still giving me the confidence that the bulls will soon take over this market with a high probability of new All Time Highs.
At the moment however, I am patiently aways the possibility of a retest to the H4 demand zone as indicated by the downward pointing arrow. The bullish move might only happen in ful swing next week.
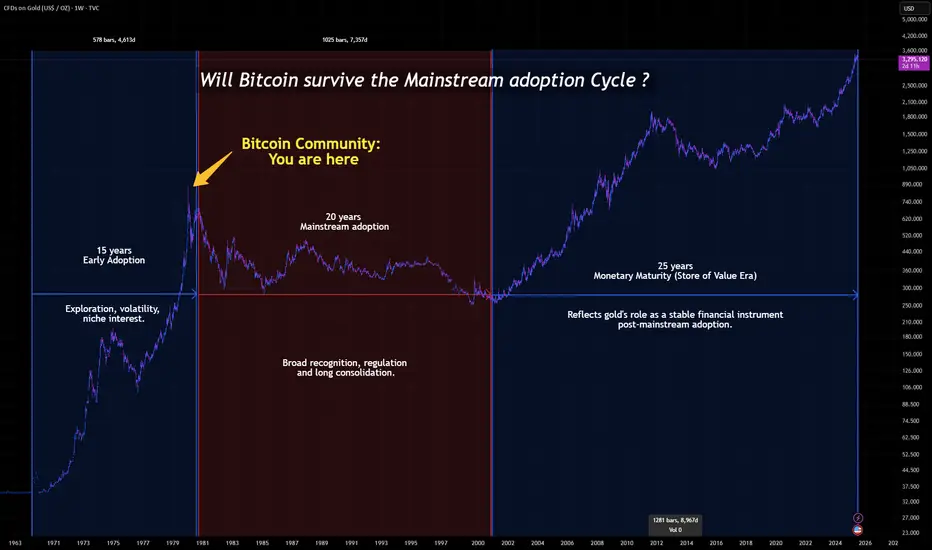
Bitcoin vs Gold: Driving the Point Home📉 Bitcoin vs Gold: Driving the Point Home The long-term comparison we can't afford to ignore.
Gold, after achieving mainstream status, weathered a 20-year consolidation phase, low volatility, muted investor excitement, but enduring presence. This historical precedent forces us to reconsider expectations for Bitcoin, now in its 15th year.
⚡ While Bitcoin’s adoption curve has been sharper, its market dominance has steadily declined since 2017. Despite intermittent, and often deceptive relief rallies, the trend remains downward. Altcoins, forks, and shifting narratives (DeFi, NFTs, meme tokens) continue to fragment attention and capital.
⚡ Could Bitcoin follow gold’s path and enter a prolonged era of post-hype consolidation? If so, the next bull run might be a decade away or more … if it happens at all. In an age of digital abundance, durability; not innovation, may define Bitcoin’s legacy.
📊 Chart Highlights: The latest image visualizes Bitcoin’s current phase against gold’s historical arc. The final label "Monetary Maturity" suggests a shift from speculative highs to a more sober test of endurance.
🔍 Will Bitcoin evolve into a true store of value or fade as just another chapter in financial innovation? Let the markets answer, but history offers clues. Only Time will tell.
#Bitcoin #Gold #CryptoAnalysis #BTCdominance #CryptoHistory #DigitalAssets #TradingView
CRYPTO:BTCUSD INDEX:BTCUSD TVC:SILVER NASDAQ:MSTR NASDAQ:MARA NASDAQ:COIN NASDAQ:TSLA TVC:DXY NYSE:CRCL
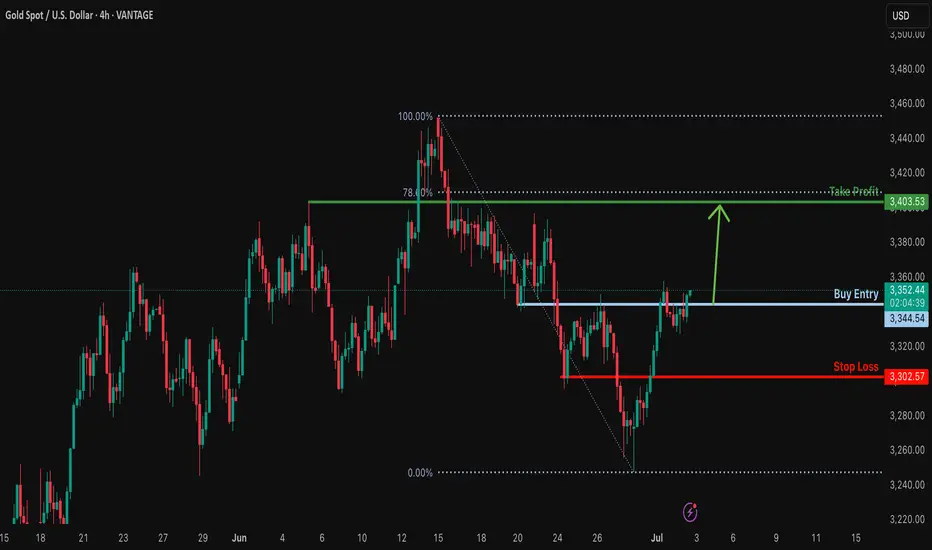
Bullish rise for the Gold?The price is reacting off the resistance level which is a pullback resistance and could potentially rise from this level to our take profit.
Entry: 3,344.54
Why we like it:
There is a pullback resistance level.
Stop loss: 3,302.57
Why we like it:
There is a pullback support level.
Take profit: 3,403.53
Why we like it:
There is a pullback resistance level that lines up with the 78.6% Fibonacci retracement.
Enjoying your TradingView experience? Review us!
Please be advised that the information presented on TradingView is provided to Vantage (‘Vantage Global Limited’, ‘we’) by a third-party provider (‘Everest Fortune Group’). Please be reminded that you are solely responsible for the trading decisions on your account. There is a very high degree of risk involved in trading. Any information and/or content is intended entirely for research, educational and informational purposes only and does not constitute investment or consultation advice or investment strategy. The information is not tailored to the investment needs of any specific person and therefore does not involve a consideration of any of the investment objectives, financial situation or needs of any viewer that may receive it. Kindly also note that past performance is not a reliable indicator of future results. Actual results may differ materially from those anticipated in forward-looking or past performance statements. We assume no liability as to the accuracy or completeness of any of the information and/or content provided herein and the Company cannot be held responsible for any omission, mistake nor for any loss or damage including without limitation to any loss of profit which may arise from reliance on any information supplied by Everest Fortune Group.
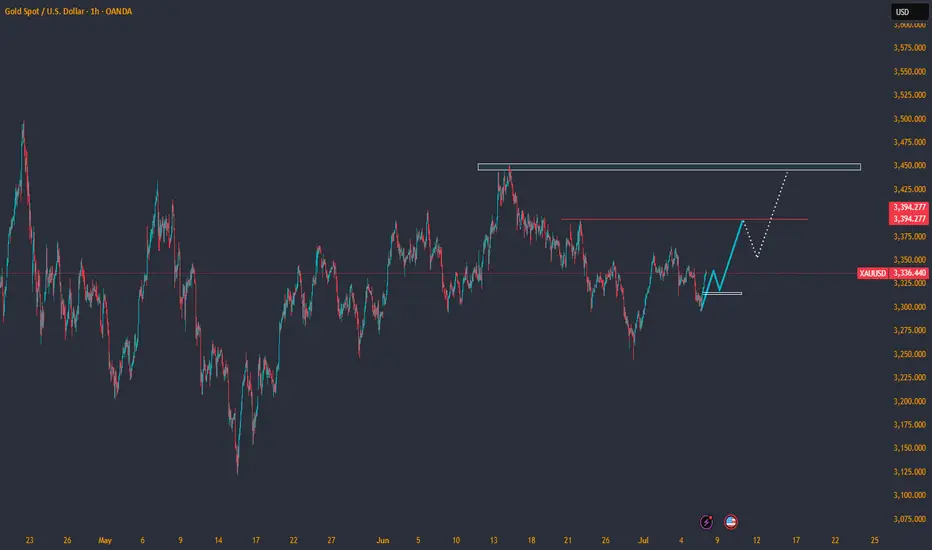
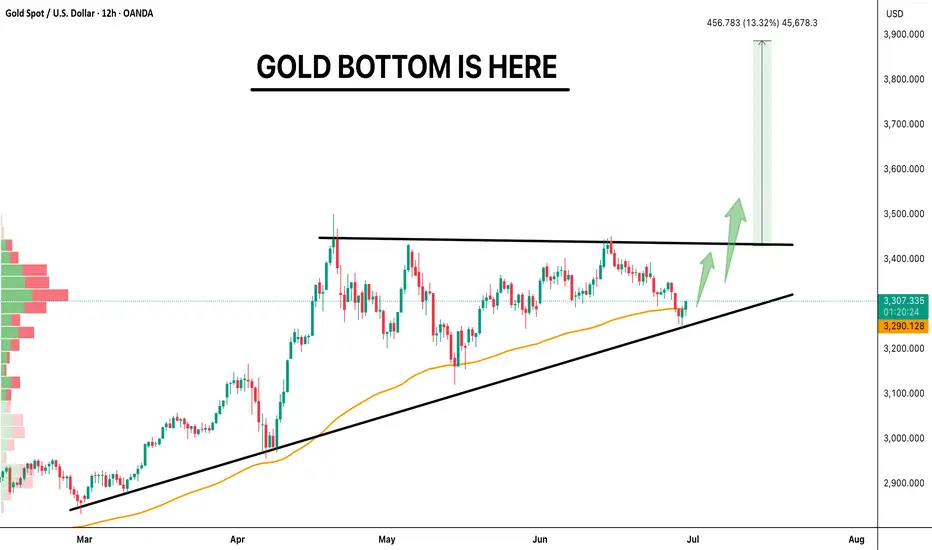
GOLD Bouncing from Trendline, Breakout Ahead?GOLD BOTTOM IS HERE 🔥
Gold has taken support from the rising trendline and is now close to breaking a key resistance. The chart is showing an ascending triangle, which usually means a big move is coming.
If price breaks above the resistance, we might see a strong rally of 13% or more.
The setup looks positive as long as the support stays strong.
Looks like Gold is ready to shine again!
Retweet if you're bullish.
Like and follow for more updates!
#GOLD TVC:XAU
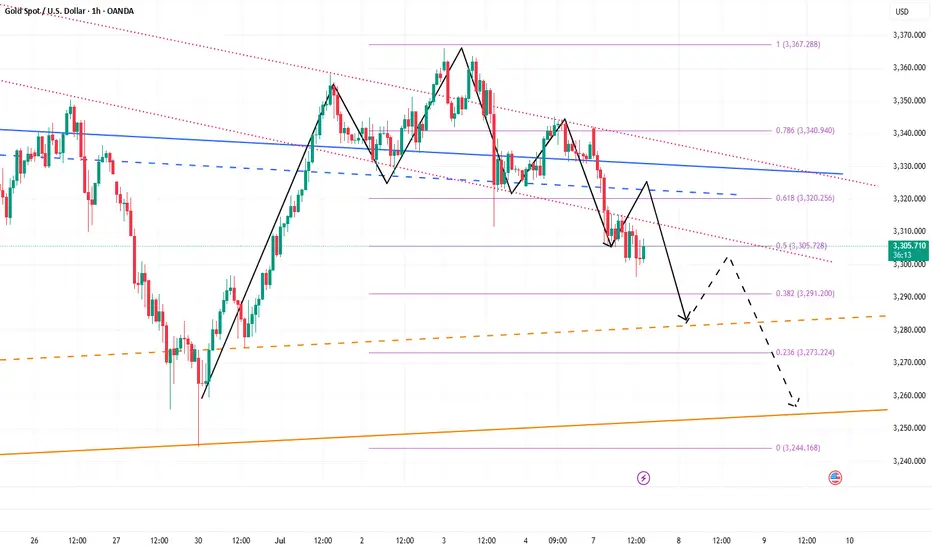
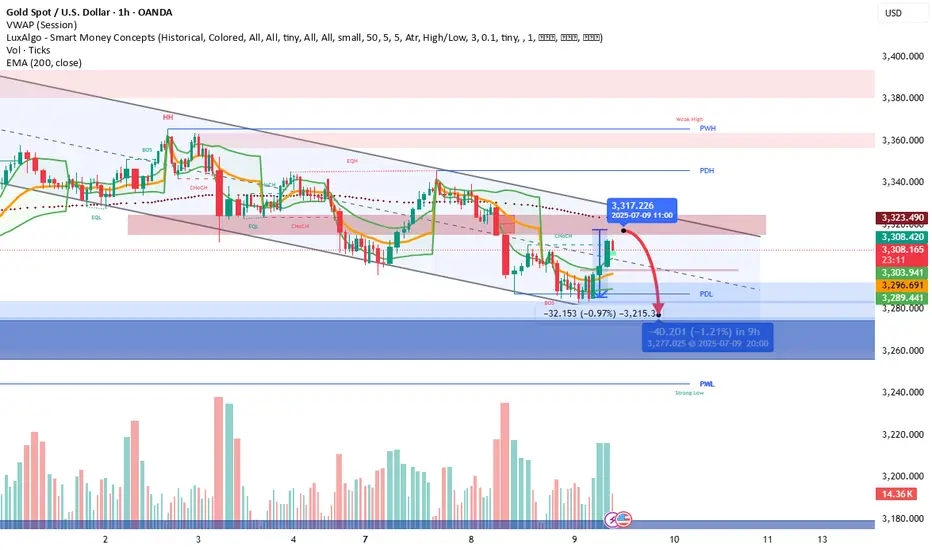
Watching the FVG Midpoint for a Potential Resistance PlayTraders, TVC:GOLD is currently moving beautifully within a well-defined descending parallel channel, and it’s offering some interesting technical setups. If you take a closer look at the chart, you’ll see that price has formed a Fair Value Gap (FVG) on the 1-hour timeframe. The midpoint of this FVG lies around the 3317–3318 level. Previously, this zone acted as a strong area of support, but since the price has now broken below it, there’s a high probability that it could flip into a resistance zone this time around.
This kind of structure often provides great opportunities for short entries if we see a price retest and show signs of rejection near the midpoint of the FVG. Always keep an eye on how the candles behave when price revisits this area, as it could set up a nice trade with clearly defined risk and reward. Remember, patience is key—let the price come to your zone instead of chasing it. Let’s see how this plays out!
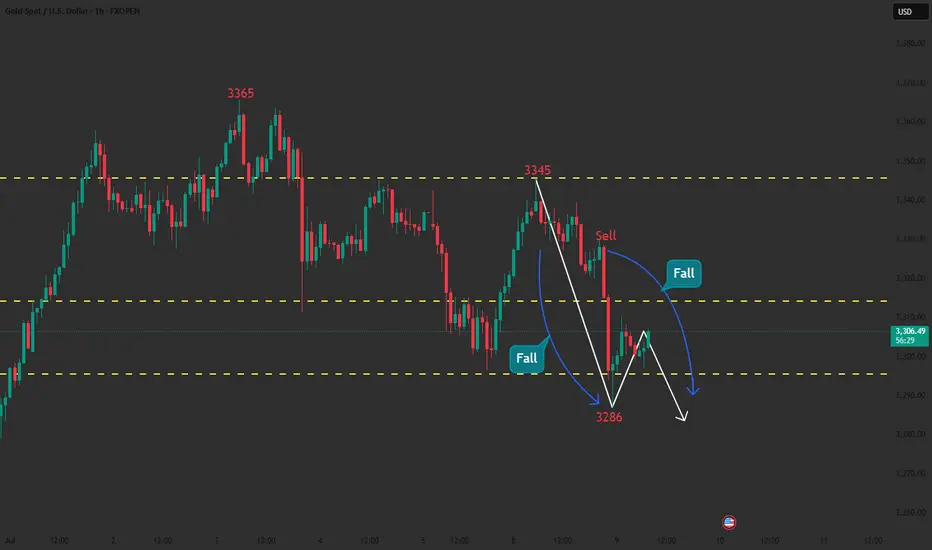
Follow up before the Fed minutesGold, the price fell from the historical high of 3500 to 3120 in the first round this year, and is now in the second round of downward cycle after rising to 3452. The mid-term top idea is maintained, and the operating target is 3120; after bottoming out and rebounding to 3345 on Monday, it did not continue on Tuesday, and fell to 3287 in a weak position; the daily chart recorded a real big Yin, and the K-line combination was short-term, and the bearish trend continued during the day, and attention was paid to the impact of the Federal Reserve's monetary policy minutes on Thursday morning;
Opening at 3301, short-term resistance at 3308-3310 during the Asian session, strong resistance at 3315 and daily chart MA5-3320, the limit rebound is not more than here; short-term support at 3293, strong support at 3287, and the previous parallel low at 3247 is expected to be seen if it breaks;