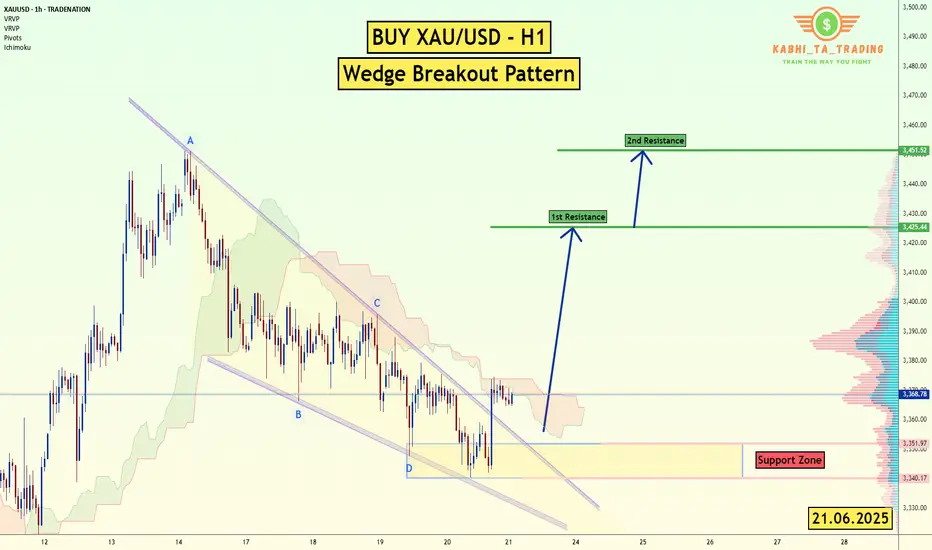
XAU/USD (Gold) - H1 - Wedge Breakout (21.06.2025)The XAU/USD pair on the H1 timeframe presents a Potential Buying Opportunity due to a recent Formation of a Wedge Breakout Pattern. This suggests a shift in momentum towards the upside and a higher likelihood of further advances in the coming Days.
Possible Long Trade:
Entry: Consider Entering A Long Position around Trendline Of The Pattern.
Target Levels:
1st Resistance – 3425
2nd Resistance – 3451
🎁 Please hit the like button and
🎁 Leave a comment to support for My Post !
Your likes and comments are incredibly motivating and will encourage me to share more analysis with you.
Best Regards, KABHI_TA_TRADING
Thank you.
Disclosure: I am part of Trade Nation's Influencer program and receive a monthly fee for using their TradingView charts in my analysis.
XAUUSD trade ideas
UPDATE 26th June 2025 Consolidation Phase Consolidation Phase still running.
It have a potential to retest a lower support.
During this consolidation period, we will continue to monitor any fluctuations ( war, geopolitic, US economic, etc ) that will affect the movement of gold prices.
So becareful at support level / key level.
Goodluck !
If you agree...click Boost
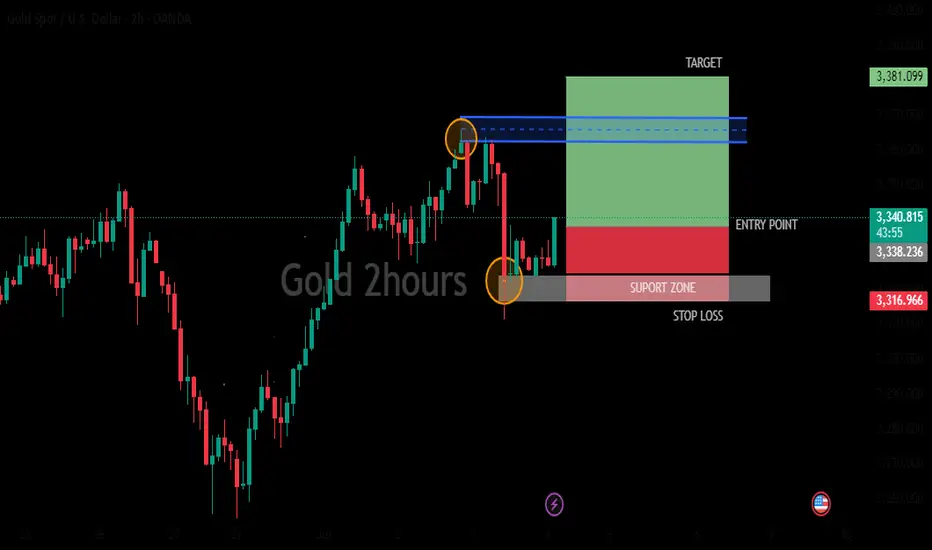
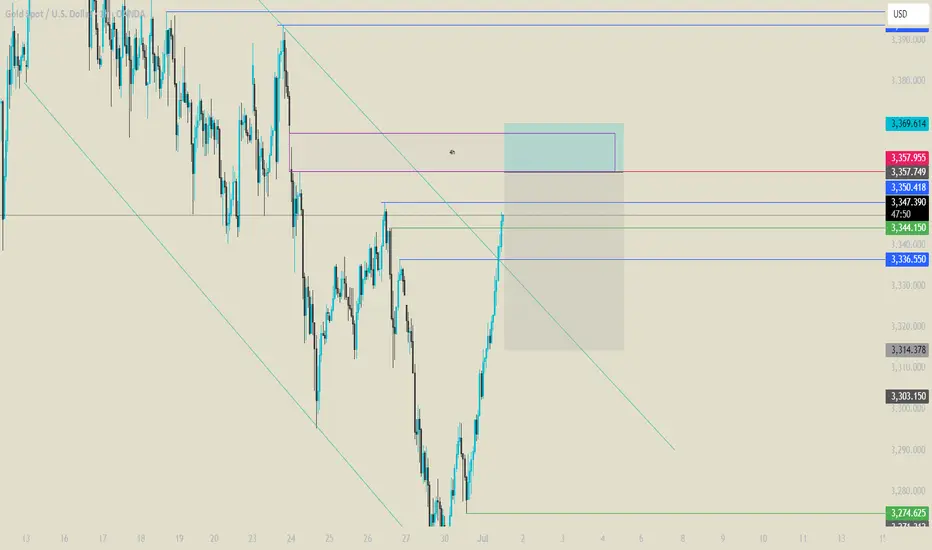
GOLD 2HOURS BULISH ANALYSISMarket may be going buy side and the presence of indicators and other tools suggests that the user is actively monitoring and analyzing the market.target price (green bar) stop loss (red bar) entry point (blue line)
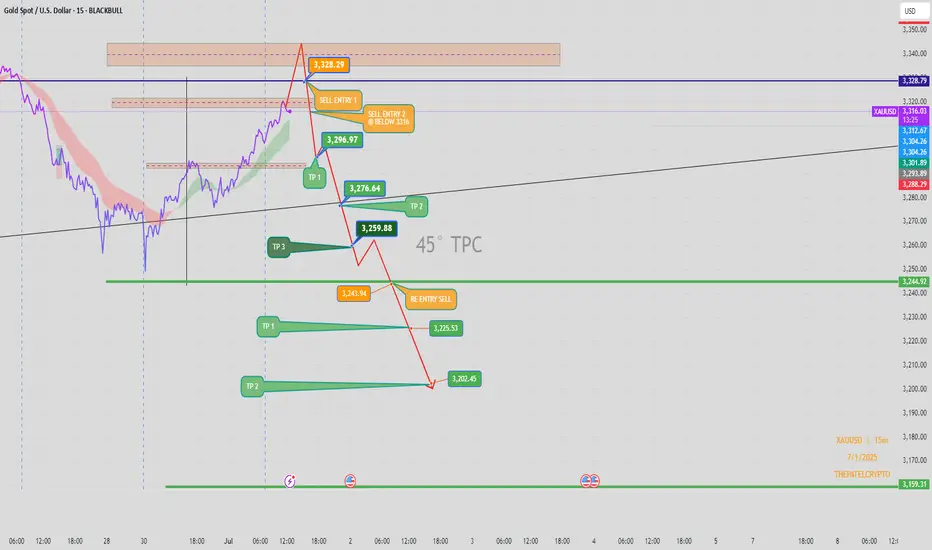
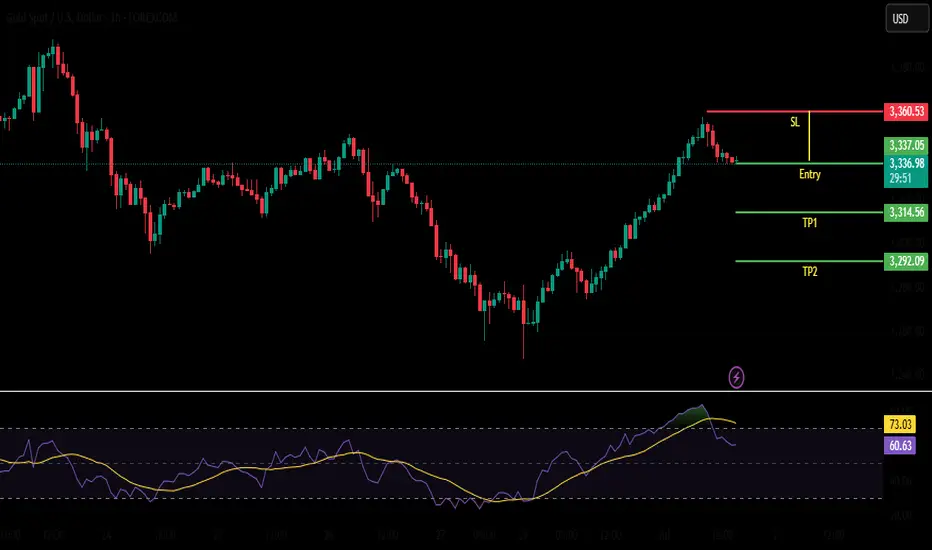
XAUUSD 15min – Bearish Setup | Short Trade Plan Below 3328Price action on Gold (XAUUSD) is showing signs of exhaustion near the 3,328 resistance zone, where we anticipate potential bearish rejection. A short opportunity may unfold once confirmation occurs below the key structural level of 3316.
Sell Trade Setup:
🔹 Primary Entry (Sell Entry 1):
📍 Zone: Around 3,328.29
📌 Reaction expected near major supply & resistance zone.
🔹 Confirmation Entry (Sell Entry 2):
📍 Below 3,316
📌 Break below structure may trigger bearish momentum.
Targets:
🎯 TP 1: 3,296.97 (Initial reaction zone)
🎯 TP 2: 3,276.64 (Mid support/EMA cross zone)
🎯 TP 3: 3,259.88 (Key structural support)
🎯 Extended TP:
3,243.94 (Re-entry confirmation level)
3,225.53 (Prior base structure)
3,202.45 (Final target if strong momentum follows)
3,159.31 (Ultimate low if sellers dominate trend)
Re-Entry Plan:
🔄 If price retraces after TP 3, watch for rejection at 3,243.94 to re-enter short toward the next levels.
Confluence Factors:
✔ 45° TPC angle supports bearish path
✔ Structure break expected below 3316
✔ EMA resistance and trendline rejection from upper zone
✔ Volatility cluster observed near 3,328 – ideal for trap setup
Bias:
Bearish below 3,316 – Expecting a downward continuation if structure confirms breakdown.
Author:
📅 1 July 2025
📊 Chart: XAUUSD – 15min
🧠 Shared by: @THEPATELCRYPTO
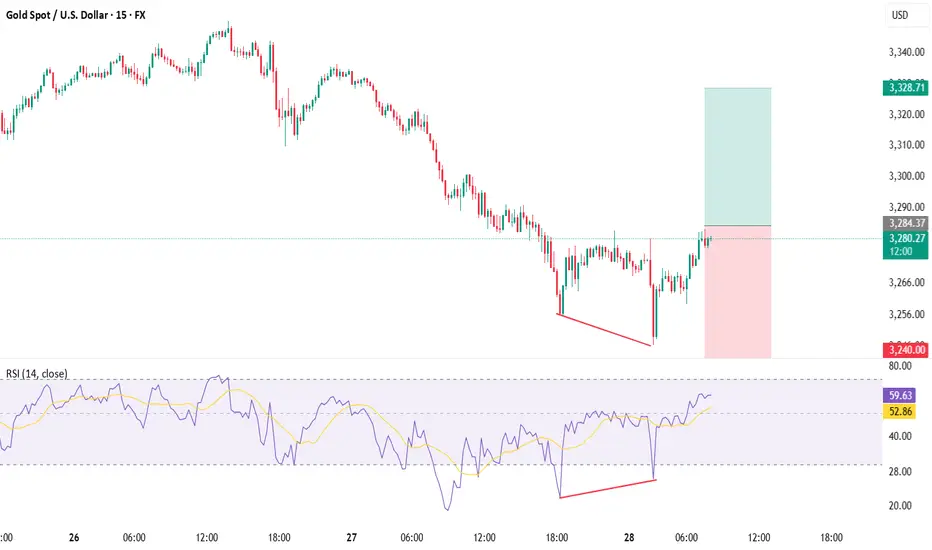
XAUUSD📉 The Setup: Bullish Divergence on XAUUSD (15m/30m)
Buy only on Breakout
🔍 Observation:
On the 30-minute timeframe, price made a lower low while the RSI indicator printed a higher low — classic sign of bullish divergence 🔄.
💡 Translation: Bears are losing steam! Bulls may be preparing to charge in! 🐂⚡
📊 Trade Plan – Long Entry
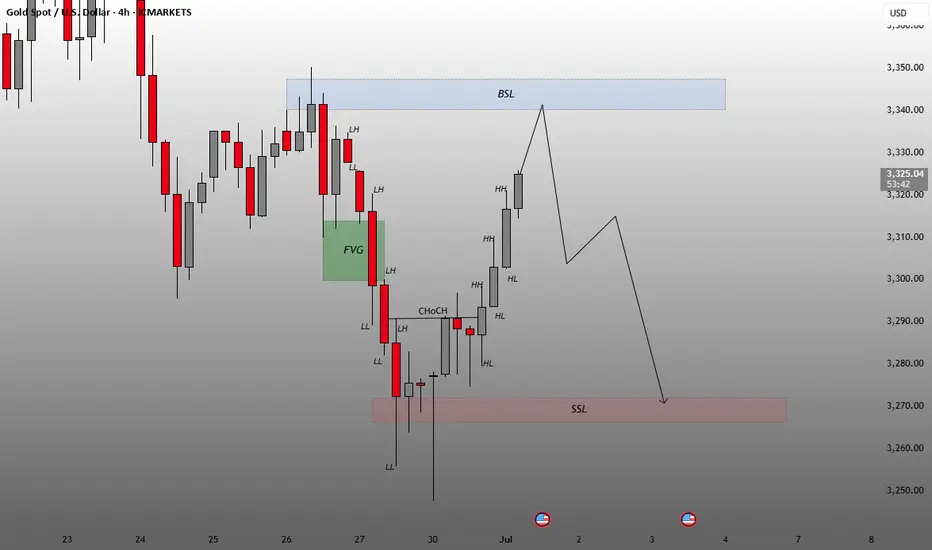
Smart Money Concepts or Inner Circle Trade methodologies.Key Zones and Annotations
FVG (Fair Value Gap) – Marked in green:
Represents an imbalance in price (gap between candles).
Price often returns here to “fill” or mitigate that inefficiency.
BSL (Buy-Side Liquidity) – Marked in blue near the $3,340 area:
Indicates an area above recent highs where stop-losses (liquidity) might be resting.
This area is often targeted before reversals.
SSL (Sell-Side Liquidity) – Marked in red near the $3,270 area:
Represents liquidity below recent lows.
This is a potential bearish target.
Structure Labels
LL (Lower Low), LH (Lower High), HH (Higher High), HL (Higher Low):
Used to track market structure direction (bearish/bullish trend).
ChoCH (Change of Character):
Indicates a shift in market structure, typically a sign of a trend reversal.
Price Projection
The projected path shows a short-term move upward toward the BSL region (~$3,340), suggesting liquidity grab or premium pricing area.
Then, a bearish reversal is projected targeting the SSL zone (~$3,270), suggesting a potential drop after the BSL is taken.
Conclusion
The chart suggests a short-term bullish move to clear buy-side liquidity followed by a bearish continuation targeting lower liquidity zones. This type of analysis is commonly used in Smart Money Concepts (SMC) or ICT (Inner Circle Trader) methodologies.

GOLD The ADP Non-Farm Employment Change for July 2,have a forecast of 99,000 jobs, compared to the previous month’s very weak result of 37,000—the lowest since March 2023. The ADP National Employment Report is a monthly indicator that tracks changes in non-farm private sector employment in the US, based on anonymized payroll data from ADP’s clients, covering about one-fifth of all US private employment.
Who is responsible?
The report is produced by the ADP Research Institute, part of Automatic Data Processing (ADP), in partnership with the Stanford Digital Economy Lab.
Why it matters:
The ADP report is viewed as a leading indicator for the official Non-Farm Payrolls (NFP) report from the Bureau of Labor Statistics (BLS), released two days later.
It provides early insight into US private sector job growth and labor market health, and significant deviations from forecasts can move financial markets.
Note that the ADP report covers only private sector jobs, not government employment, so its numbers can differ from the official NFP.
Summary Table:
Report Date Forecast Previous Responsible Department
July 2, 2025 99,000 37,000 ADP Research Institute (ADP)
In summary:
The ADP Non-Farm Employment Change report, produced by the ADP Research Institute, forecasted a rebound to 99,000 jobs in June after a very weak 37,000 in May, providing an early signal on the health of US private sector employment.
(2)US10Y drops to historical low to 4.193% and currently broken 1hr descending trendline at 4.281% ,4.3% resistance will be watched for breakout buy bond buyers.
(3) DXY Key Points:
The DXY measures the US dollar’s strength against a basket of six major currencies: the euro (57.6% weight), Japanese yen (13.6%), British pound (11.9%), Canadian dollar (9.1%), Swedish krona (4.2%), and Swiss franc (3.6%).
After peaking near 110.075$ in January 2025, the index has softened , trading near 96.600-101.966.on weekly TF 101.966 was a retest to broken weekly demand floor .
The dollar’s decline reflects market expectations of Federal Reserve rate cuts later in 2025, easing inflation pressures, and some geopolitical easing.
the DXY to rebound will henge and depend on Fed policy and global economic conditions.
GOLD buyers are watching for the direction of trade ,
Chinese Demand and Policy:
China is one of the largest gold consumers and holders. Domestic demand, central bank gold purchases, and monetary policy in China heavily influence XAU/RMB. If China’s economy slows or trade tensions with the US worsen, demand for gold as a safe haven may increase, supporting XAU/RMB even if the dollar is strong.
China's recent opening of the Shanghai Gold Exchange's (SGE) first offshore gold vault in Hong Kong on June 26, 2025, represents a significant development with potential, albeit indirect, implications for XAU/USD (gold priced in US dollars) .
Key Aspects of the Hong Kong Gold Vault:
Location and Operation: The vault is located in Hong Kong and operated by Bank of China's Hong Kong unit .
Yuan-Denominated Trading: All transactions and settlements in the vault are denominated exclusively in yuan, either via cash or physical bullion delivery . Two new yuan-denominated gold trading contracts were launched alongside the vault .
Strategic Objectives:
Increased Influence on Gold Pricing: China, as the world's leading gold producer and consumer, aims to gain greater control and influence over global gold pricing mechanisms .
Yuan Internationalization: The initiative seeks to accelerate the international usage of the yuan, supporting China's broader de-dollarization efforts . This allows China to import gold in yuan, reducing reliance on the US dollar for commodity trading .
Enhanced Global Reach: The vault expands the SGE's physical infrastructure beyond mainland China, creating a new gateway for international gold trading and solidifying Hong Kong's role as a key financial hub .
Physical Settlement: It facilitates the physical settlement of gold contracts outside mainland China .
Implications for XAU/USD:
While the new vault directly promotes yuan-denominated gold trading, its implications for XAU/USD are primarily indirect and long-term:
De-dollarization Efforts: By promoting yuan-denominated gold trading, China is actively working to reduce global reliance on the US dollar in commodity markets . If successful, a more diversified global gold trading landscape could gradually diminish the dollar's sole influence over gold prices, potentially leading to less direct inverse correlation between the dollar and gold .
Increased Demand and Liquidity: The vault aims to attract more international participants to yuan-denominated gold markets, potentially increasing overall gold demand and liquidity in the Asia-Pacific region . While this demand is primarily yuan-driven, a generally stronger global gold market could indirectly support XAU/USD .
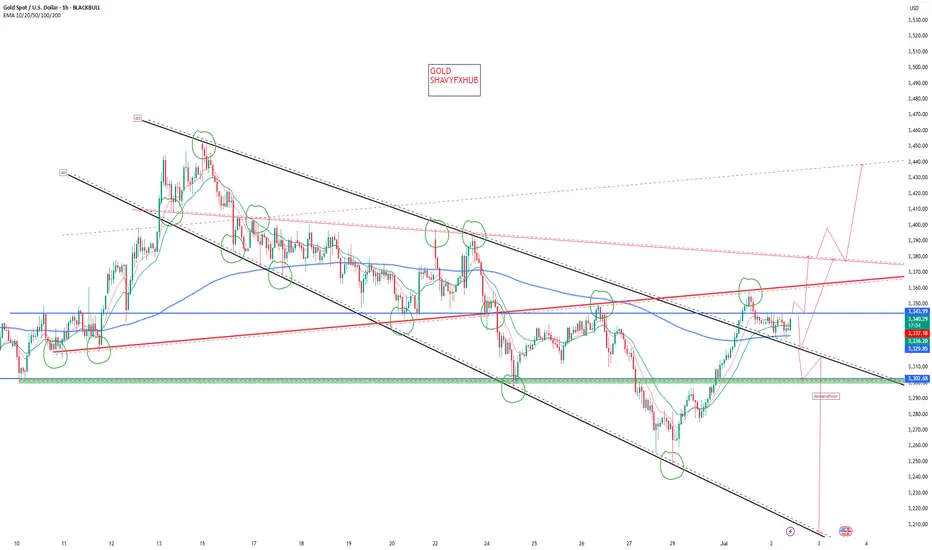
XAUUSD is about to be bullishfrom the chart, you will understand that xauusd is about to be bullish.
Reasons;
1] Third trendline touch, which is signal for reversal
2] Falling wedge pattern
Caution; Wait for the falling wedge break out for your entry. Wait patently and trade responsibly.
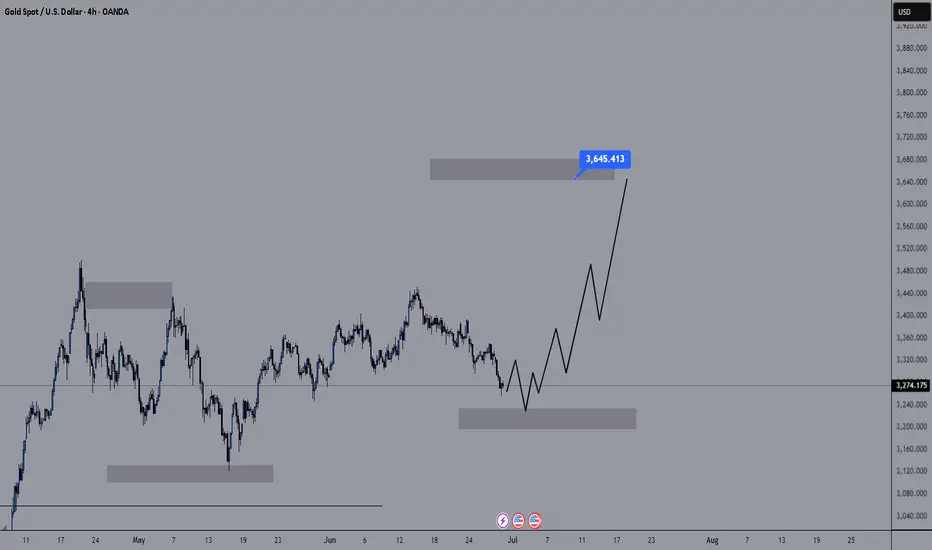
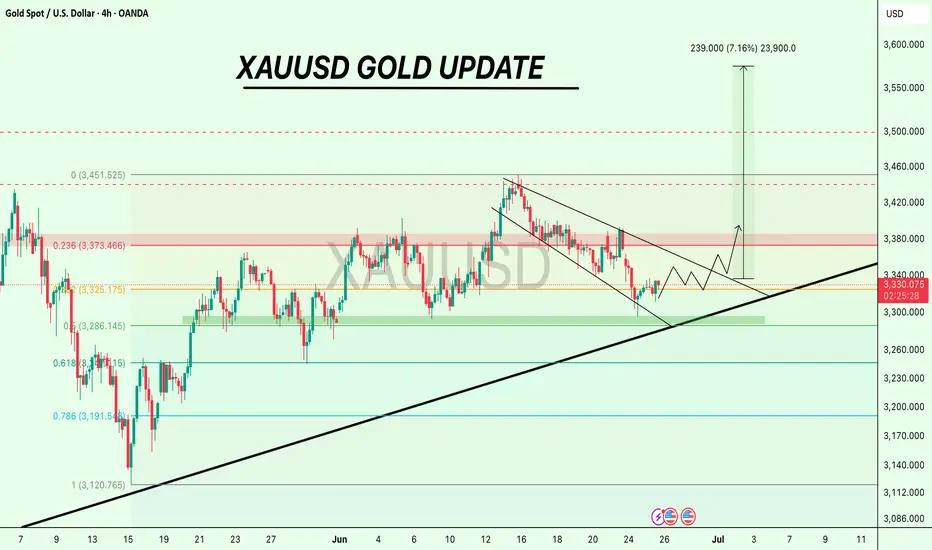
Will this growth spurt be newsless?Hello friends..
As we said in the previous analysis, we are still waiting for another upward leg. (Because the trend is bullish in the long term)
Now we are looking for buying deals in gold next week after the market opens. (Technically, it is in a good range for buying deals)
The lower area that has been identified can be a good range for buying.
You can keep the target for this deal at $3645 (which is good in terms of risk to reward).
.
I hope you have used this analysis well.
You can follow our page to see more analyses.
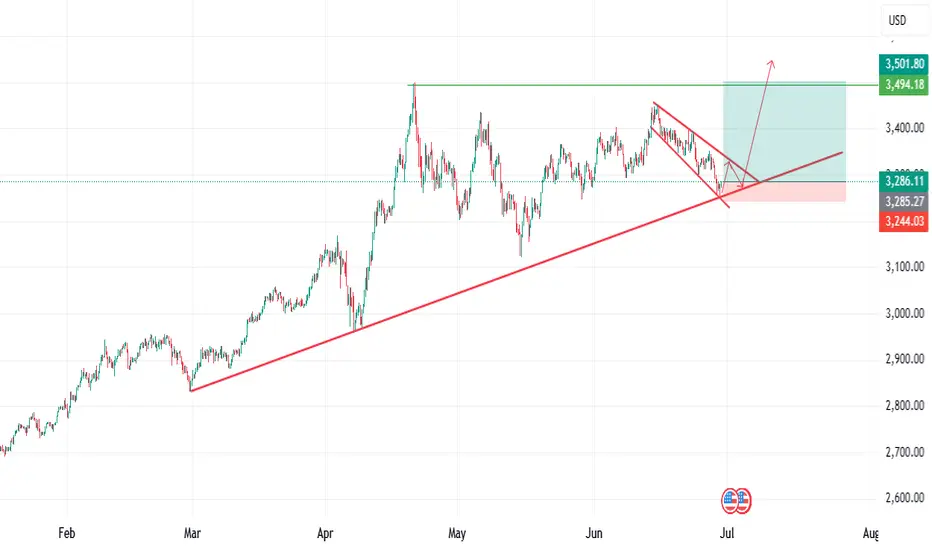
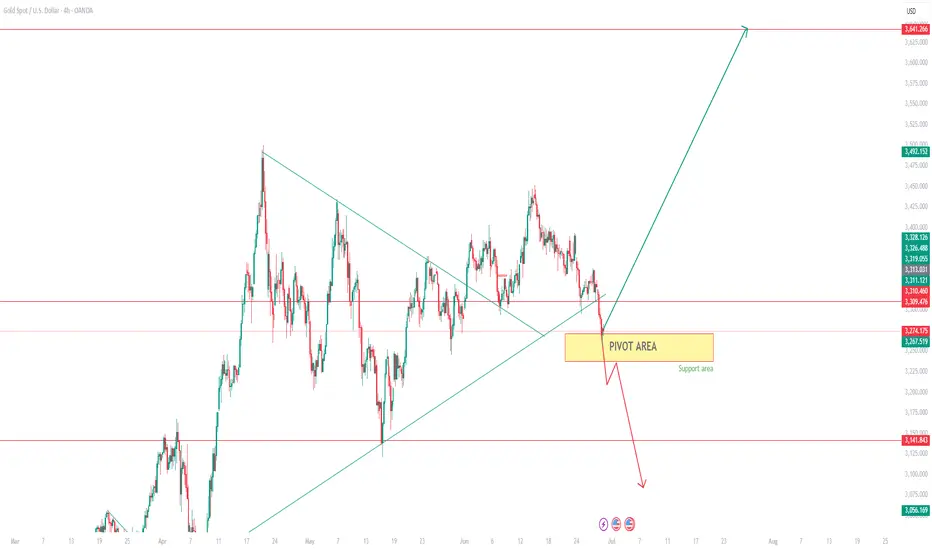
GOLD in PIVOT AREAGold is in the support area. The commodity is expected to hit the levels of 3461 in rejected from here ( 80% Chance).
However the pair can fall further if the price breaks the levels of 3200.
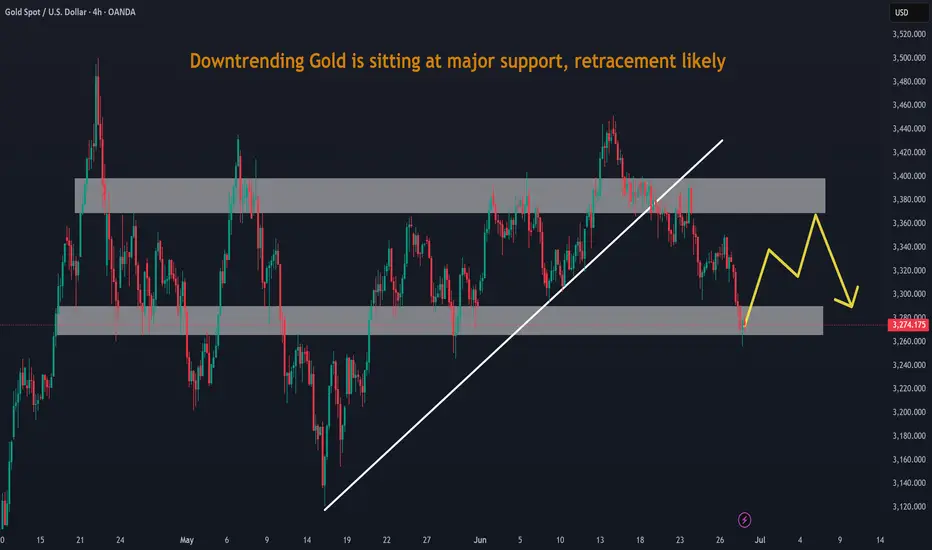
Downtrending Gold is sitting at major support, retracement likelDowntrending Gold is sitting at major support, retracement likely.
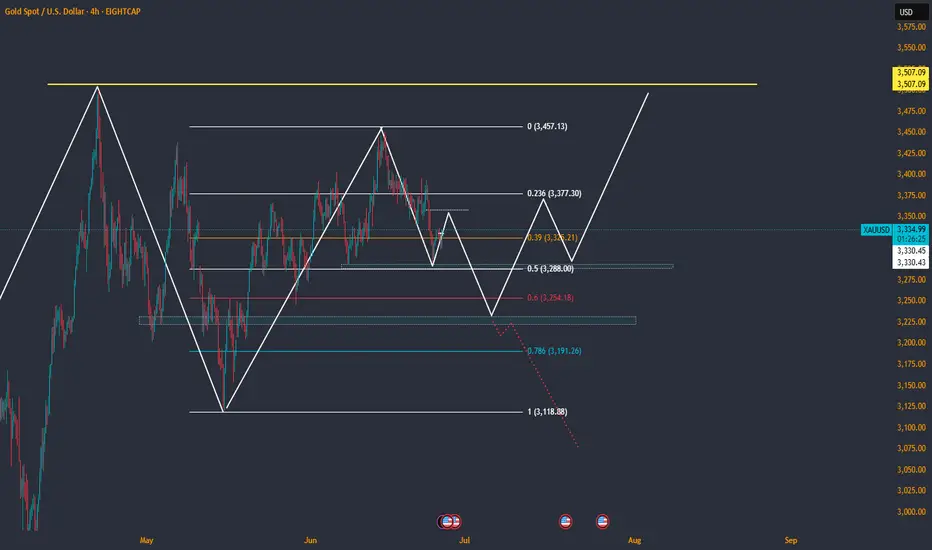
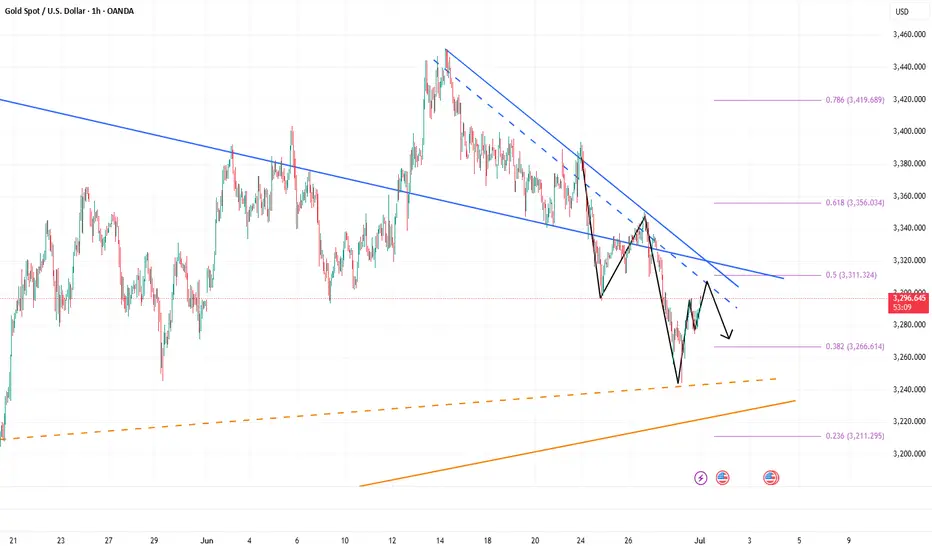
$XAUUSD Holding Key Support, Bounce Incoming?Gold is still holding the key support zone around $3,285–$3,290, which aligns closely with the 0.5 Fib retracement level.
As long as this area holds, we could see a push toward $3,320, and if momentum follows through, $3,373 (Fib 0.236) is the next key level to watch.
The structure looks solid, and buyers are showing interest.
Keep an eye on a breakout above the descending trendline. 👀
DYOR, NFA
#XAUUSD #GOLD
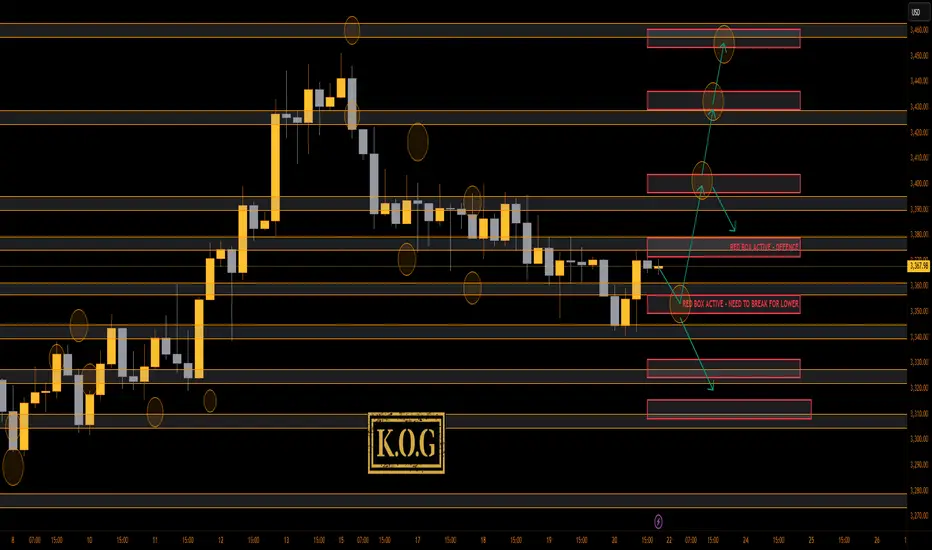
THE KOG REPORTTHE KOG REPORT:
In last week’s KOG Report we said we would be ideally be looking for the market to open, give us a high into that red box region 3455-60 and then give the reaction we wanted for the short trade. We didn’t quite hit that level falling just shy, but the move did present itself and as you can see all the bearish below red box targets were completed as well as KOG’s bias of the week targets which was bearish below 3465.
We then posted the FOMC KOG Report in which we suggested looking for price to continue the move as long as the bias level stood, which it did and we got another move downside, but again, falling just shy of the level we wanted to then attempt that swing long.
So, what can we expect in the week ahead?
As we suggested on Friday, it would be a good idea for traders to be sitting neutral on the markets with minimum to zero exposure anticipating gaps and glitches across the markets on open. This news was expected so those who played discipline should be cash in account, which is also a position in the markets.
We have key levels now 3350-55 support with extension 3340 which will need to break downside for us to go lower, while support there should take us up towards the 3385-90 level initially, which is the level to look for a potential RIP for the scalp short. This will give us the flip, red box activation 3380-75 which if held should allow us to complete the move to break through the 3400 level with red box target 3445 and above that 3451. This is based on there being a completely aggressive move from the open upside.
On the flip, break below key level here 3335 and 3320 is the first level to consider which will continue the path we wanted from last week. Ideally, not for this news and potential for this to spike upside, we would have stuck with the plan from last week. Difference now, we need more buyers higher up and a potential test on that high again.
Key Levels:
Red box defence 3375-80, needs to be broken
Red box defence 3350, needs to be broken
KOG’s bias of the week:
Bullish above 3340 with targets above 3375, 3390, 3395 and above that 3410
Bearish on break of 3340 with targets below 3330, 3320, 3310, 3306 and below that 3298
RED BOX TARGETS:
Break above 3375 for 3378, 3390, 3395, 3406, 3410 and 3419 in extension of the move
Break below 3365 for 3355, 3350, 3340, 3336, 3330 and 3323 in extension of the move
Please do support us by hitting the like button, leaving a comment, and giving us a follow. We’ve been doing this for a long time now providing traders with in-depth free analysis on Gold, so your likes and comments are very much appreciated.
As always, trade safe.
KOG
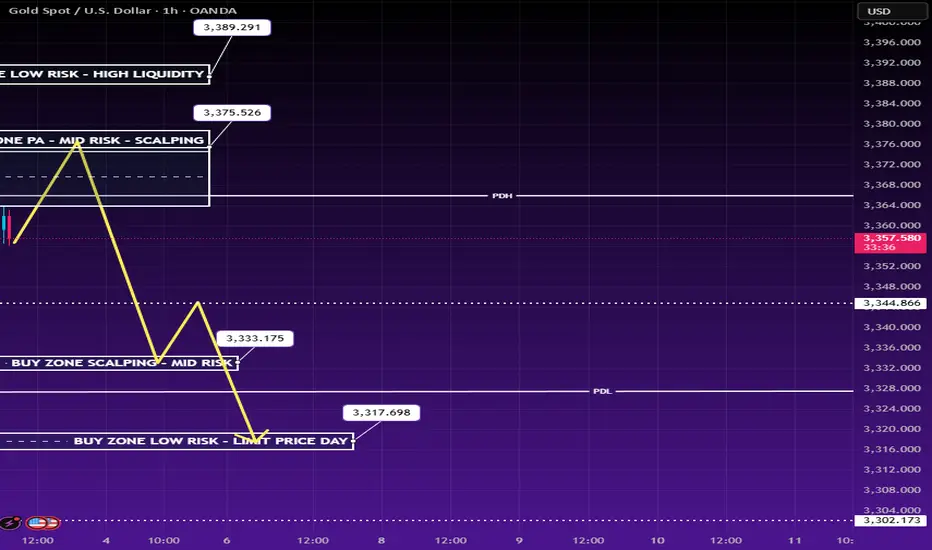
Gold at Key Level Before NFP – Big Move Loading ?📉 Fundamental Analysis
Gold remains in a strong bullish structure, supported by multiple macroeconomic and political drivers:
ADP Employment Report Missed Expectations: With a shocking -33K reading, market sentiment shifted firmly against the US Dollar, pushing gold higher.
Fed’s Easing Outlook: Markets are now pricing in a 90% probability of a rate cut in Q3, weakening real yields and supporting demand for gold.
Trump’s “Super Bill” Momentum: Political cohesion among Republicans has re-ignited fiscal stimulus expectations, fuelling concerns over long-term US debt sustainability—another tailwind for gold as a safe haven.
🧠 Smart Money Technical Framework (H1)
Price has moved into a Premium FVG Zone, showing signs of potential exhaustion after forming a clear CHoCH and bullish BOS. The current zone (3,375 – 3,376) aligns with a mid-risk sell region, where price may experience short-term rejection before revisiting demand zones.
Market structure suggests liquidity sweep potential towards the downside before any continuation of the larger bullish trend.
📊 Trading Strategy – Smart Money Zones & Key Levels
🔵 BUY SCALP: 3,334 – 3,333
🔴 SL: 3,329
✅ TP: 3,340 → 3,344 → 3,350 → 3,360
🔵 BUY ZONE LOW RISK: 3,317 – 3,316
🔴 SL: 3,311
✅ TP: 3,320 → 3,325 → 3,330 → 3,336 → 3,345 → 3,350 → 3,360
🔴 SELL SCALP ZONE: 3,375 – 3,376
🔴 SL: 3,380
✔️ TP: 3,370 → 3,366 → 3,360 → 3,355 → 3,350
🔴 SELL ZONE HIGH PROBABILITY: 3,388 – 3,390
🔴 SL: 3,394
✔️ TP: 3,384 → 3,380 → 3,376 → 3,370 → 3,366 → 3,360
📌 Notes:
Be cautious ahead of NFP data and the upcoming US bank holiday—expect liquidity traps and sudden volatility.
This setup is ideal for intraweek scalping and liquidity-based reversals.
All trades follow Smart Money Concepts logic: premium vs. discount zones, CHoCH + BOS confirmations, and institutional order flow anticipation.
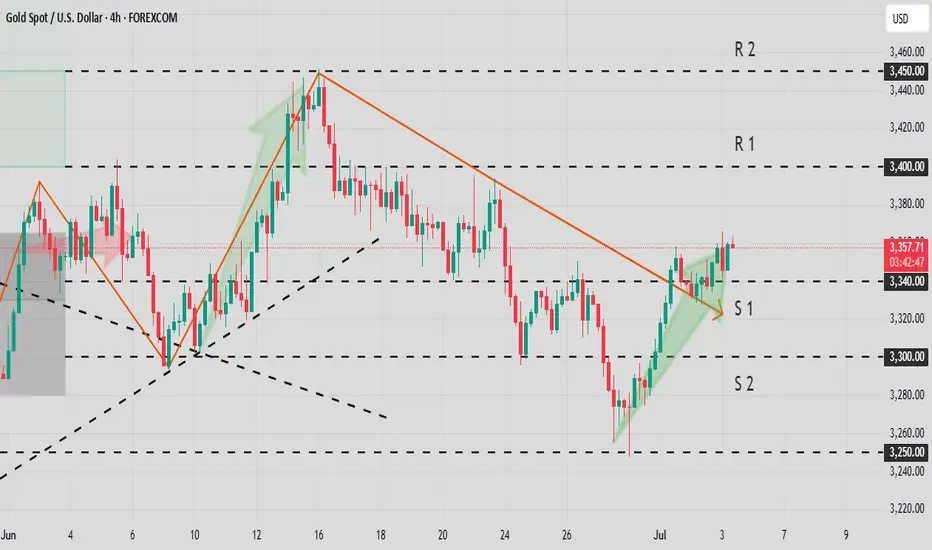
XAUUSD Today's strategyGold prices are consolidating around $3,350 today, with the current resistance level above seen at $3,370 and the support level below at $3,340.
From a technical perspective, the 4-hour chart shows an ascending triangle pattern, with the bottom gradually lifting. If the price can effectively break through the $3,370 resistance, it is expected to subsequently launch an assault on the $3,400 integer mark. In terms of technical indicators, the RSI currently stands at 58, which has not yet entered the severely overbought range, suggesting there is still room for upward movement; the MACD indicator also shows that bullish momentum is slowly recovering, waiting for a breakout signal to confirm the direction.
On the operational front, considering going long around $3,340 could be a viable option. It is particularly important to note that the U.S. non-farm payroll data will be released today, which may have a significant impact on the short-term trend of gold. It is advisable to liquidate positions and wait on the sidelines before the data release to avoid potential risks from sharp fluctuations.
XAUUSD
buy@3335-3345
tp:3360-3370
I am committed to sharing trading signals every day. Among them, real-time signals will be flexibly pushed according to market dynamics. All the signals sent out last week accurately matched the market trends, helping numerous traders achieve substantial profits. Regardless of your previous investment performance, I believe that with the support of my professional strategies and timely signals, I will surely be able to assist you in breaking through investment bottlenecks and achieving new breakthroughs in the trading field.
XAUUSD | BearishGold seems to be entering into a bearish trend after testing its resistance area.It is going to print new LHs and LLs.
Gold short from 3357Aiming for that gap . i think today gold will close it and reversal on the ny session is coming.
Short gold, it will fall again when encountering resistanceIn the short term, gold retreated to around 3274 and then rebounded again, and it is only one step away from 3300. Will gold regain its bullish trend again?
I think it is difficult for gold to break through in the short term. Although gold retreated to around 3274 and successfully built a double bottom structure with the second low point and the low point of 3245, it only increased the rebound space; it is not enough for gold to regain its bullish trend. Since gold fell and broke through, the confidence of bulls has been hit hard. The previous support at the technical level has formed a strong resistance area after the top and bottom conversion, and to a certain extent helped the short force. In the short term, gold faces resistance in the 3310-3320 area. Before gold breaks through this area, the short energy still has the upper hand.
Therefore, shorting gold is still the first choice for short-term trading.
It is appropriate to consider shorting gold in batches in the 3300-3320 area, and look at the target: 3385-3375-3365
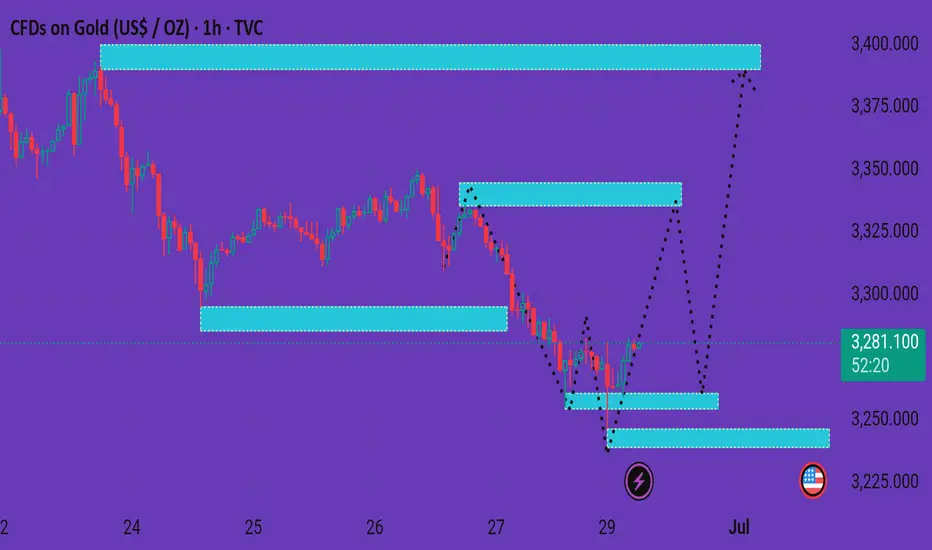
Xauusd market The chart you've shared is a 1-hour timeframe for Gold (CFDs on Gold, US$ / OZ) and seems to illustrate a potential bullish reversal scenario. Here's a detailed breakdown:
---
🔍 Chart Overview
Current Price: 3,280.920
Recent Movement: Price has been in a downtrend but recently formed a potential bottom with some sideways consolidation.
---
🟦 Highlighted Zones
1. Support Zone (Bottom - ~3,240)
Marked with a U.S. flag emoji (likely news-related support).
Price previously bounced from this zone — a key area of demand.
2. Mid-Level Supply/Resistance Zone (~3,300–3,320)
Price may test this zone if bullish momentum continues.
A key intraday resistance to watch.
3. Upper Supply Zone (~3,360–3,400)
If price breaks the mid-level zone, this is the next potential target.
Final bullish target area.
---
📈 Projected Paths (Dashed Lines)
Primary Scenario:
Bounce from current level → retest mid-resistance (~3,320) → possible breakout → target upper zone (~3,400).
Alternative Scenario:
Slight retracement back to the lower support (~3,260–3,245) before rallying to higher zones.
---
🔄 Interpretation
Bullish Bias: The chart is structured for a bullish reversal.
Confirmation Needed: A break and hold above the mid-resistance (~3,320) would validate the bullish path.
Risk Zone: If price falls below the bottom support (~3,240), the bullish setup may be invalidated.
---
Would you like a trading plan or entry/exit suggestion based on this setup?
My Weekly Review and Some tierlist for the zones I madeHello guys. its end of the week and I wanna share you my journey since monday until today. I also tell you the real reason why I don't believe the bottom is in yet and holding my swing sell. Thank you for watching.

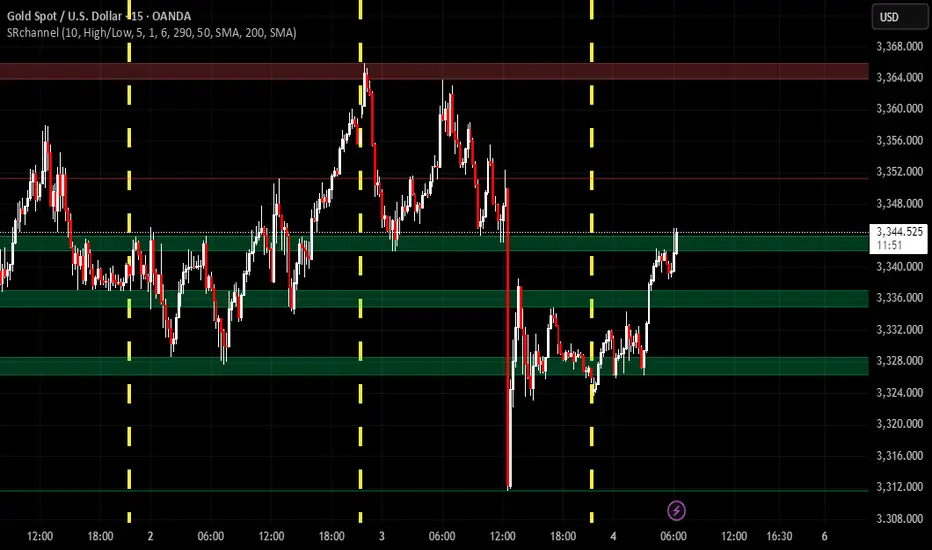
Gold Market Analysis Current Price: 3341.58
Market Behavior:
The price is ranging sideways, trading in a tight consolidation zone just below the resistance zone (around 3344).
Key Resistance Levels:
3344 → Immediate resistance
3348 – 3352 → Next minor supply zone
3357 – 3360 → Strong resistance ahead (if breakout occurs)
Key Support Levels:
3332 – 3330 → Short-term demand
3324 – 3320 → Stronger support zone
📌 Trader Insight:
"Gold is in a consolidation phase between 3330 and 3344. Wait for a confirmed breakout above 3344 for bullish momentum toward 3357+. If rejected again, expect a retest of support near 3332 or deeper."
✅ Trade Setup (Example):
Buy Scenario (Breakout):
Entry: Above 3345
Target: 3357
Stop Loss: Below 3338
Sell Scenario (Rejection):
Entry: Near 3344 resistance, if rejected
Target: 3332 / 3324
Stop Loss: Above 3348
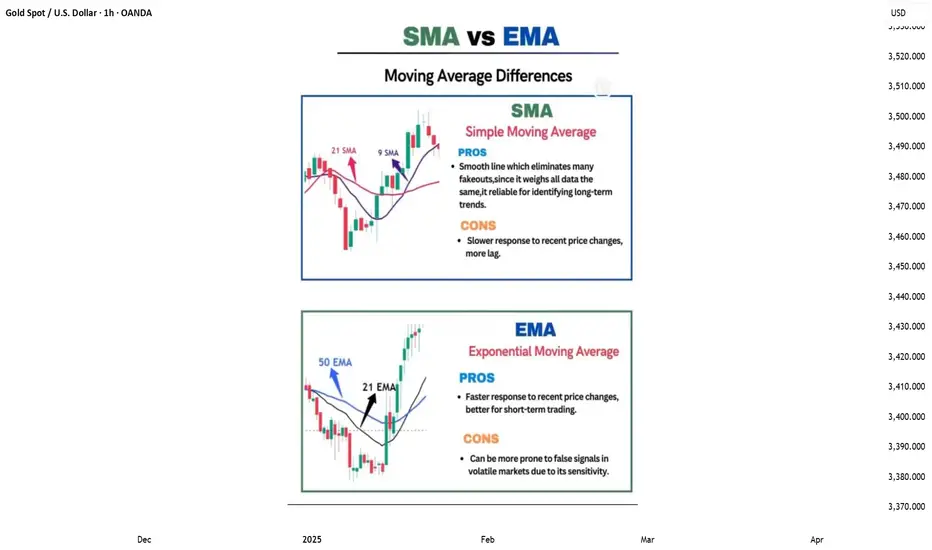
TRADING KNOWLEDGE – MOVING AVERAGE (MA)The Moving Average (MA) is a popular technical indicator that helps smooth out price data to better identify market trends. MA doesn't predict the future but helps traders clearly see the current direction of the market.
🔍 2 Main Types of MA:
🔔 SMA (Simple Moving Average): The average of closing prices over a set period (e.g., SMA 20 = average of the last 20 candles).
🔔 EMA (Exponential Moving Average): Similar to SMA but gives more weight to recent prices, making it more responsive to market changes.
📈 What is MA used for?
📍Trend Identification:
💡Upward sloping MA → Uptrend
💡Downward sloping MA → Downtrend
📍Trading Signals:
💡Price crossing above MA → Buy signal
💡Price crossing below MA → Sell signal
📍Combining Two MAs (Short & Long Term):
💡Short MA crosses above long MA → Buy signal (Golden Cross)
💡Short MA crosses below long MA → Sell signal (Death Cross)