GOLD Price Analysis: Key Insights for Next Week Trading DecisionIn this video, I break down last week’s gold price action and give you a detailed outlook for the week ahead. With gold closing around $3,260 and major macroeconomic shifts unfolding—including the Israel-Iran ceasefire talks, rising US dollar strength, and concerns over the US Q1 GDP contraction, we are at a turning point.
📉 Will weakening economic data force the Fed to pivot?
📈 Could this create a fresh bullish wave for gold?
Or will stronger job numbers and inflation data drag gold lower?
✅ What you’ll learn in this video:
✅Key fundamental drivers affecting gold (XAU/USD)
✅Important economic events to watch (Fed Chair speech, NFP, ISM)
✅My technical analysis of gold price levels to watch
✅How to read the current market sentiment like a pro
✅Strategic trading zones for bulls and bears
🔔 Don’t forget to like the video in support of this work.
Disclaimer:
Based on experience and what I see on the charts, this is my take. It’s not financial advice—always do your research and consult a licensed advisor before trading.
#xauusd, #goldprice, #goldanalysis, #goldforecast, #goldtrading, #xauusdanalysis, #technicalanalysis, #fundamentalanalysis, #forextrading, #forexmentor, #nfpweek, #goldoutlook, #tradingstrategy, #chartanalysis, #julyforecast, #fedwatch, #priceaction, #traderinsights, #commoditytrading, #marketbreakdown, #xauusdforecast, #tradethefundamentals, #smartmoneytrading
XAUUSD trade ideas

XAUUSD📉 The Setup: Bullish Divergence on XAUUSD (15m/30m)
Buy only on Breakout
🔍 Observation:
On the 30-minute timeframe, price made a lower low while the RSI indicator printed a higher low — classic sign of bullish divergence 🔄.
💡 Translation: Bears are losing steam! Bulls may be preparing to charge in! 🐂⚡
📊 Trade Plan – Long Entry
Monday Outlook on Gold (XAU/USD)My outlook for Monday is bearish at the start of the session, with price likely to drop toward the 3310–3300 area. This level aligns with a key discount zone inside the Gann box, and also overlaps with a 4H Fair Value Gap (FVG), making it a strong area of interest for potential long setups.
From that zone, I expect a bullish reaction, leading to a move back up to the trendline.
If the momentum continues, I anticipate a break of the trendline, followed by a retest, and then the beginning of a bullish trend.
I’ll be looking for confirmations around 3300 to position for the move higher.
Let’s see how Monday opens.
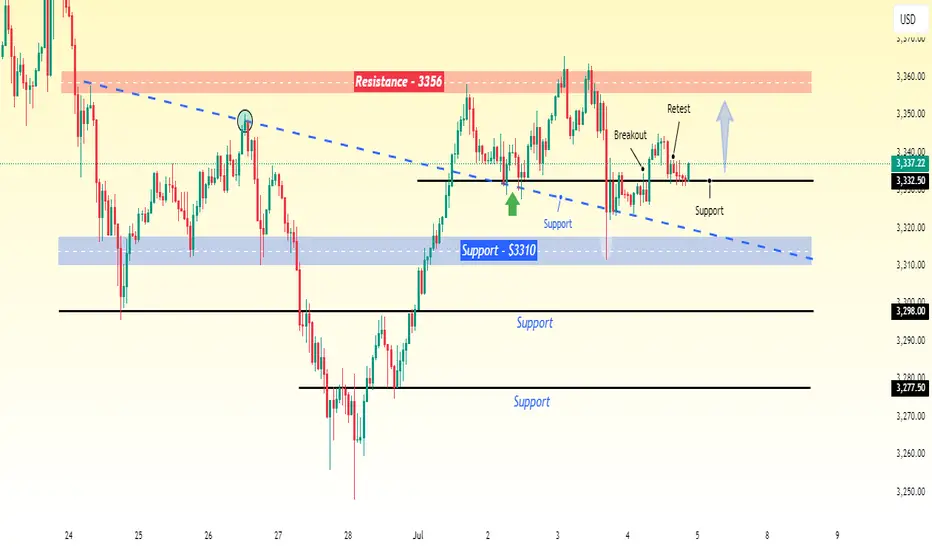
Gold Holding Strong – A Move to $3356 Could Be NextGold is currently trading at $3337, which is an important support level. Earlier, the price dropped to around $3310, but it has since started to recover from that level. This bounce suggests that buyers are stepping in, and the market is showing some strength.
Based on this recovery and the strong support at $3332.50, I expect the price of gold to move higher, possibly reaching around $3356 in the short term.
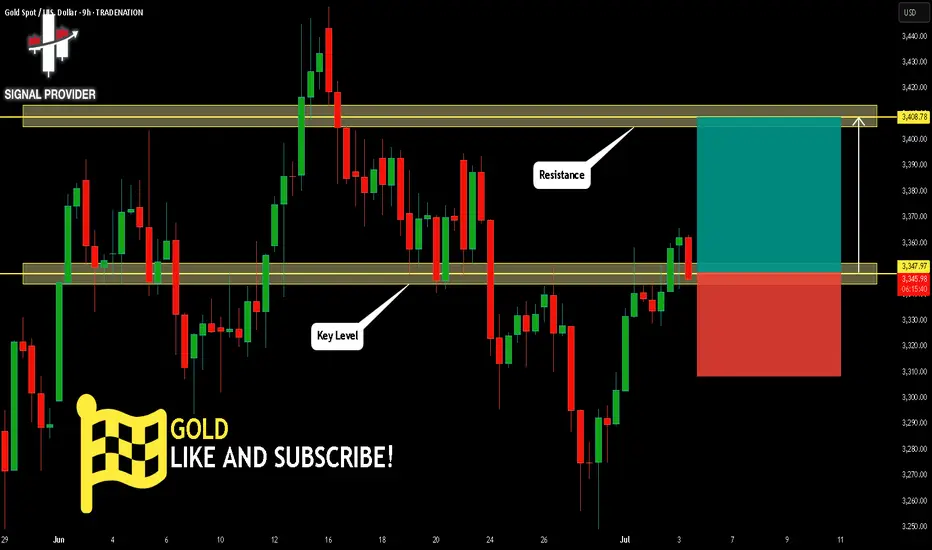
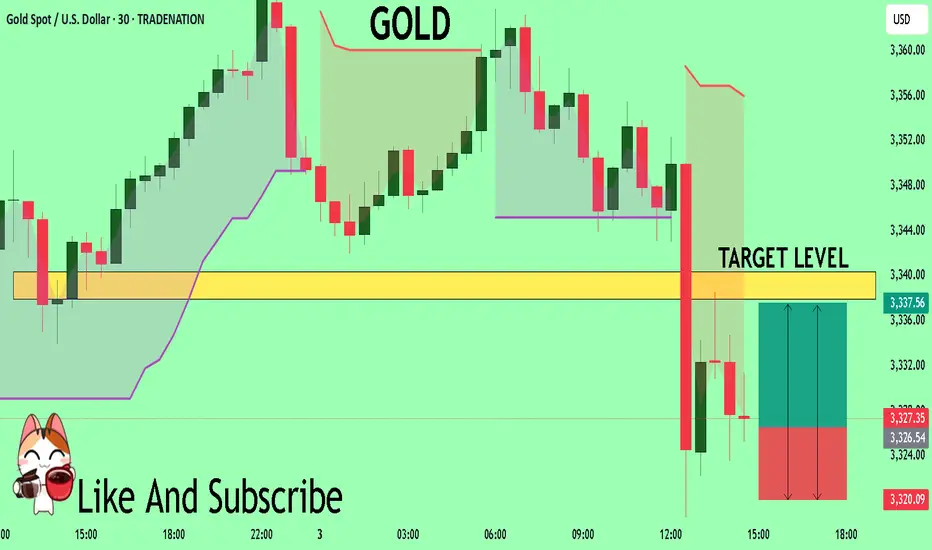
GOLD Will Move Higher! Long!
Here is our detailed technical review for GOLD.
Time Frame: 9h
Current Trend: Bullish
Sentiment: Oversold (based on 7-period RSI)
Forecast: Bullish
The market is approaching a significant support area 3,347.97.
The underlined horizontal cluster clearly indicates a highly probable bullish movement with target 3,408.78 level.
P.S
The term oversold refers to a condition where an asset has traded lower in price and has the potential for a price bounce.
Overbought refers to market scenarios where the instrument is traded considerably higher than its fair value. Overvaluation is caused by market sentiments when there is positive news.
Disclosure: I am part of Trade Nation's Influencer program and receive a monthly fee for using their TradingView charts in my analysis.
Like and subscribe and comment my ideas if you enjoy them!
GOLD DAILYThe ADP Non-Farm Employment Change report for today showed a surprising decline of 33,000 jobs, well below the forecast of a 99,000 forecast and down from the previous month’s modest gain of 29,000 jobs.
Key Details:
This negative figure indicates that private businesses in the US shed 33,000 jobs in June, marking a contraction in private-sector employment—the weakest report since March 2023.
The report is produced by the ADP Research Institute, which uses anonymized payroll data from about 26 million workers to estimate private-sector employment changes ahead of the official government Non-Farm Payrolls (NFP) report.
The decline reflects ongoing uncertainty among employers amid policy and economic challenges, including tariff impacts and consumer caution.
Market Implications:
The unexpected job losses may raise concerns about the health of the US labor market and the broader economy.
This data could increase expectations for Federal Reserve rate cuts or a more dovish stance, potentially weighing on the US dollar and boosting safe-haven assets like gold and silver.
However, the ADP report often diverges from the official NFP, so markets will closely watch the upcoming government jobs data for confirmation.
In summary:
June’s ADP report revealed a contraction of 33,000 private-sector jobs, far below expectations, signaling caution in US labor market hiring and adding uncertainty to the economic outlook ahead of the official payrolls release.
#gold #xauusd

Gold is moving in a range-bound consolidation.The ADP employment data in the U.S. unexpectedly cooled down, with private sector employment dropping by 33,000 in June, far below the market expectation of an increase of 95,000. The previous value was revised down from 37,000 to 29,000, marking the largest single-month decline since March 2023. Meanwhile, the Challenger Enterprise Layoff Report showed that the number of layoffs in June was 48,000, with a monthly rate decrease of 48.84% and an annual rate decrease of 1.6%. Compared with the previous value of 93,800, it has significantly declined, indicating that the layoff pressure has eased. After the release of the ADP data, the U.S. Dollar Index fell sharply in the short term, and gold, as a safe-haven asset, rose rapidly. Gold showed a high-level consolidation trend. After repeatedly stabilizing in the 3,327 area, it rebounded and hit the resistance at around 3,351 U.S. dollars, lingering there. It is expected that the range consolidation of gold may face pressure.
you are currently struggling with losses,or are unsure which of the numerous trading strategies to follow,You have the option to join our VIP program. I will assist you and provide you with accurate trading signals, enabling you to navigate the financial markets with greater confidence and potentially achieve optimal trading results.
Trading Strategy:
buy@3330-3335
TP:3360-3365
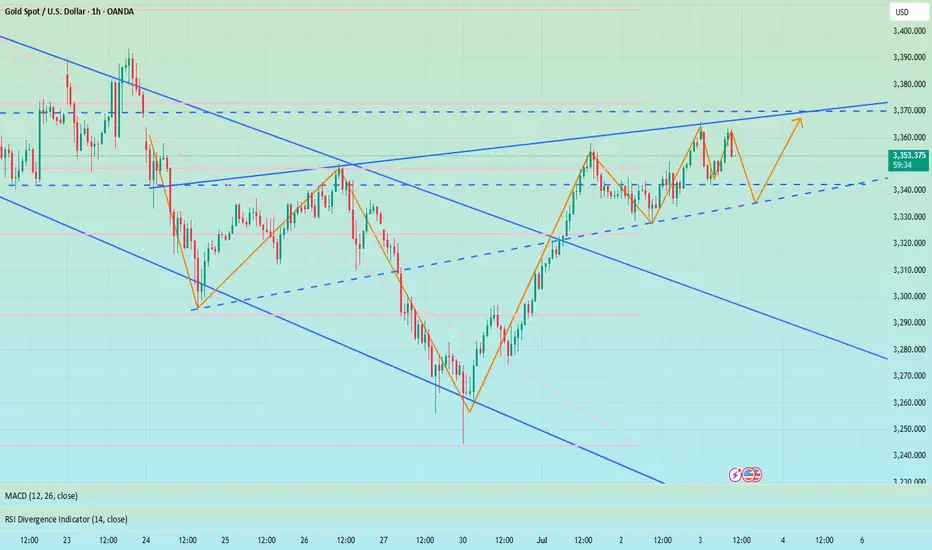
Will Gold Continue Its Strong Rally or Face a Pullback?XAUUSD 02/07: Will Gold Continue Its Strong Rally or Face a Pullback?
📉 Technical Analysis – Gold Faces Short-Term Pullback After Strong Rally
Gold has been experiencing a clear rally in recent days, but it’s currently undergoing a brief correction. The price has recently dropped slightly, prompting traders to keep a close eye on key levels for potential reversal or continuation of the bullish move.
🌍 Macroeconomic Context – Factors Impacting Gold's Price
USD Fluctuation: The weakness in the US Dollar continues to affect gold prices, creating opportunities for the precious metal to maintain its upward movement.
Geopolitical Tensions: Ongoing global tensions, including the US-Iran conflict, act as a safe-haven factor, supporting gold demand.
Interest Rate Expectations: The market is closely watching for any changes in interest rate policies. Any future rate cuts by the Fed could further bolster gold's price.
📊 Technical Outlook (H1 – H4 – D1)
Short-Term Trend: On the H1 timeframe, the price of gold touched a key level near 3340. From there, the price began to experience a pullback. However, the upward momentum remains strong on higher timeframes.
Key Support Levels: The 3300 level remains a crucial support. If the price stays above this, there’s a chance for gold to continue rising towards higher levels.
Key Resistance Levels: 3360 and 3380 are critical resistance levels. If breached, gold could move towards new highs.
📍 Important Support and Resistance Levels:
🔺 Resistance: 3345 – 3360 – 3380 – 3400
🔻 Support: 3300 – 3290 – 3270 – 3250
💡 Trading Plan for Today, 02/07:
🔵 BUY ZONE:
📈 Entry: 3305 – 3303
📉 SL: 3297
💰 TP: 3315 → 3325 → 3340 → 3360
🔴 SELL ZONE:
📉 Entry: 3360 – 3362
📈 SL: 3368
💰 TP: 3350 → 3340 → 3320
📣 Conclusion:
Gold is showing signs of short-term correction but remains a strong asset due to geopolitical factors and monetary policies. Buying opportunities continue to be attractive at support levels, while key resistances will play a crucial role for any breakout. Keep an eye on the mentioned levels to capitalize on market movements.
Happy trading and best of luck to all traders!
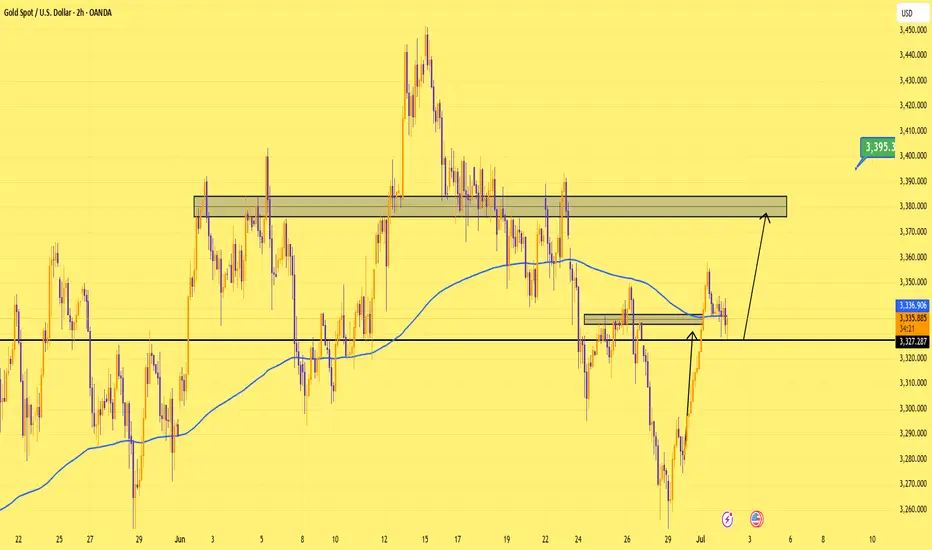
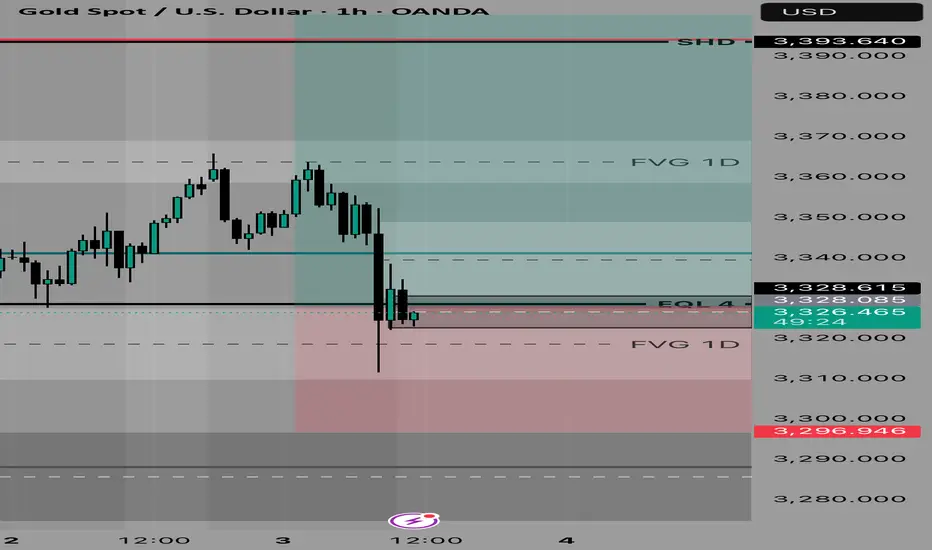
Gold’s Got Legs — as Long as 3,327 Holds Price respected the zone perfectly, bouncing clean off support around 3,327.
Structure still intact — bulls defending well.
I'm personally expecting weaker US data, which could be the catalyst to drive us toward 3,380.
Simple setup. Clear target. Now it’s up to the market to deliver.
XAUUSD SHORT IDEAH4 BEAR ENGULF
TARGET 61.8 FIB LEVEL AND EMA CONFLUENCE
Rejecting EMA
Await 30 min confirmation to enter possibly during asian session
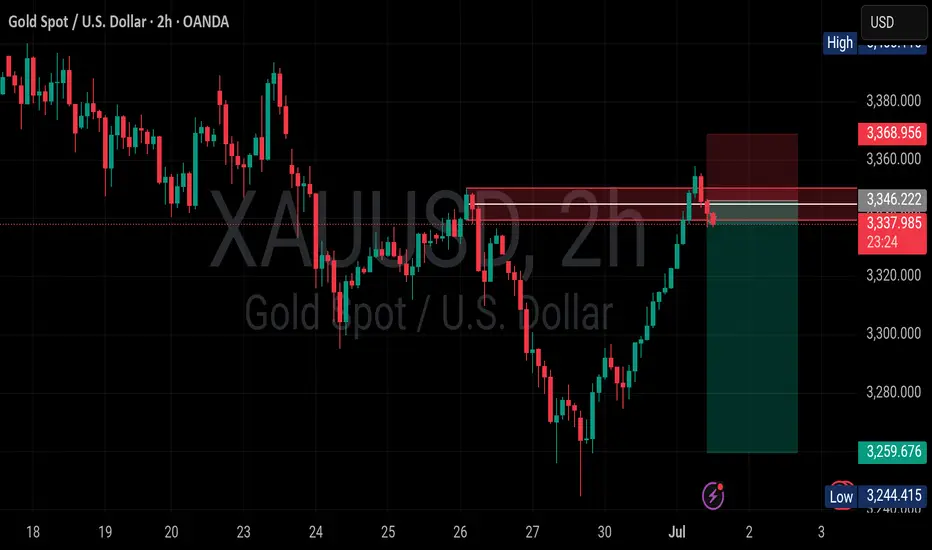
XAU USD 2HR CHART ANALYSIS 🔎 XAUUSD (Gold Spot) 2H Chart Analysis:
✅ Price recently made a strong bullish rally up to the resistance zone between 3346–3368.
✅ A supply zone has been marked in this area, which is currently causing a bearish reaction.
✅ BOS (Break of Structure) and ChoCH (Change of Character) labels on the chart indicate that the overall market structure has been bearish, and price has now retraced to this supply area for a potential pullback.
✅ The trader appears to have taken a short position with a stop loss around 3368 and a target around 3259, giving a risk-reward ratio of approximately 1:3.
---
🔎 Possible Scenarios:
✅ Bearish Scenario (preferred):
If the supply zone at 3346–3368 holds and price rejects from there, the logical target could be the previous support near 3259, in line with market structure and bearish momentum.
✅ Bullish Scenario (invalidation):
If price breaks above 3368 with strength and confirms a candle close above, that would invalidate the supply zone, and the uptrend may resume toward higher levels around 3418 (previous highs).
---
🔎 Key Levels:
✔️ Resistance (Supply Zone): 3346–3368
✔️ Support (Demand Zone): 3259–3244
✔️ Market Structure: bearish, with a pullback into supply
✔️ Stop loss (for the short): above 3368
✔️ Target: around 3259
---
This analysis is not financial advice and does not constitute a trade recommendation.
OANDA:XAUUSD
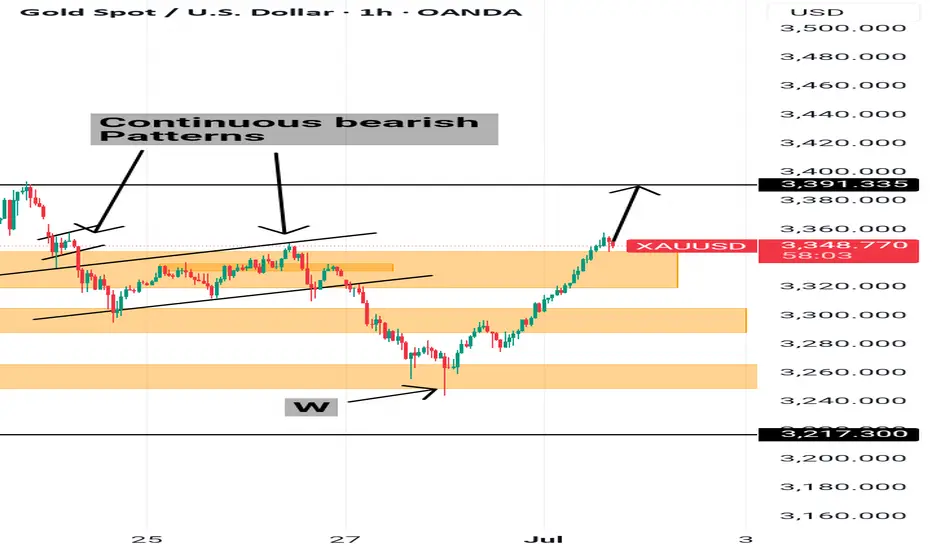
Potential Buy opportunity Gold had formed a W formation and moved upward quite a bit, it has created a pull back with the current bearish candle that has a nice wick.
It is also on a support, which evidence of the continuous bearish pattern on the left.
Entry at this point would be good in order to have a smaller stop loss.
#XAUUSD 30MIN 📉 #XAUUSD 30m Sell Setup – Bearish Continuation Ahead
Gold is currently retracing after a strong drop, consolidating within a short-term Supply Zone. We anticipate a temporary bullish push toward the 3345–3350 premium area, where the broader bearish trend is expected to resume.
🔻 Sell Zone: 3345 – 3350 (Supply / OB Zone)
🎯 Targets: 3300 → 3260
❌ Stop Loss: Above 3358
⚠ Note: This is a short-term retracement, not a trend reversal.
We expect selling pressure to return once price taps into the 3350 Order Block, in line with the higher timeframe bearish structure.
#gold #XAUUSD #forexsignals #SmartMoney

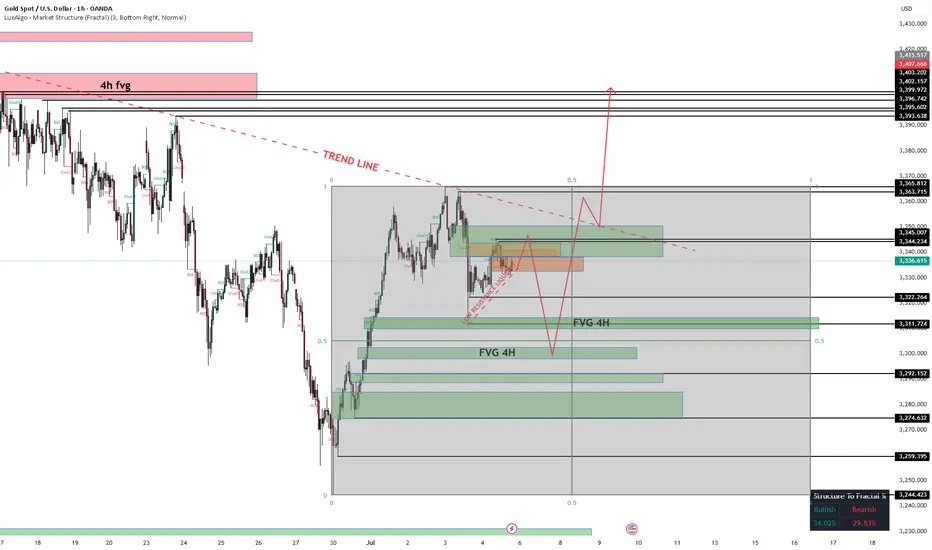
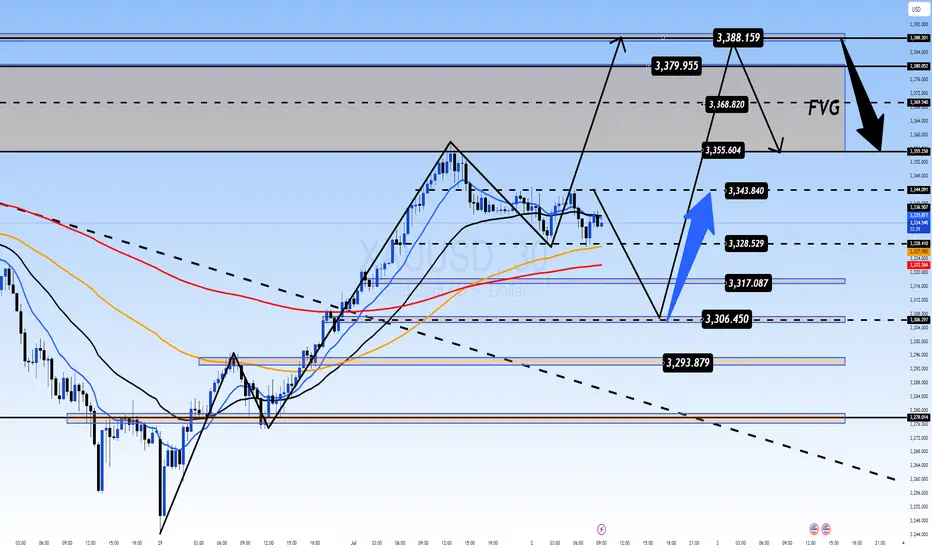
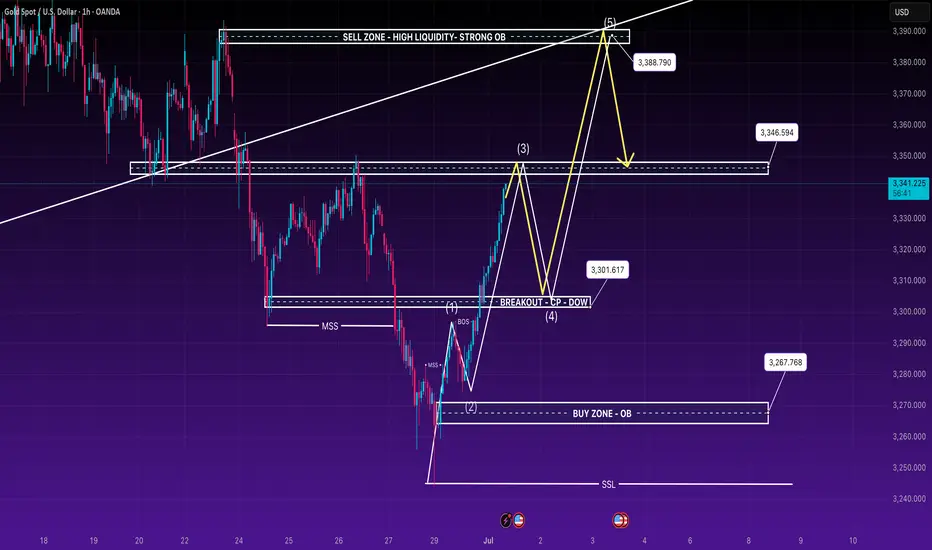
XAUUSD 01 July - Price pushing into premium zone 🔹 Macro Structure:
Gold has successfully broken structure (BOS) after forming a bullish shift in market structure (MSS) around the 326x – 327x zone.
Current price action is respecting internal bullish order flow, with higher highs and higher lows being maintained.
Breakout above 3300 psychological level + recent BOS confirms bullish intent.
🔹 Liquidity Map:
Buy-side liquidity is still resting above 3350 and into the strong OB at 3388, where a potential sell-side reaction could occur.
Sell-side liquidity below 3267 has not been swept recently, meaning deeper retracements may still occur after internal liquidity is cleared.
🔹 Expectation:
Current wave is likely in impulse phase (Wave 3 → Wave 5) aiming for 3388 OB.
A retracement into the discount zone (3301 – 3303 OB) is ideal for a continuation trade.
Watch for bearish signs near 3388 – this zone aligns with high liquidity, strong OB, and trendline confluence.
🔵 BUY SETUP (Retracement entry – continuation)
Buy Zone: 3301 – 3303 OB
Entry Trigger: Bullish engulfing / FVG fill
Stop Loss: Below 3297 (below recent swing low)
Targets: 3306 – 3310 – 3315 – 3320 – 3330 – 3346 – 3388
🔴 SELL SETUP (Reversal entry – premium zone)
Sell Zone: 3348 – 3350 (mitigation area)
Entry Trigger: CHoCH + bearish rejection wick
Stop Loss: Above 3354
Targets: 3344 – 3340 – 3335 – 3325 – 3310 – 3300
✅ Alternative Entry (Low sweep)
Buy Limit: 3270 – 3267 (deep OB + SSL zone)
SL: 3262
TP: 3280 – 3290 – 3300 – 3315+
⏳ Wait for price to confirm intention via structure + liquidity reaction before entering trades.
🧠 SMC traders: focus on manipulation zones, OBs, and internal BOS for precision entries.
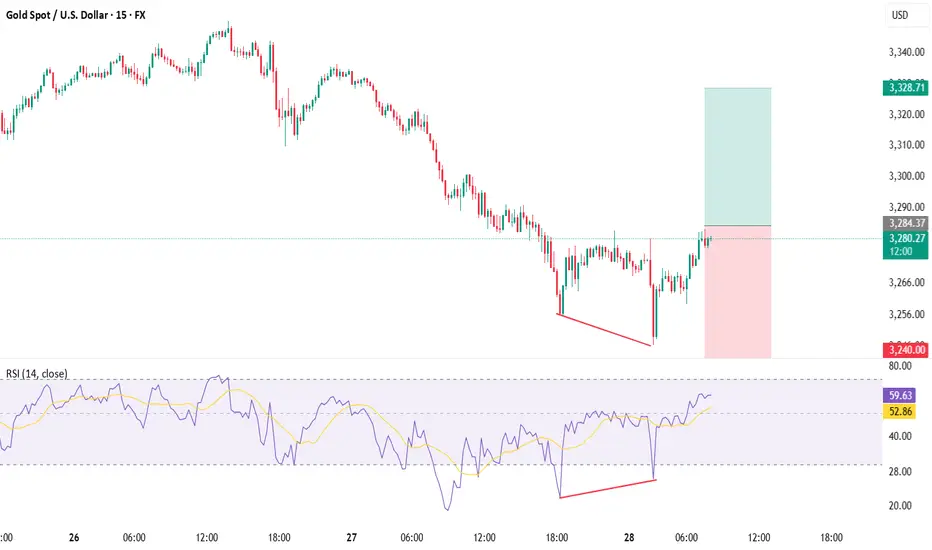
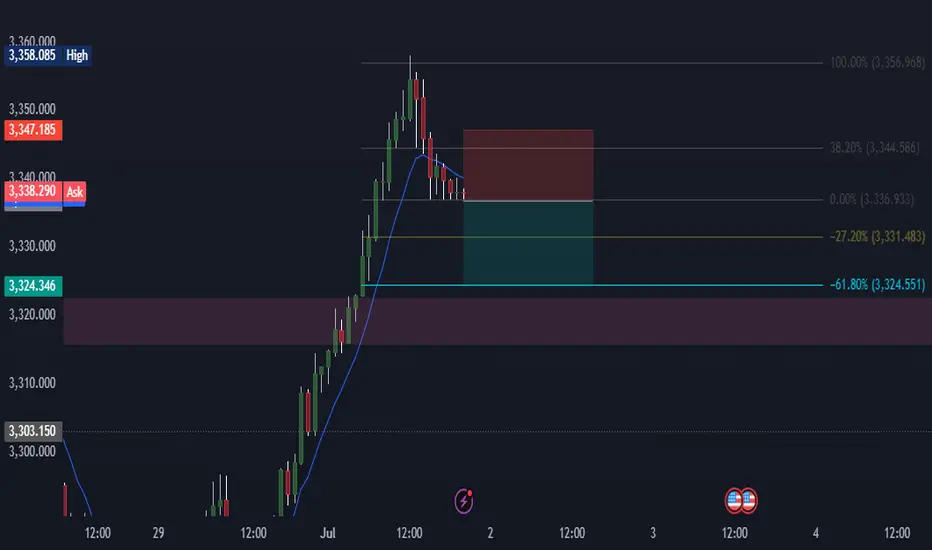
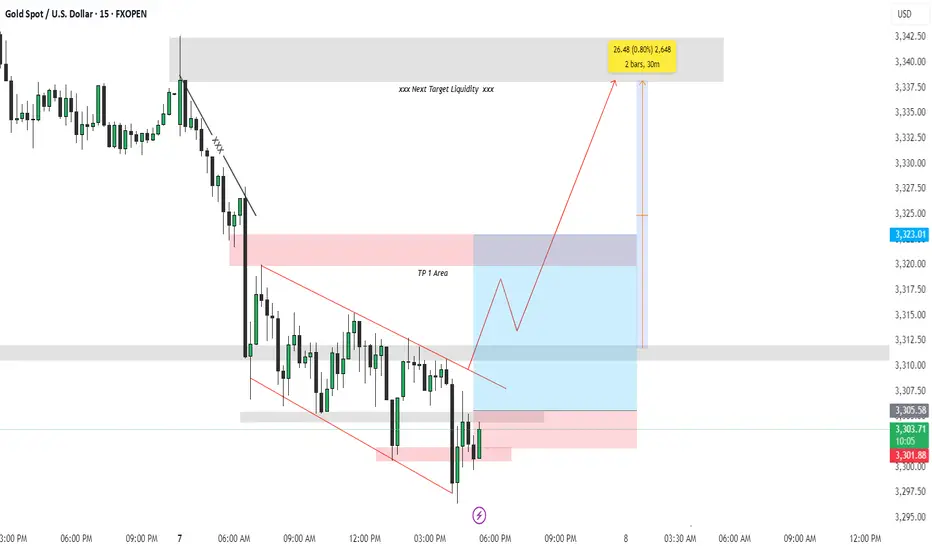
Trade Breakdown: XAUUSD 15-Min | Liquidity Grab + Reversal PlayOANDA:XAUUSD
Psychological Setup
This trade is rooted in the psychology of smart money and retail behavior. After a sharp drop in price, most retail traders expect continuation (trend-following). However, institutions often manipulate liquidity zones — hunting for stop-losses before a true reversal. This trade capitalizes on that behavior.
🔍 Technical Explanation:
🔻 1. Market Structure:
Price was previously in a downtrend, forming lower highs and lower lows.
A falling wedge pattern (red lines) formed after a strong bearish move, signaling potential bullish reversal.
Price broke the wedge to the upside — a classic reversal signal.
🔁 2. Liquidity Concept:
Below the wedge: The market grabbed liquidity by taking out stop losses of buyers who entered too early.
Above the wedge (TP Areas):
TP 1 Area (red box): This is the first logical resistance where previous supply sits — many sellers will enter here, providing buy-side liquidity.
Next Target Liquidity (grey box above): This is a major imbalance zone and likely where stop-losses of early short sellers are stacked.
Price is expected to grab liquidity from that area (marked by the red arrow).
✅ Entry & Trade Logic:
Entry Zone: After liquidity was swept at the bottom of the wedge, a bullish engulfing candle formed near demand — signaling institutional interest.
Risk-Reward Setup:
Targeting 0.80% move (approx. 26.48 points).
Trade is based on reversal from demand zone + wedge breakout + liquidity grab confirmation.
🎯 Target Projections:
TP1 Area: Conservative target, just above recent structure.
Final Target: High-probability liquidity zone where market is drawn to clean up resting orders (grey zone).
🧠 Why This Trade Matters (Trading Psychology Insight):
Most retail traders get trapped in emotional entries — entering shorts after a drop or longs too early in a wedge.
Smart money waits for liquidity sweeps before moving price in the desired direction.
This setup shows the importance of patience, structure, and understanding market psychology rather than reacting emotionally to price action.
📌 Key Takeaways:
📉 Trap: Falling wedge builds false bearish confidence.
🧠 Psychology: Stop hunts create fuel for reversal.
📈 Reaction: Smart money absorbs liquidity, moves price toward next inefficiency.
Hashtags:
#XAUUSD #SmartMoney #LiquidityHunt #TradingPsychology #GoldTrade #PriceAction #WedgeBreakout #FXOpen #TechnicalAnalysis #SupplyDemand
XAUUSD – Clear Sideways Movement in a Narrow Price ChannelXAUUSD is moving within a parallel price channel, fluctuating between the 3,320–3,345 zone. Both the EMA 34 and EMA 89 are running flat and close together, indicating a balanced market with no strong momentum in either direction.
Recent highs and lows have formed within a narrow range, reflecting indecision from both buyers and sellers. The latest bounce also stalled at the channel resistance, lacking the strength to break out.
As long as price remains below 3,345 and above 3,320, the sideways trend is likely to continue. During this phase, a range-trading strategy is preferred – selling near the top, buying near the bottom – while waiting for a clear breakout to determine the next directional move.
XAUUSDThe market broke the strong support to now resistance and more bearish momentum expected as the bulls let go of bears to take control.

XAU/USD Gold LONG 1:1 XAU/USD Gold LONG 1:1
Let's try to catch the low of the 4h candle, limit order.
Enjoy!
GOLD Massive Long! BUY!
My dear subscribers,
This is my opinion on the GOLD next move:
The instrument tests an important psychological level 3326.7
Bias - Bullish
Technical Indicators: Supper Trend gives a precise Bullish signal, while Pivot Point HL predicts price changes and potential reversals in the market.
Target - 3337.9
My Stop Loss - 3320.0
About Used Indicators:
On the subsequent day, trading above the pivot point is thought to indicate ongoing bullish sentiment, while trading below the pivot point indicates bearish sentiment.
Disclosure: I am part of Trade Nation's Influencer program and receive a monthly fee for using their TradingView charts in my analysis.
———————————
WISH YOU ALL LUCK
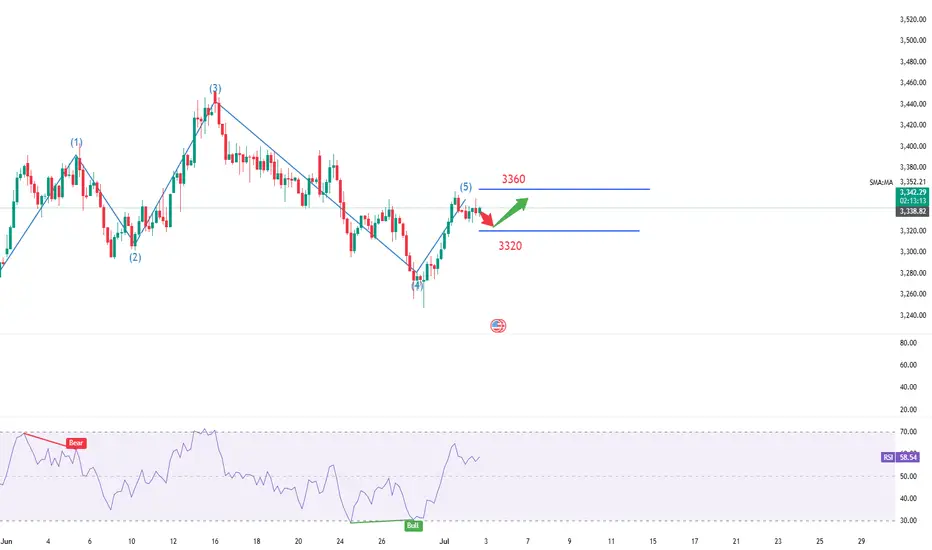
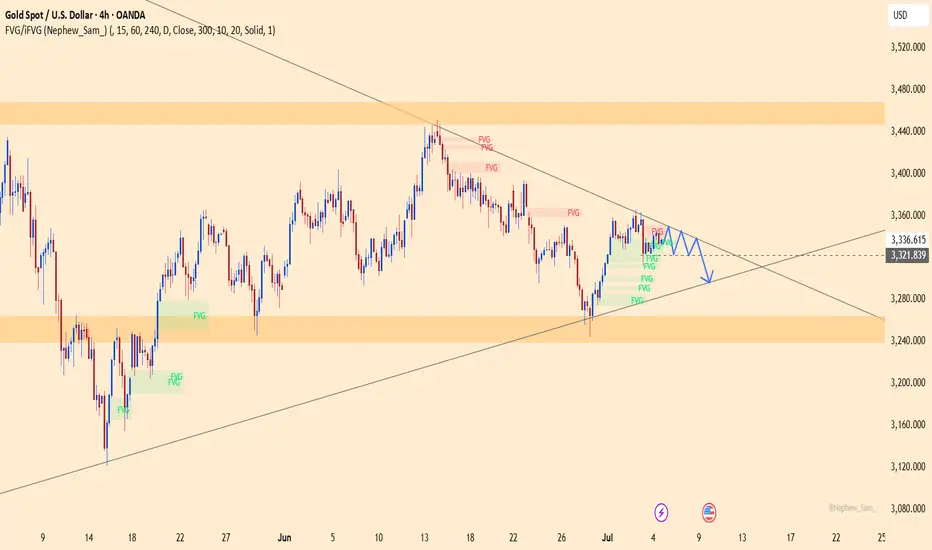
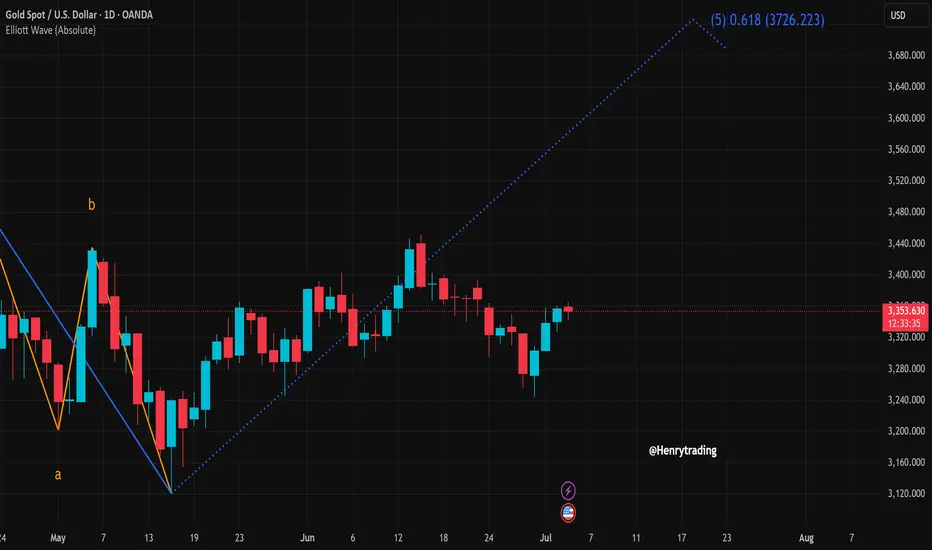
XAUUSD Set for Strong Bullish Wave – Targeting 3,726?Gold (XAUUSD) is showing signs of a bullish recovery after a recent correction between the 3,290–3,340 USD zone. On the daily chart, a clear Elliott Wave formation is unfolding, with the price potentially entering wave 5 aiming for the 0.618 Fibonacci extension at 3,726 USD.
Clear Wave Structure:
The a-b-c corrective wave appears to have completed in mid-May.
The price is now in wave 3 and preparing for a potential extension in wave 5.
Candlestick and Buying Momentum:
Recent candles show strong buying pressure with four consecutive bullish sessions.
The current upward momentum is testing the 3,352 resistance – a breakout could open the path to 3,450 and eventually 3,726 USD.
Support & Resistance Levels:
Immediate support: 3,320 – 3,330 USD
Key resistance: 3,450 USD (recent swing high)
Extended target: 3,726 USD (Fibonacci 0.618 from wave 2 low to wave 3 peak)
Suggested Trading Strategy:
Favor buy on dip strategy, waiting for a minor pullback to the 3,330–3,340 area before entering long.
Set stop-loss below 3,300, with targets at 3,450 and 3,726 USD respectively.
Conclusion:
The XAUUSD chart suggests a potential strong bullish wave according to the Elliott Wave framework, with a breakout likely leading to the 3,726 USD zone. Traders should closely monitor price action around the 3,350 level for confirmation of continued upward momentum.
What’s your view on this analysis? Drop a comment and let’s discuss your trading strategy together!
Gold trend analysis and layout before NFP data📰 News information:
1. Initial jobless claims and NFP data
2. The final decision of the Federal Reserve
📈 Technical Analysis:
Due to the Independence Day holiday this week, the NFP data was released ahead of schedule today, while the policy differences within the Federal Reserve have brought uncertainty to the market. Judging from the market trend, the 4H level shows that the gold price tested the upper track yesterday and then turned to high-level fluctuations after coming under pressure. In the short term, the structure still has bullish momentum after completing the accumulation of power. Although there was a correction in the US market yesterday, it stopped falling and rebounded near 3335, further confirming the strength. At present, the upper resistance in the European session is at 3365-3375, and the short-term support is at 3345-3335 below. Intraday trading still requires good SL to withstand market fluctuations. In terms of trading, it is recommended to mainly go long on callbacks
🎯 Trading Points:
SELL 3365-3375
TP 3350-3340-3335
BUY 3335-3330-3325
TP 3350-3360-3375
In addition to investment, life also includes poetry, distant places, and Allen. Facing the market is actually facing yourself, correcting your shortcomings, confronting your mistakes, and strictly disciplining yourself. I hope my analysis can help you🌐.
FXOPEN:XAUUSD PEPPERSTONE:XAUUSD FOREXCOM:XAUUSD FX:XAUUSD OANDA:XAUUSD TVC:GOLD
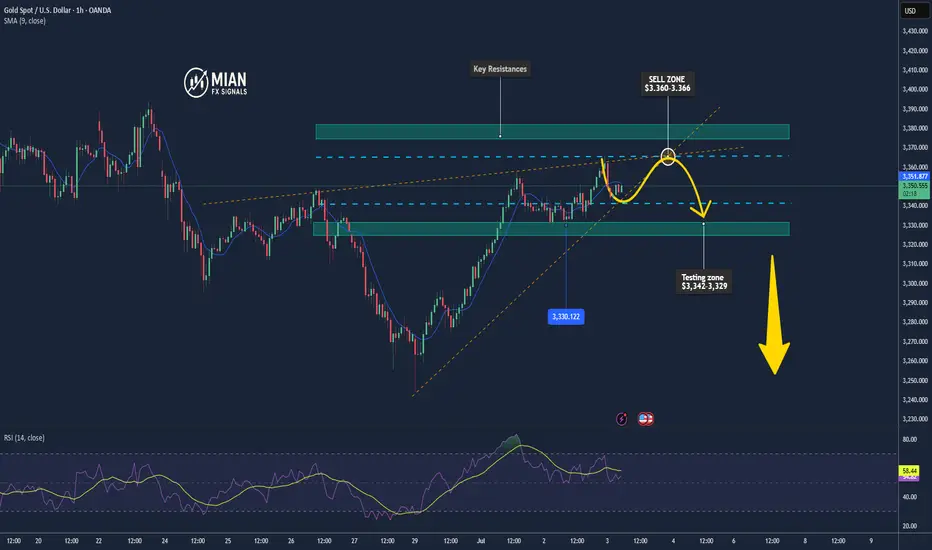
Gold May Pull Back After Day’s High📊 Market Overview:
• Gold is currently trading around $3,350/oz, with the daily high at $3,366/oz.
• The rally stalled as traders took profits near the session high, while a slight rebound in the USD and rising U.S. Treasury yields weighed on gold’s momentum.
📉 Technical Analysis:
• Key Resistance: ~$3,366 (today’s high), with next level at ~$3,375–3,380 if breached.
• Nearest Support: ~$3,342 (intra-day low), stronger support seen at $3,329–3,330.
• EMA 9/21: Price is hovering near the EMA21 (~$3,350); this area is crucial to determine the short-term trend.
• Candle/Momentum Indicators:
o RSI is around 53-55, signaling a neutral stance;
o MACD shows weakening bullish momentum after hitting resistance.
📌 Viewpoint:
Gold may see a minor pullback in the short term, possibly testing the $3,342–3,329 zone after reacting to the daily high. However, if it holds above EMA21 and EMA50, the medium-term bullish trend remains intact.
💡 Suggested Trading Strategy
SELL XAU/USD at: $3,363–3,366
🎯 TP: 40/80/200 pips
❌ SL: $3,370
BUY XAU/USD at: $3,329–3,332
🎯 TP: 40/80/200 pips
❌ SL: $3,325