XAUUSD – Clear Sideways Movement in a Narrow Price ChannelXAUUSD is moving within a parallel price channel, fluctuating between the 3,320–3,345 zone. Both the EMA 34 and EMA 89 are running flat and close together, indicating a balanced market with no strong momentum in either direction.
Recent highs and lows have formed within a narrow range, reflecting indecision from both buyers and sellers. The latest bounce also stalled at the channel resistance, lacking the strength to break out.
As long as price remains below 3,345 and above 3,320, the sideways trend is likely to continue. During this phase, a range-trading strategy is preferred – selling near the top, buying near the bottom – while waiting for a clear breakout to determine the next directional move.
XAUUSD trade ideas
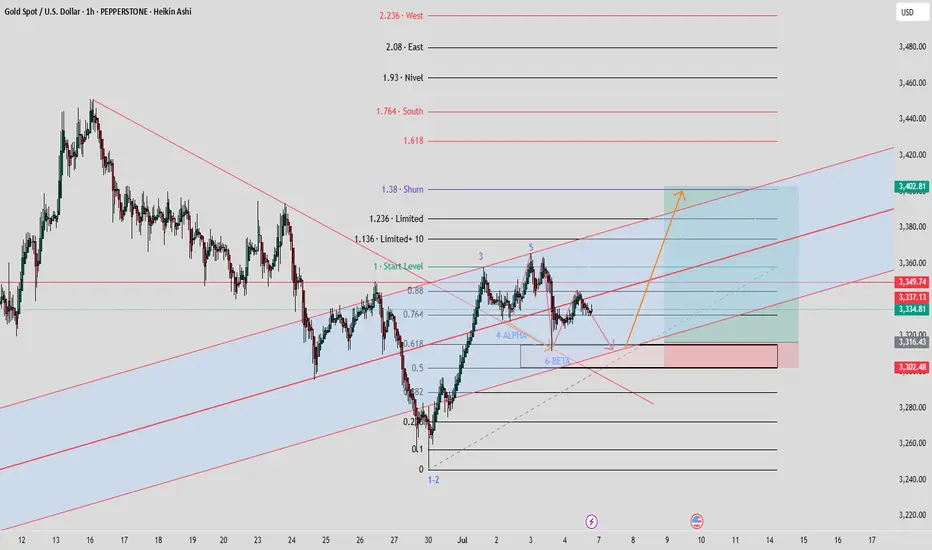
#GOLD_05.07.2025#COMBINED FRACTAL THEORY WITH ALMAZOV + FIBO CHANEL MANDELBROT FRACTAL
GOLD TREND LINE BREAKOUT + FIBO ZONE FOR PULLBACK, THIRD WAVE PENDING
fibo spiral #ALMAZOV
Fibonacci projection with golden numbers, A. A. Almazov's course, closing of the bearish trend cycle, reaching reversal levels, for longs
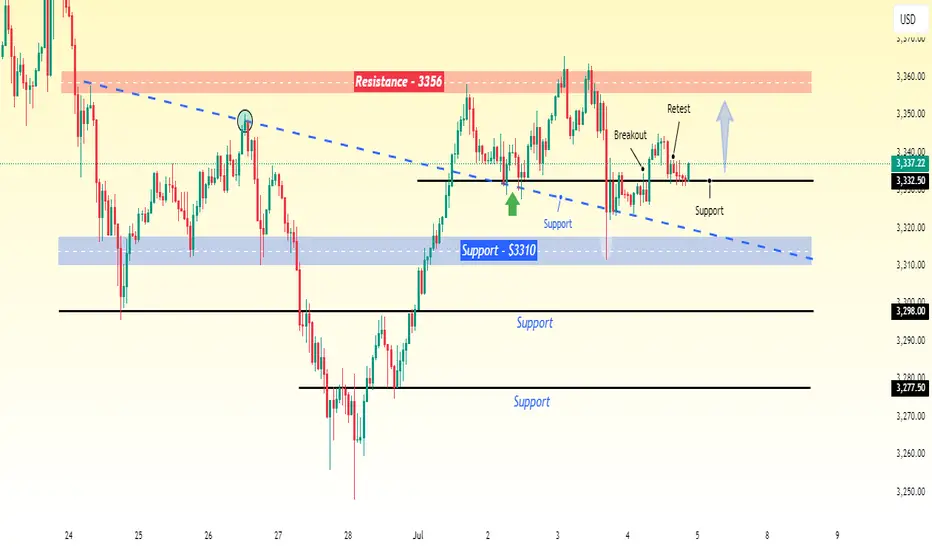
Gold Holding Strong – A Move to $3356 Could Be NextGold is currently trading at $3337, which is an important support level. Earlier, the price dropped to around $3310, but it has since started to recover from that level. This bounce suggests that buyers are stepping in, and the market is showing some strength.
Based on this recovery and the strong support at $3332.50, I expect the price of gold to move higher, possibly reaching around $3356 in the short term.
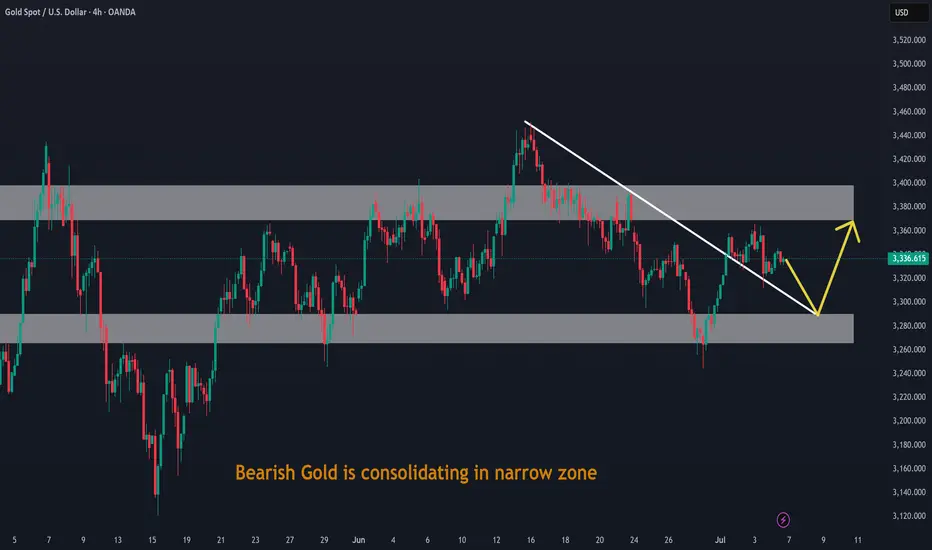
Bearish Gold is consolidating in narrow zoneBearish Gold is consolidating in narrow zone. Also it has broken Down trendline after retracing from demand zone.
I win when I don't postLets see how it goes.
The consolidation that occurred because of the U.S holiday has led to giving buyers more power.
If not, I have a Stop Loss in place. We either win or we lose.
5th wave analysis + Market Structure support zone + Heads & shoulder(4H Timeframe) - we are currently in the right shoulder.
Risk what you can afford to lose
7/4: Trade Within the 3313–3346 RangeGood morning, everyone!
Yesterday’s intraday trades delivered solid profits. Since the U.S. market will be closed today, news-driven volatility is expected to be limited. Therefore, today’s trading focus will primarily revolve around technical setups.
Current structure:
Key support: 3321–3316
Immediate resistance: 3337–3342, followed by 3360
If support holds and resistance breaks, a potential inverse head-and-shoulders pattern may form on the 4H chart, with the next target near 3380
If support breaks, focus shifts to the 3303–3289 support zone
Given the likelihood of range-bound price action today, the suggested intraday range is 3313–3346, with a preference for selling near resistance and buying near support.
If an upside breakout occurs, consider using the MA20 on the 30-minute chart as a guide for pullback entries.
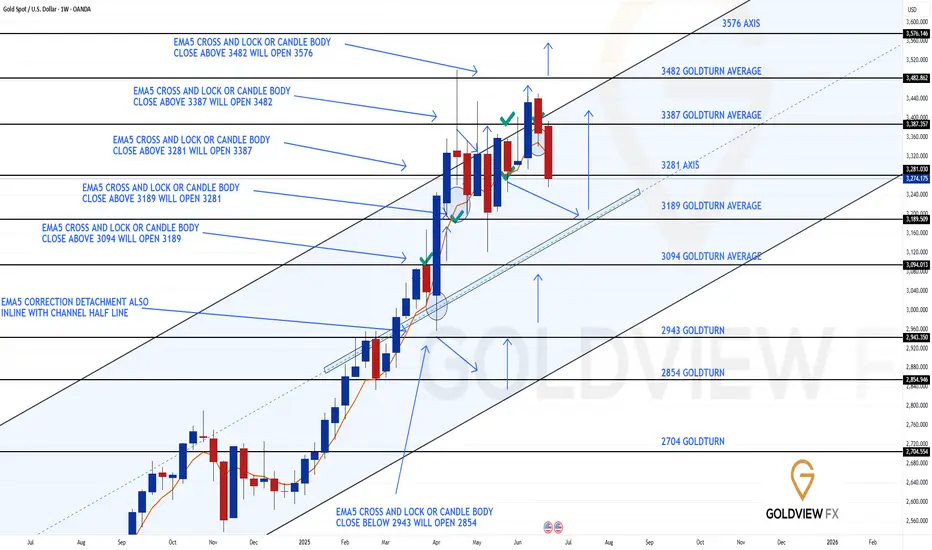
GOLD WEEKLY CHART MID/LONG TERM ROUTE MAPHey Everyone,
Follow up on our Weekly Goldturn channel outlook.
Last week’s action delivered the rejection at the channel top, right in line with expectations. Importantly, we did not get an EMA5 lock confirmation, reinforcing the rejection. We still have the previous weekly candle body close above 3387, leaving the gap at 3482 active and exposed overhead.
The early rejection saw a swift retrace into the 3281 Goldturn axis support, where price is currently attempting to stabilise. This is a pivotal level. From here, we are watching two potential paths unfold:
1. Bounce Scenario: If 3281 holds and buyers step in, we’ll look for a gradual climb within the channel, testing key in between levels. EMA5 cross and lock confirmation will be key for directional bias. A reclaim and continuation higher keeps the 3482 gap firmly in play as a target.
2. Breakdown Scenario: If 3281 gives way, we have a body close gap to the channel mid-line, which becomes the next key level for potential support and Goldturn reaction. A move into this area could offer another structured long opportunity, aligned with the overall bullish framework.
Despite the rejection at the highs, the broader channel structure remains intact, and the longer term outlook still favours a measured move up level by level, using Goldturn levels and EMA5 as our compass.
Key Focus:
Support: 3281 → Channel Half-line (if broken)
Resistance: 3387 → 3482 (gap target)
We remain patient and continue reacting to clean structure backed opportunities.
Mr Gold
GoldViewFX
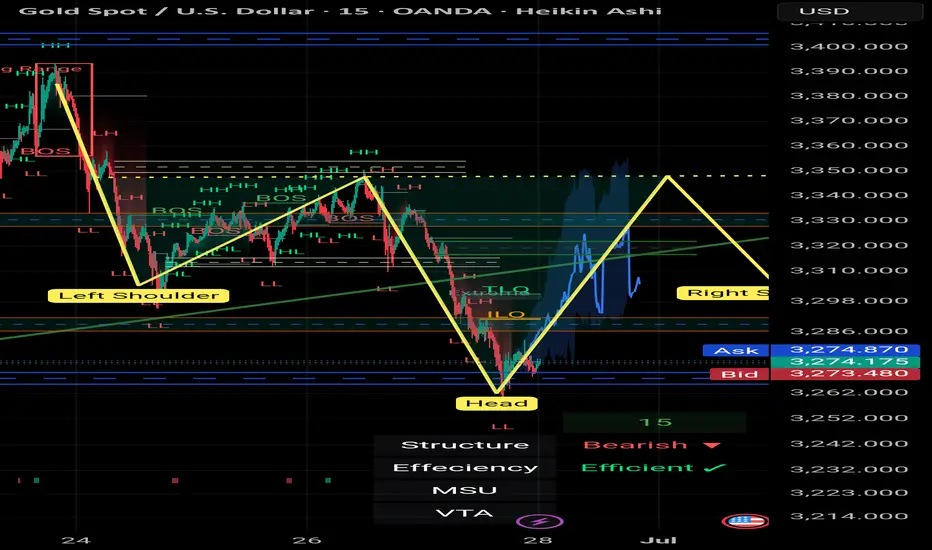
Reverse Head & Shoulders Setup | Gold Spot | 15min | by Mohsen M
🔸 **Chart:** Gold Spot / USD (XAU/USD)
🔸 **Timeframe:** 15min
🔸 **Method:** Smart Money Concepts (SMC) + Pattern Recognition
🔸 **Focus:** Reverse H&S, Order Blocks, TLQ, BOS
---
## 🔍 Market Context:
- **Market Structure:** Bearish on higher TF
- **Short-Term Trend:** MSU (Market Structure Up)
- **Efficiency:** ✅ Confirmed — clean price delivery
- **Key Pattern:** Bullish **Inverse Head & Shoulders**
---
## 🧠 Technical Breakdown:
1. **Left Shoulder – Head – Right Shoulder** perfectly forming within a high-value demand zone
2. Price reacted strongly from **Order Block (OB)** + TLQ marked at the bottom wick (Head zone)
3. BOS confirms bullish attempt to shift structure
4. Anticipating neckline break at ~3345 level for further upside
5. Potential resistance and liquidity resting above 3400 (HH region)
---
## 📌 Trading Plan (Pre-London Open / Monday 1:30 AM UTC+3:30):
- **Entry Idea:**
Watch for bullish confirmation after price stabilizes above Right Shoulder zone (~3300–3320)
Or re-entry on a retest of neckline after breakout
- **Stop Loss:**
Below "Head" and OB zone (~3260)
- **Take Profits:**
- TP1: Neckline break zone (~3345)
- TP2: 3400 – Liquidity pool
- TP3: Final HH sweep (~3420+)
---
## ⚠️ Alternate Bearish Case:
> If price breaks below the "Head" zone and OB fails to hold,
> → Expect bearish continuation to the next liquidity zone near **VTA @ 3200**
---
## ✅ Summary:
This is a clean **bullish reversal setup** using SMC logic and a classic H&S pattern:
**OB + TLQ + BOS + Efficient Market + Clear Pattern ➝ High-Probability Setup**
Structure: 🟥 Bearish (macro)
Trend: 🔼 MSU (micro)
Efficiency: ✅ Efficient
Pattern: 🟩 Inverse Head & Shoulders
---
📊 Prepared by: **Mohsen Mozafari Nejad**
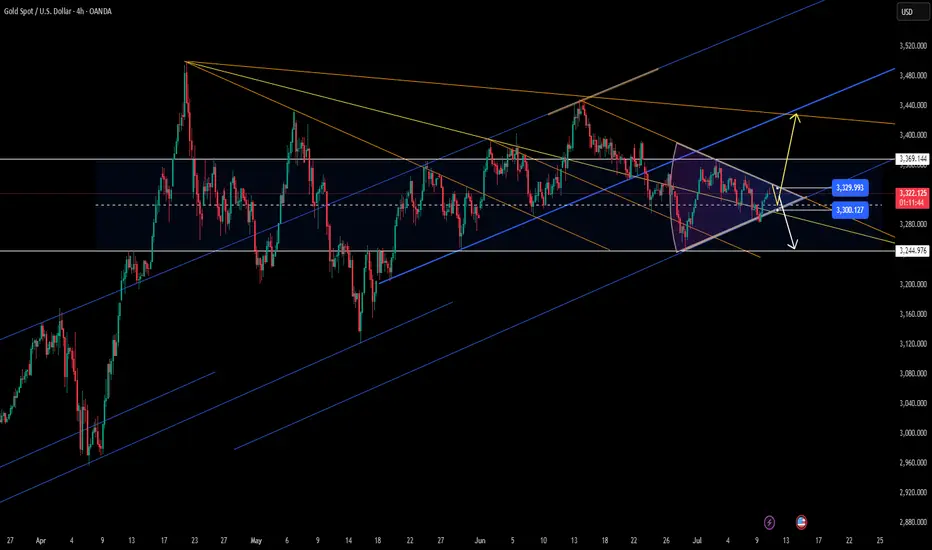
GOLD 4H CHART ROUTE MAP UPDATE & TRADING PLAN FOR THE WEEKHey Everyone,
Please see our updated 4h chart levels and targets for the coming week.
We are seeing price play between two weighted levels with a gap above at 3301 and a gap below at 3242. We will need to see ema5 cross and lock on either weighted level to determine the next range.
We will see levels tested side by side until one of the weighted levels break and lock to confirm direction for the next range.
We will keep the above in mind when taking buys from dips. Our updated levels and weighted levels will allow us to track the movement down and then catch bounces up.
We will continue to buy dips using our support levels taking 20 to 40 pips. As stated before each of our level structures give 20 to 40 pip bounces, which is enough for a nice entry and exit. If you back test the levels we shared every week for the past 24 months, you can see how effectively they were used to trade with or against short/mid term swings and trends.
The swing range give bigger bounces then our weighted levels that's the difference between weighted levels and swing ranges.
BULLISH TARGET
3301
EMA5 CROSS AND LOCK ABOVE 3301 WILL OPEN THE FOLLOWING BULLISH TARGETS
3370
EMA5 CROSS AND LOCK ABOVE 3370 WILL OPEN THE FOLLOWING BULLISH TARGET
3429
EMA5 CROSS AND LOCK ABOVE 3429 WILL OPEN THE FOLLOWING BULLISH TARGET
3499
BEARISH TARGETS
3242
EMA5 CROSS AND LOCK BELOW 3242 WILL OPEN THE FOLLOWING BEARISH TARGET
3171
EMA5 CROSS AND LOCK BELOW 3171 WILL OPEN THE SWING RANGE
3089
3171
EMA5 CROSS AND LOCK BELOW 3171 WILL OPEN THE SECONDARY SWING RANGE
3089
3001
As always, we will keep you all updated with regular updates throughout the week and how we manage the active ideas and setups. Thank you all for your likes, comments and follows, we really appreciate it!
Mr Gold
GoldViewFX

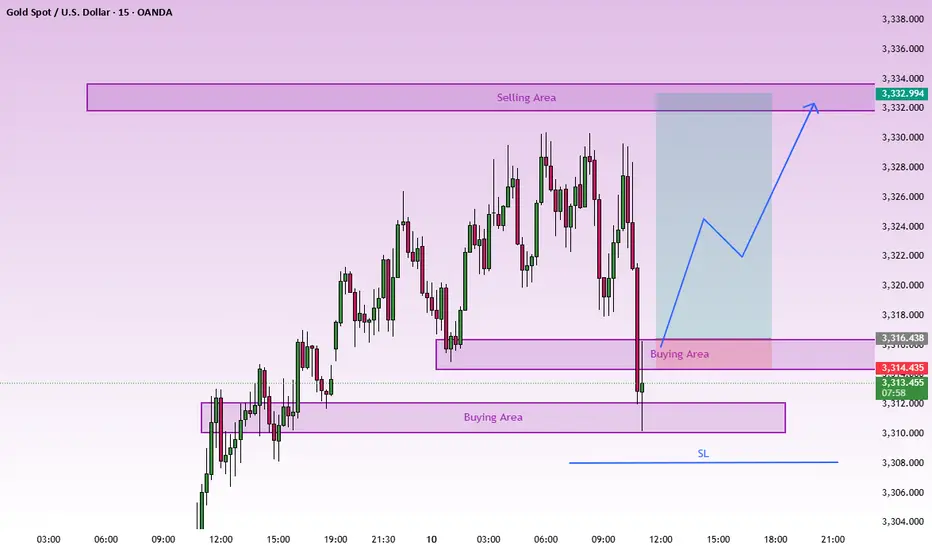
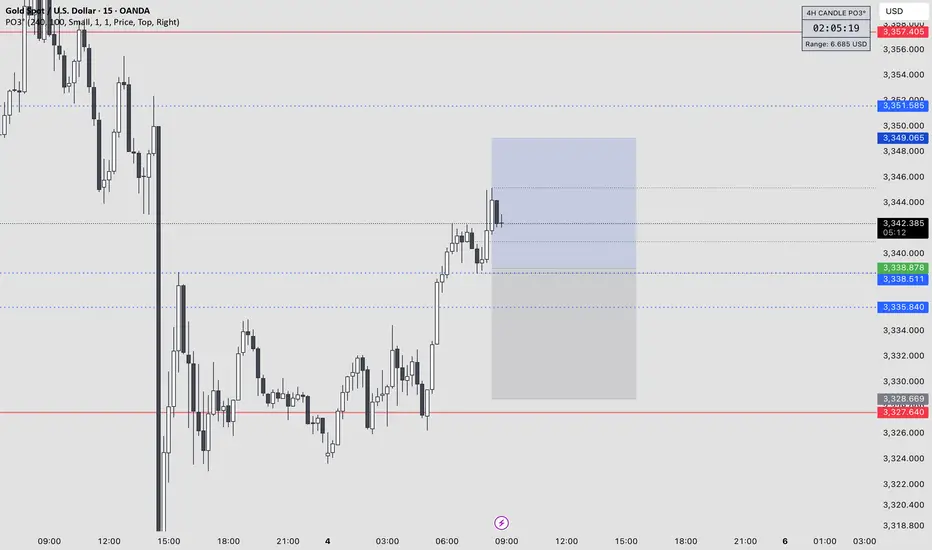
This appears to be a bullish setup, Instrument: XAU/USD (Gold Spot)
Timeframe: 15-minute (top left corner)
Price: ~3,320.617 at the time of the screenshot
Chart Type: Candlestick chart
Annotations on the Chart:
Buying Area (Demand Zone):
Marked in light purple/pink at the bottom.
Price range: approximately 3,317.041 to 3,314.038
The chart suggests a potential bullish reversal from this zone.
Selling Area (Supply Zone):
Marked in the same color at the top.
Price range: approximately 3,332.000 to 3,334.000
Potential target area for the price to reverse or consolidate.
Forecasted Price Action:
A blue zig-zag arrow indicates an expected upward move:
Starting from the Buying Area, suggesting a long/buy entry.
Projected to rise towards the Selling Area, where a reversal or profit-taking might occur.
Other Notes:
The trading chart includes various indicators and drawing tools on the left side.
The chart is part of a technical analysis approach, likely using supply and demand zones.
Bottom right timestamp: Fri 11 Jul 25 (probably a future date setting for backtesting or forward projection).
This appears to be a bullish setup, expecting price to bounce from the lower demand zone toward the upper supply zone.
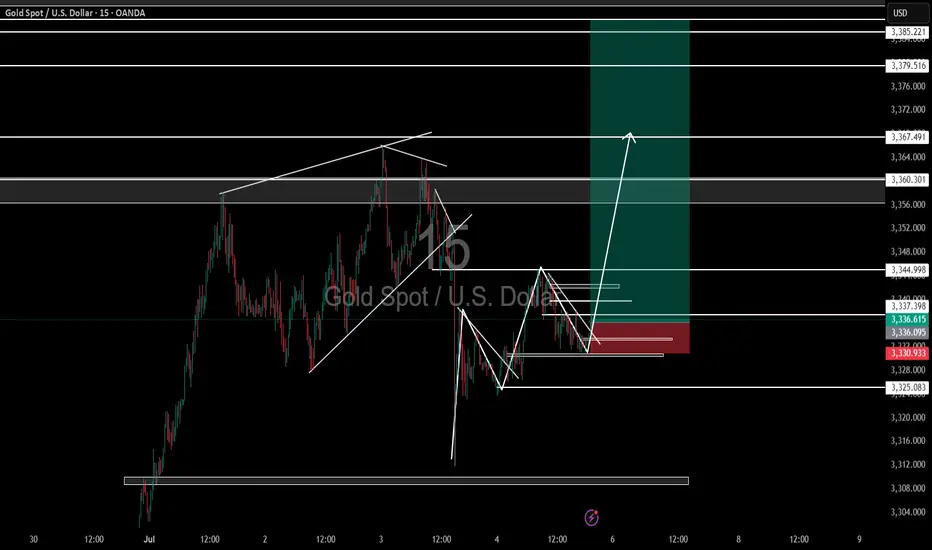
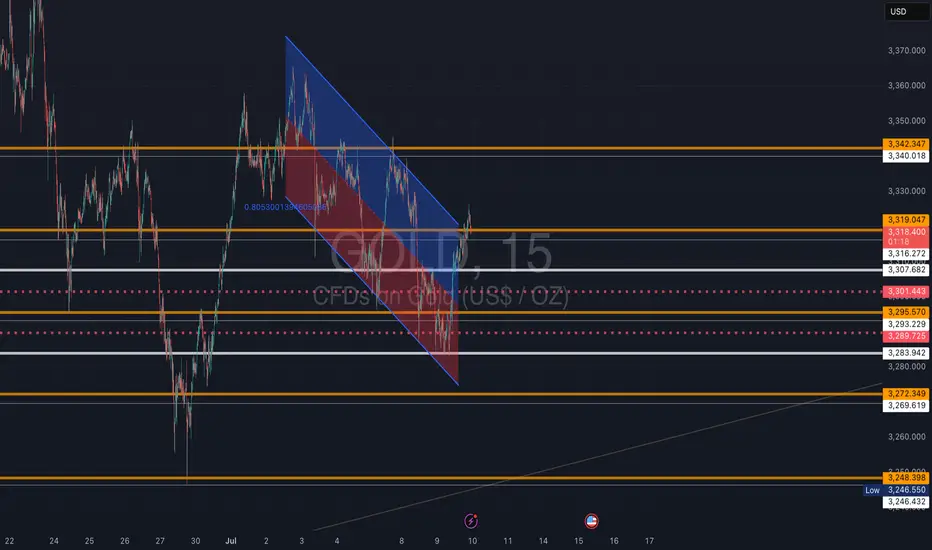
Gold (XAUUSD) Trade Setup – Valid Until July 10, 2025This 15-minute chart shows a clean technical breakout from a falling channel. Here's how to interpret and potentially trade this move:
🧠 Context: What Just Happened
Price was locked inside a descending channel (blue) for multiple sessions.
A breakout occurred above the channel, indicating a potential short-term bullish reversal.
The bounce aligns with recent tariff-related headlines easing off and short-covering momentum building.
I trade these support and resistance lines daily on micro gold futures.
What these lines represent:
Golden Line: Heavy Support or Resistance depending on the price direction towards the lines for major reversal or $10-$15 swings.
Silver Lines: Consolidation areas or mid way support and resistance for a scalping few touches.
Bronze dotted lines: Low volume days support and resistance for a quick $5 up or down.
Also, I can see a directional setup. Here is a hypothetical scenario that could play out:
📌 Key Zones to Watch
🔼 Resistance $3,342 Next major target / sell zone
🟧 Resistance $3,319 Current breakout level retest
⚪ Support $3,307–$3,316 Minor consolidation area
🔻 Support $3,295–$3,289 Strong demand / invalidation
🚨 Bear Pivot $3,272 Break below = bearish return
🧭 Trading Playbook
Bullish Bias (Preferred Scenario)
✅ Break and hold above $3,319 = potential move to $3,342
🎯 Target: $3,340–$3,342
🔒 SL below: $3,307
Optional re-entry on retest of $3,316 zone
Bearish Reversal (If Bulls Fail)
⚠️ If price fails $3,319 and breaks back below $3,307, sellers may reclaim control
📉 Look for short setups toward $3,295 and even $3,272
SL above: $3,319
📌 Key Tip
Watch for volume confirmation and 5m candle closes at each level. Don’t chase — let price come to your levels.
⏳ Validity
This setup remains valid through July 10, or until $3,342 target is hit or $3,272 is broken.
This is not financial advice; it's for educational purposes only.
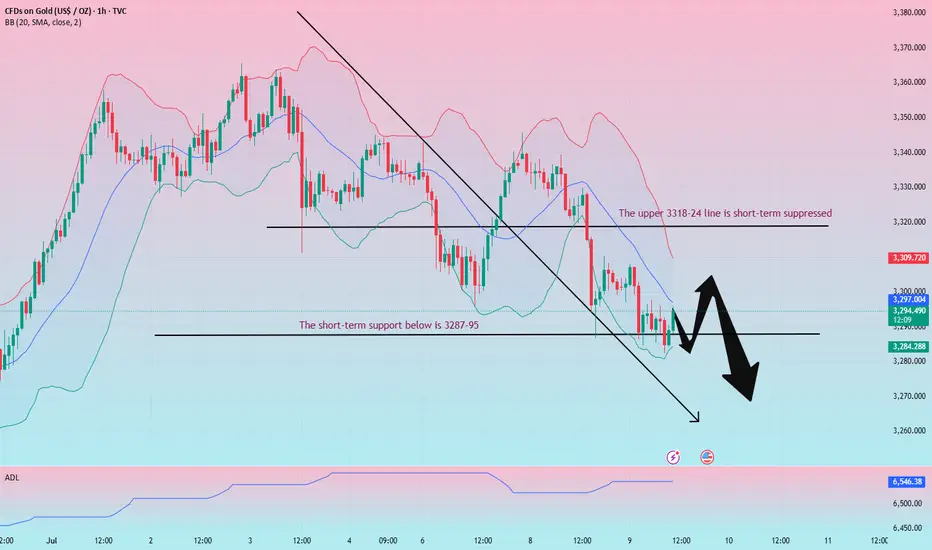
Don’t chase shorts when gold is at a low level, wait for a rebou
From the 4-hour analysis, today's upper short-term resistance focuses on the hourly top and bottom conversion position near 3318-24. The intraday rebound relies on this position to go short once and look down. The lower short-term support focuses on the vicinity of 3280. The overall support relies on the 3280-3325 area to maintain the main tone of high-altitude low-multiple cycles. In the middle position, watch more and move less, and follow orders cautiously, and wait patiently for key points to enter the market.
Gold operation strategy:
Gold 3285-3287 line long, stop loss 3277, target 3315-23 line, break and continue to hold
Xausd techinical analysis.Xausd techinical analysis next move posibale at h1 time frame.not finchinal advice.

Gold Trapping both Buyers and Seller
Gold Trapping Both buyer and sellers . As i mentioned yesterday this is the sign of early consolidation on daily Time frame. Not perfectly rejecting & respecting both Bullish and Bearish Arrays. Stay out of gold till either side of clear price action. Above bearish Rejection or Below Bullish Rejection is the perfect area to ride on trade.

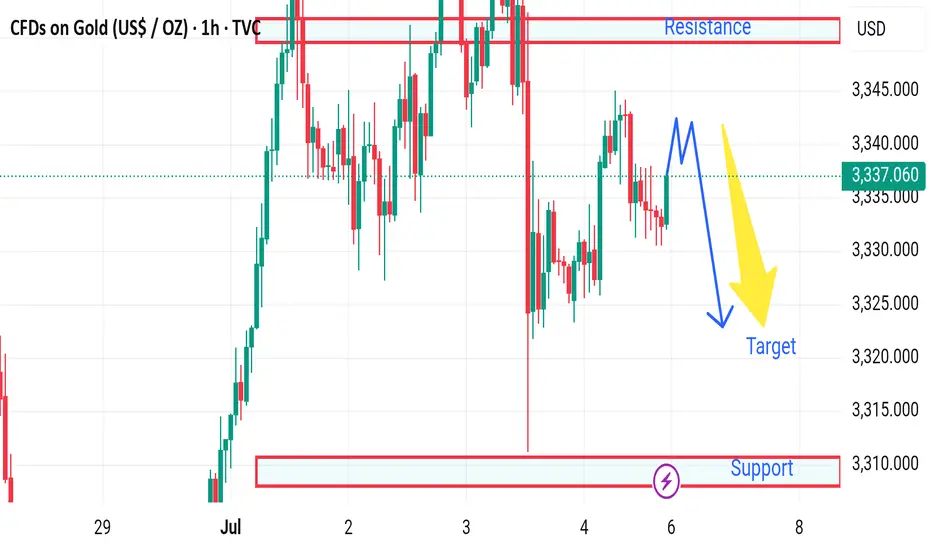
Gold Trading Strategy | July 7-8✅ Key Resistance Zone: $3340–$3345
🔴 Daily Resistance: $3345 is the neckline of a typical “M-top” pattern. On July 7, gold prices surged to $3342 before quickly retreating, indicating strong selling pressure at this level. A valid breakout has not yet occurred.
🔴 4H Chart Resistance Band: The $3338–$3340 zone overlaps with both the 20-day and 60-day moving averages, forming a confluence with the daily resistance. This creates a key short-term ceiling, and unless it's broken, further upside will likely be capped.
✅ Key Support Zone: $3300–$3310
🟢 Weekly Pivot Zone: $3311 is a medium-term pivot level. A daily or weekly close below this level could confirm the start of a broader downward trend.
🟢 Psychological Support: $3300 is a major round-number support and also represents the average cost basis for many short-term long positions. On July 7, the price rebounded after touching a low of $3306, showing that buyers are still active around this level.
🟢 Major Support Band: The $3290–$3295 zone includes the 60-day moving average and previous horizontal support. A breakdown here could trigger technical selling, opening the path toward $3280–$3260.
✅ Trading Strategy
🔰 Break above $3345: Go long, target $3365–$3370, stop loss at $3330.
🔰 Break below $3295: Go short, target $3280–$3260, stop loss at $3310.
🔰 If price stays in $3300–$3340 range: Focus on selling at highs and buying at lows. Favor short-side setups unless resistance is broken. Stop loss at $3350.
✅ Gold remains within a $3300–$3340 trading range, with a short-term technical consolidation pattern. A breakout could be triggered by upcoming policy headlines or geopolitical events (e.g., trade negotiations).
✅ Suggested approach: Use a “light position + key-level stop-loss” strategy. Watch for a breakout above $3345 or a breakdown below $3295 to shift from range trading to trend-following.
✅ Bias remains bearish unless the $3345 resistance is convincingly broken. Until then, rebounds are likely to be short-lived technical corrections—prefer to sell into strength.
GOLD: Strong Bullish Sentiment! Long!
My dear friends,
Today we will analyse GOLD together☺️
The price is near a wide key level
and the pair is approaching a significant decision level of 3,317.31 Therefore, a strong bullish reaction here could determine the next move up.We will watch for a confirmation candle, and then target the next key level of 3,309.44.Recommend Stop-loss is beyond the current level.
❤️Sending you lots of Love and Hugs❤️

Gold’s Last Push🧠 MACRO OUTLOOK FOR GOLD
1. 📉 Central Bank Rate Sentiment (Macro Risk Bias: Neutral to Bullish Gold)
Central Bank Meeting Probable Move Cut Probability Hold Probability
Fed Jul 30 Hold 4.7% 95.3% ✅
RBA Jul 8 Cut 94% ❗
BoE Aug 7 Cut 80.8% ❗
ECB Jul 24 Hold 9.3% 90.7% ✅
BoC Jul 30 Hold 26.5% 73.5% ✅
RBNZ Jul 9 Hold 16.9% 83.1% ✅
✅ Most majors (Fed, ECB, BoC, RBNZ) are expected to hold — gold-friendly
❗RBA and BoE rate cuts ahead — mildly bullish for gold
2. 💸 FED CUT PROJECTION (Through End of 2025)
Jul: 93.3% chance to HOLD
Sep: 73.1% chance of CUT
Oct: 55.9% chance of CUT
Dec: 69.9% chance of CUT
🟡 Progressive rate cuts expected by year-end, favoring a longer-term bullish trend on gold
⚙️ VOLATILITY & IMPLIED RANGE (XAUUSD)
Implied Volatility: 14.09%
Range Estimate Value
1SD High 3355.38
2SD High 3385.78
3SD High 3414.87 🔺
1SD Low 3267.56
2SD Low 3237.73
3SD Low 3209.36
✳️ Key Resistance: 3385–3415
🛑 Key Support: 3237–3209
Current price at 3336.6 sits mid-range, slightly bullish
📰 FUNDAMENTAL NEWS REACTION (NFP & GOLD)
Date NFP Actual vs Forecast Gold Reaction
Jul 3 144k vs 126k forecast (Hot) 🔥 -200 ticks
Jun 6 139k vs 126k (Hot) 🔥 +36, -104 ticks
May 2 177k vs 138k (Hot) 🔥 -105 ticks
🔴 Gold reacted bearishly to strong NFP — Jobs > Forecast = USD strength → Gold weakness
🔍 MARKET FLOWS (MOC)
Index Buy Sell Net
NASDAQ 345M -86M +258M ✅
MAG7 113M -41M +72M ✅
S&P 500 1055M -1041M +13M
DOW 30 106M -168M -62M ❌
🟢 Risk-on sentiment visible from large NASDAQ & MAG7 inflows
🟡 Caution on S&P
🔴 DOW weak
This supports a mild bearish pressure on gold short-term due to risk appetite.
✅ CONCLUSION (For Gold Traders)
🔻Short-Term Outlook (This Week):
Bearish bias due to recent strong NFPs + net equity inflows
Rate cuts are delayed (Fed holding in July)
Expect gold to retest 1SD/2SD lows around 3267–3237 if USD strength persists
🔺Mid-Term Outlook (Q3-Q4 2025):
Dovish tilt from major banks (RBA, BoE, Fed by Sep-Dec) supports long-term gold upside
Key upside potential into 3385–3415 area if dollar weakens and yields drop

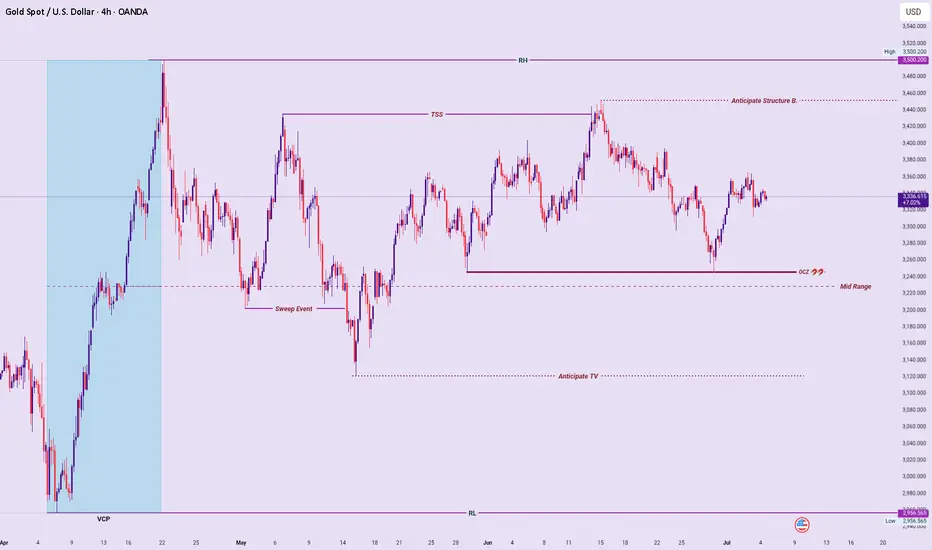
XAUUSD: New-Week Technical Bias (Market Open)Multi-Timeframe Structural Outlook:
Higher Timeframes (Monthly, Weekly, Daily):
Broad structure remains bullish within an Ascend Sequence, though notable Monthly Price Cap Rejections indicate overhead resistance slowing momentum.
Daily & 4H Technical Picture:
Value Compression Phase (VCP):
Price compresses within 3500 – 2956, with consolidation occurring above mid-range, favoring upside continuation probability.
4H Internal Structure:
Aligns with daily compression, showing structural respect of higher lows, maintaining bullish pressure. Above mid-range VCP compression typically signals a breakout potential above 3500.
Liquidity Mechanics & Risk Zones:
Upside:
Early-week bullish lean remains valid, targeting a break and sustained acceptance above 3500, confirming continuation of the Ascend Sequence.
Downside Invalidations:
A decisive breakdown below Order Clustering Zones (OCZ) and anticipated Trap Vectors (TV), leading price into/below the VCP range low (2956), would signal bearish vulnerability and invalidate bullish continuation.
Summary:
Early-week bullish bias preferred while price holds above mid-range compression. Breakdown below OCZ & VCP range low triggers trend deterioration signals.
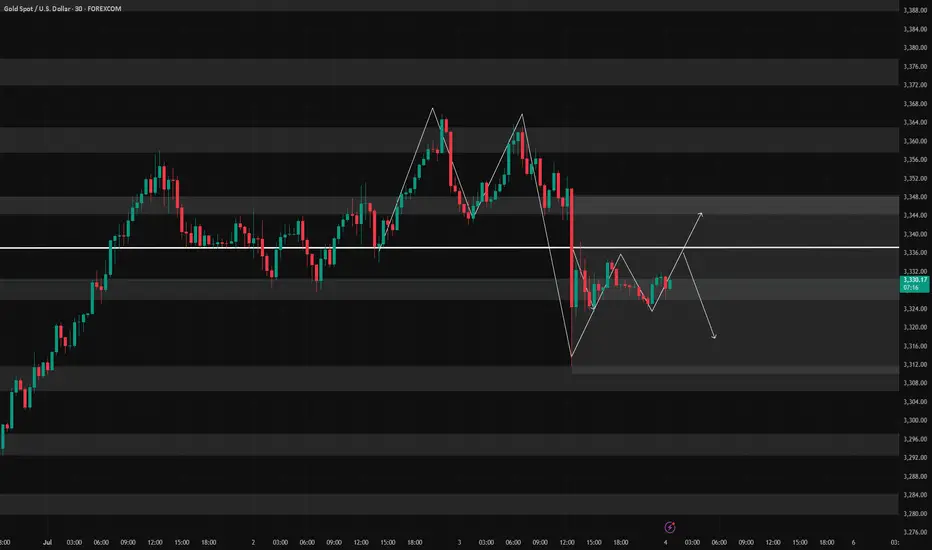
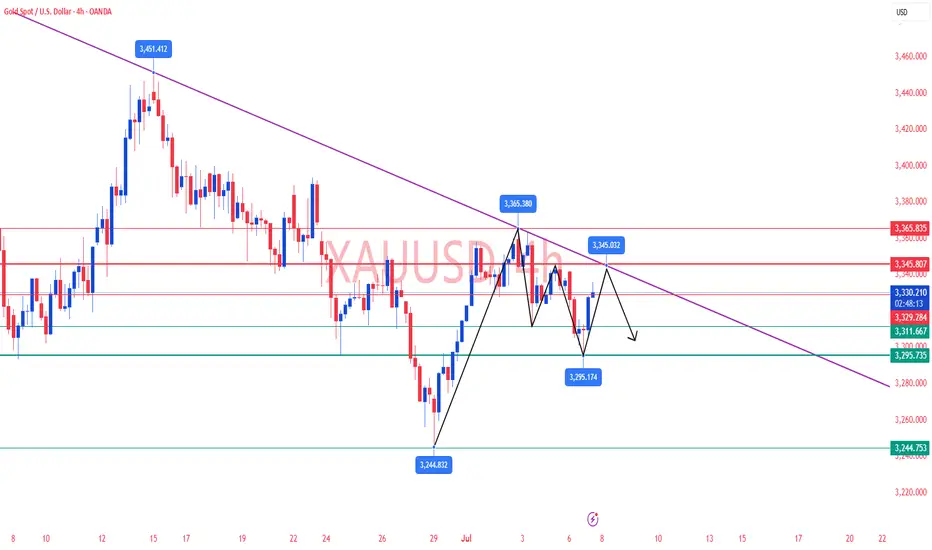
Market next target 🔄 Disruption Analysis:
📌 Current Scenario:
Price is trading around 3,336.400, just below the identified resistance zone (~3,340-3,343).
A range-bound structure is visible with repeated rejections at resistance and support.
---
🚨 Disruption View:
❌ Invalidating Bearish Bias:
The chart assumes a bearish move toward the 3,320 target, but there are early signs of strength near the mid-range (3,335 area).
Failed breakdowns and higher lows indicate buying pressure below 3,330.
---
🟢 Alternative Disruption Outlook (Bullish Flip):
If price breaks and holds above 3,343 resistance, we may see:
🔼 Upside breakout toward 3,355–3,360 zone.
📈 Continuation of the larger uptrend from July 1st rally.
---
🔁 Key Disruption Levels:
Support: 3,328–3,330 (interim zone to watch before full drop)
Resistance: 3,343–3,345 (bullish breakout point)
Invalidation of Bearish Bias: Closing above 3,345 on strong volume.
XAU/USD Gold LONG 1:1 XAU/USD Gold LONG 1:1
Let's try to catch the low of the 4h candle, limit order.
Enjoy!
Gold continues to short
Life is like a thread. As long as today continues and as long as there is hope for tomorrow, we will always be at the starting point and on the road to running. Don't be afraid of the long road, don't complain about the lack of scenery on the roadside, don't despair at any time, just keep running, the bumps under your feet are the cornerstones of our life, and perhaps the turning point is just around the next corner!
Gold, on the eve of the US market yesterday, the shorts repeatedly touched the lower support of 3282, but ultimately lacked the momentum to make a final push, which led to a reverse reversal in the US market and a continuous rebound effect. As of the morning of the day, the highest reached near 3326, and the daily line also closed at the bald small positive line of the lower lead. The current upper pressure is maintained at the previous 3330 line. This position will also be related to the continuity of the long and short positions in the later period, and the highest in the morning will also be maintained near this position. For the European market, this position is even more important. Once it continues to break through, the US market will likely continue to rise, and it can also be used as the position of the long and short watershed in the short term, and the recent trend continuity is extremely high. , most of them are maintained in the range of shock operation, and the support below will be maintained at 3310, which is also the key defensive point of the European session. Although the daily line is currently closed at a small positive line, it is still obviously insufficient in power, and the multi-hour line is also maintained in the downward channel without a breakthrough. In the short term, it is still in a bearish situation overall. If there is no breakthrough for a long time, it may continue to fall in the later period. If gold rebounds near the morning high, it can continue to short. If the European session breaks through strongly, it needs to adjust its direction before the US session. If gold rebounds near 3325-26, it can be shorted. The target is around 3310-00, and the loss is 3335!
Gold rebounds near 3325-26 during the day, and the target is around 3310-00, and the loss is 3335.

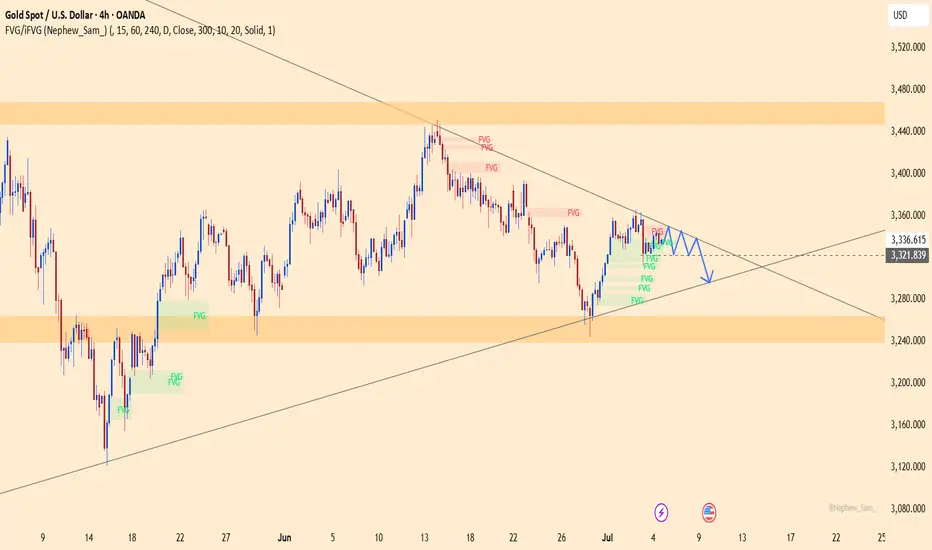
Gold prices converge, 3300-3330 range breaks?Gold prices converge, 3300-3330 range breaks?
The following current events may become catalysts for gold price changes:
Trump announced on social media that August 1 is the deadline for "reciprocal tariffs" and mentioned that he plans to impose a 200% tariff on medicines and a 50% additional tax on copper.
The market quickly digested the expectation of escalating trade conflicts.
The market expects that Trump may threaten to increase tariffs to force other countries to make concessions, but may eventually extend the deadline.
If the breakdown of negotiations triggers risk aversion, gold prices may hit $3,400; if a small agreement is reached, gold prices may fall back to $3,300.
Focus:
July 11 US CPI data: will verify inflation stickiness and affect the direction of real interest rates.
If CPI is lower than 2.8%, it may strengthen expectations of interest rate cuts and boost gold prices; if it is higher than 3.0%, it may suppress gold performance.
Fed policy signal: The minutes of the June FOMC meeting released on July 11 may provide more details about the internal differences in the interest rate decision.
In addition, Powell's recent statement shows that he is cautious about interest rate cuts. If this position continues, gold prices may temporarily fall into a volatile pattern.
Optimistic scenario (probability 30%): The United States and Japan reach a small agreement, and the price of gold falls back to $3,300;
Pessimistic scenario (probability 50%): The breakdown of negotiations triggers risk aversion, and the price of gold hits $3,400;
Extreme scenario (probability 20%): Trump restarts tariffs on China, triggering the price of gold to hit the previous high of $3,450.
Technical analysis:
As shown in the figure: 4-hour cycle
Gold prices converge, range oscillation: 3,300-3,330
This range will determine the direction of the next trend of gold prices.
As the oscillation space becomes narrower and narrower, it is expected that a new round of market will break out today or at the latest this Friday.
The author believes that if the bullish tone of the macro trend remains unchanged, the price of gold may still break upward.
There is a high probability that the high of $3,400 will be hit again this week.
Of course, we must respect all possible scenarios.
Intraday trading strategy:
Long strategy:
Buy: 3310-3315
Stop loss: 3295
Target: 3330-3350-3400
Short strategy:
Sell: 3325-3330
Stop loss: 3335
Target: 3315-3310-3300-3285-3250
The market is currently volatile, but the focus of gold price trading is on trends rather than prices. When emotions strike, the direction of making money is the key.
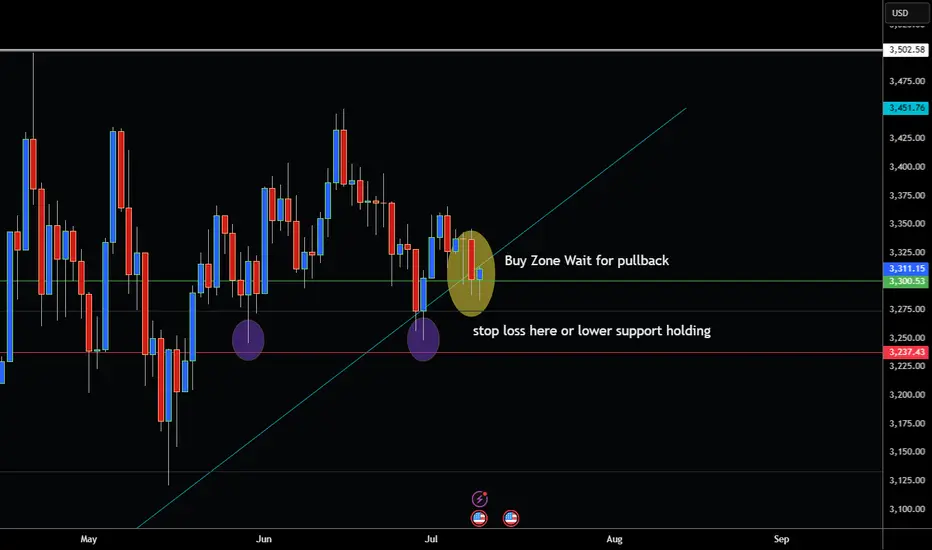
GOLD PULLS BACK TO TREND LINE AND RE-ENTERS BUY ZONE!Hey Traders so looking at Gold right now seems like we are consolidating at 3310 looking for direction. However I think the trend is still up because if you look close at support levels 3240 it has rejected that level twice.
Of course markets can flip on a dime when something unpredictable happens in this tariff driven environment so we still need to be cautious.
Seasonally Gold Rises in the Summer from a historical standpoint. But watch out to see what happens at todays FED meeting.
So if your Bullish this is the place to buy cautiously consider small position on an aggressive entry and put stop below 3230 which looks like it could be good level.
Or if conservative wait until after FED meeting to see how market reacts off this level and they buy again on a pullback if market reacts positive.
However if Bearish I would wait for a daily close and break below 3215 or 3200 before considering selling.
Good Luck & Always use Risk Management!
(Just in we are wrong in our analysis most experts recommend never to risk more than 2% of your account equity on any given trade.)
Hope This Helps Your Trading 😃
Clifford