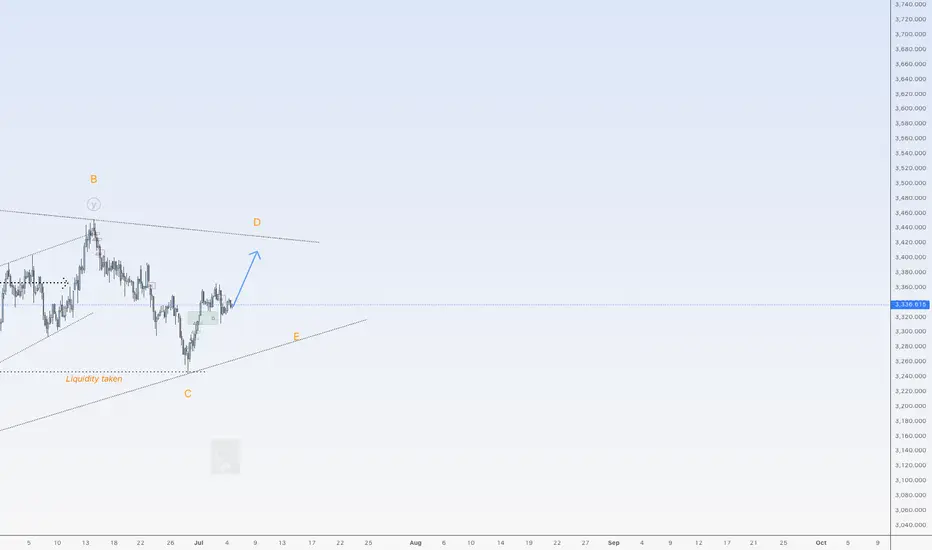
Little more upside for goldHi traders,
Last week gold swept the liquidity and went up again just as I said in my outlook.
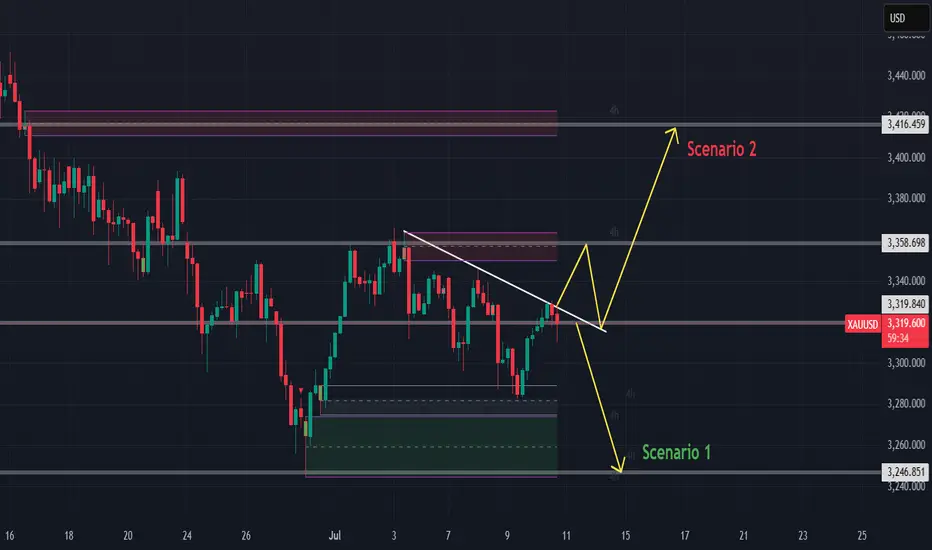
The last wave down could be wave 2 or it's part of a big Triangle (orange C)/ Flat.
Next week we could see this pair go up again to finish (orange) Wave D. After that we could see another move down for Wave E.
Let's see what price does and react.
Trade idea: Wait for the bigger correction to complete.
If you want to learn more about trading FVG's & liquidity sweeps with wave analysis, please make sure to follow me.
This shared post is only my point of view on what could be the next move in this pair based on my technical analysis.
Don't be emotional, just trade your plan!
Eduwave
XAUUSD trade ideas
Monday pozeshan gold As my analysis a good buy is gaining momentum from 3330 big buy area next target 3365-3370if you satisfied with my target you can play

Gold opening market strategy analysis
💡Message Strategy
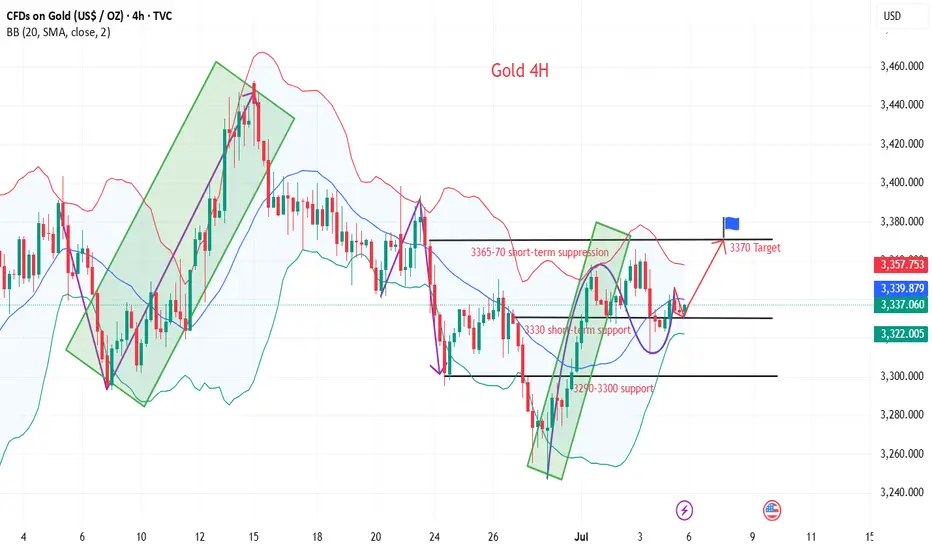
In the case of all negative non-agricultural data, gold did not fall below the support of 3300, which shows that gold bulls are still the main trend. The current daily pattern of gold is three positives, one negative and one positive. The trend of the opening next Monday is also very important. Once it continues to rise and rebound to break through the suppression, the bulls will open the door to regain the 3400 mark.
At present, the short-term pressure is still maintained at 3345-50, which is also the first point for the bulls to break through. Once the breakthrough is successful, the next target will be around 3365-3370.
📊Technical aspects
From the 4-hour analysis, the support at 3330 is concerned, and the support at 3320 is concerned. The short-term resistance at 3345-50 is concerned, and the suppression at 3365-70 is concerned. The overall low-multiple cycle participation is maintained. In the middle position, watch more and do less, and be cautious in chasing orders, and wait patiently for key points to participate. Pay attention to the specific operation strategy in time.
💰Strategy Package
Long Position:3320-3330,SL:3305,Target: 3370
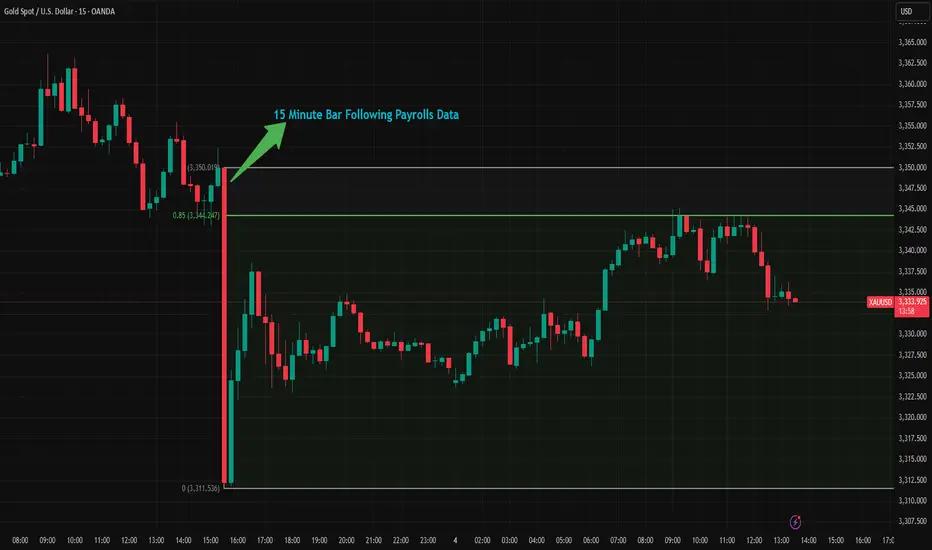
Why is the 147k Beat in Payrolls Data Not as Strong as it Seems?Yesterday’s U.S. nonfarm payrolls report came in above expectations, but a closer look at the details reveals a less encouraging picture. Despite the headline beat, market reactions quickly faded. For instance, gold initially dropped from 3350 to 3311 in the first 15 minutes after the release but has since recovered more than 75% of that decline. So why is the June jobs report not as strong as it first appeared?
According to the BLS report, nonfarm payrolls increased by 147k in June, surpassing the consensus estimate of 106k. However, when breaking down the numbers, private payrolls rose by just 74k, well below expectations. Most of the gains came from government and healthcare hiring. Government jobs accounted for 73k new positions, and 63k of those came from the education sector alone.
Some analysts suggest the high net hiring in education may be due more to a lack of firings, a consequence of a tight labor market in that sector. Meanwhile, the 59k increase in healthcare jobs is part of a long-term trend. Over the past two years, the U.S. has added an average of 70k healthcare jobs per month. This growth is largely driven by the needs of an aging population and reduced payrolls during and after the pandemic that have yet to fully recover.
If you exclude government and healthcare hiring, U.S. payrolls increased by just 15k in June.
The unemployment rate also came in better than expected, falling to 4.1% from 4.2%, while markets had anticipated a rise to 4.3%. However, this decline was driven by a drop in the labor force participation rate, which fell to 62.3% from 62.6% in just two months , a worrying sign that fewer people are actively participating in the labor market.
In the first 15 minutes after the data came, gold fell to 3311 from 3350. In the following 18 hours, gold recaptures 85% of the loss. Gold is still over the broken bearish trendline in 1-H timeframe. With tariff deadline in 9th July and incoming 10-12 tariff letters coming in from Trump in the next few days, gold could have potential to go upwards with market understands this jobs data is not strong as it seems.
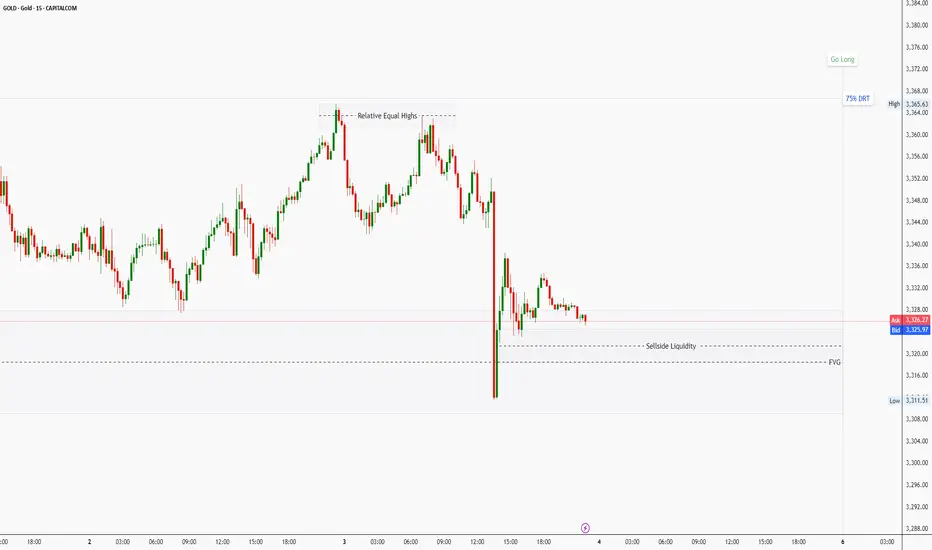
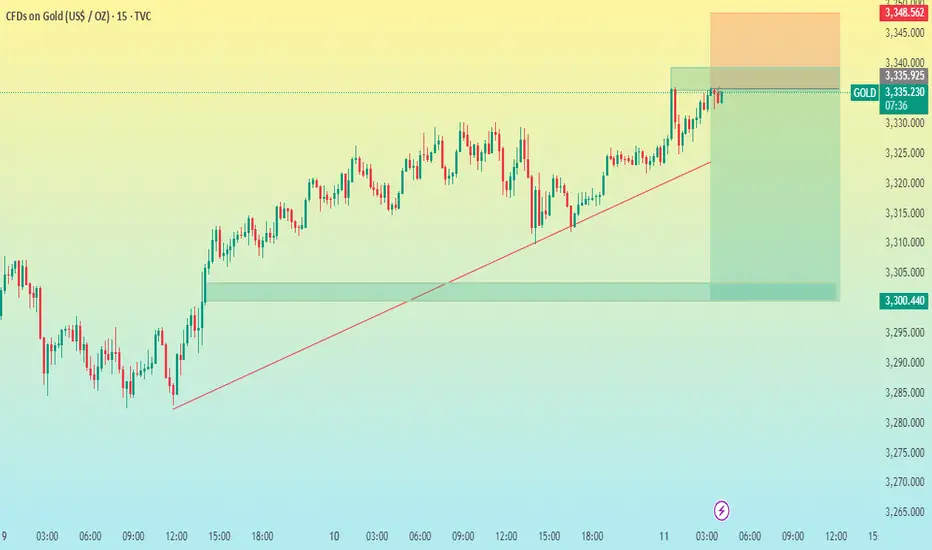
Final Trading Day Outlook for GOLD – Friday Bias and Trade PlanAs we head into the last trading day of the week, here's my outlook for GOLD ( CAPITALCOM:GOLD ):
Bias and Expectation
I was expecting a retracement from the 75% Draw on Liquidity (DRT) level — not just because of the level itself, but also due to its confluence with a Fair Value Gap (FVG) and a Bearish Order Block. And that retracement did occur.
Thursday delivered that deep retracement, courtesy of economic data and news releases. That pullback tapped into a Daily FVG and is now trading above its Consequent Encroachment (CE) at the time of this analysis.
✅ If today’s candle closes above the midpoint of that FVG, it will further confirm my bullish bias.
✅ Even more convincing will be a close above the upper boundary of the FVG, suggesting strength and possible continuation.
Market Structure Across Timeframes
🔸 4H Chart:
Price has raided sell-side liquidity and formed relative equal highs, a sign that the market may seek to attack that zone next — possibly as a liquidity target.
🔸 1H Chart:
The market is currently trading in the premium zone of the FVG, and shows a clear inability to trade lower, further supporting the bullish outlook.
Trade Plan
My trade idea for Friday is as follows:
Wait for a purge (liquidity sweep) on the sell-side, ideally during a Kill Zone (London or NY).
Look for confirmation and confluence based on my model (e.g. displacement, market structure shift).
Enter long positions targeting the next liquidity pool, particularly the equal highs formed on the 4H timeframe.
⚠️ Reminder:
Trade with due diligence. This is not financial advice. Always align entries with your personal model and preferred session.
📌 Final Note
Today may present strong opportunities — but patience, timing, and context are everything. Let the market show its hand, then act.
Thanks for your support!
If you found this idea helpful or insightful, please drop a like 👍 and leave a comment — I’d love to hear your thoughts! 🚀
Follow me for more daily price action insights and trading strategies on XAUUSD and other key markets.
Let’s grow and trade smarter together! 📈
⚠️ Disclaimer
This content is for educational and informational purposes only and does not constitute financial or investment advice.
All trading involves risk. You are solely responsible for your own decisions, so always conduct proper research and due diligence before taking any trades.
Past performance is not indicative of future results. Trade responsibly.
May your final trades of the week be precise and profitable.
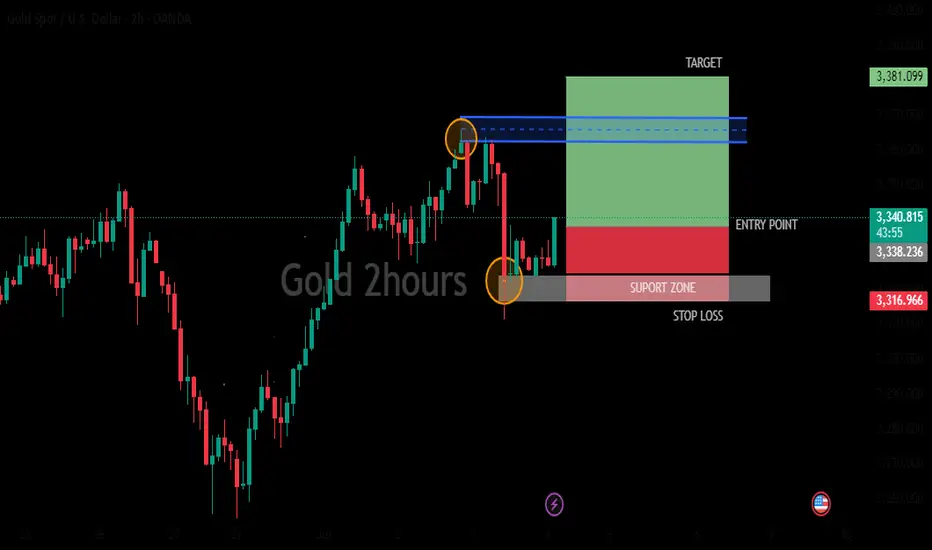
GOLD 2HOURS BULISH ANALYSISMarket may be going buy side and the presence of indicators and other tools suggests that the user is actively monitoring and analyzing the market.target price (green bar) stop loss (red bar) entry point (blue line)
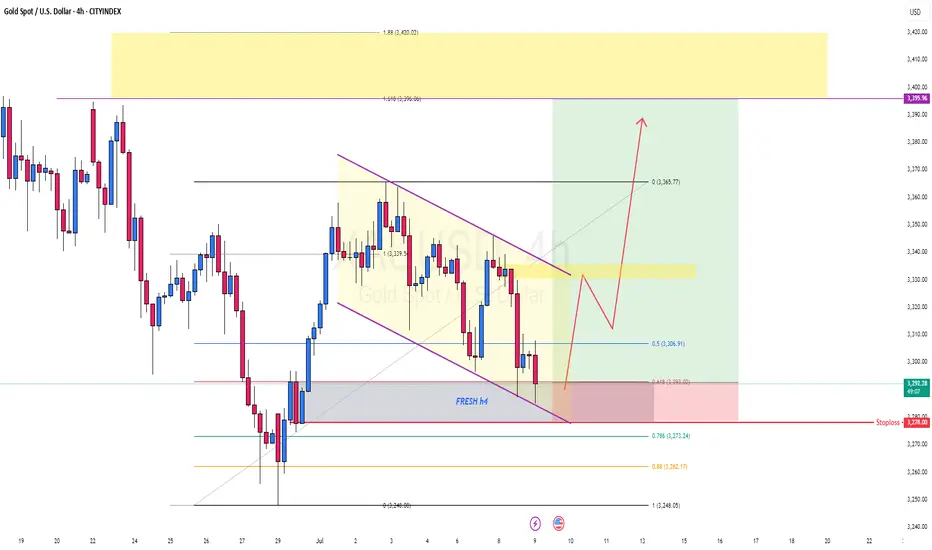
gold long viewbuy gold now regret later.. here my view bullish flag for gold.. Now market react on fresh zone 4h. Careful if breakout below.
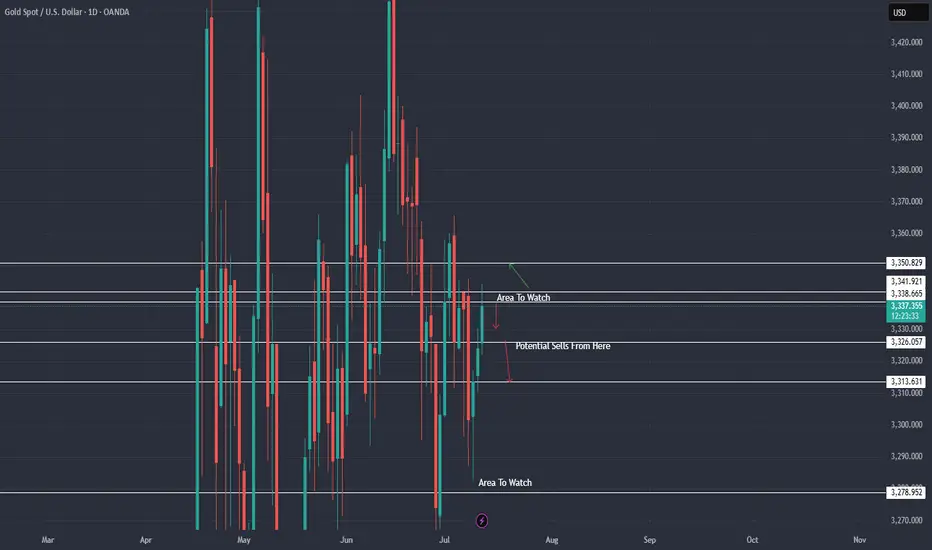
XAU / USD Daily ChartHello traders. Here is a daily chart showing the areas I will be watching to see how gold reacts. Wishing everyone a Happy Friday, we are almost halfway through the month, and we are more than half way through the year. Time is moving fast. Hope some of you are holding crypto as the monetary system is flawed, fake and failing. Big G gets a shout out. Let's see how the current 4 hour candle closes, as well as the 1 hour. I will post a lower time frame chart in a few hours when Pre NY volume starts to come in here in the US, which is just under 3 hours from now. Be well and trade the trend. It's Friday, so trade safely.
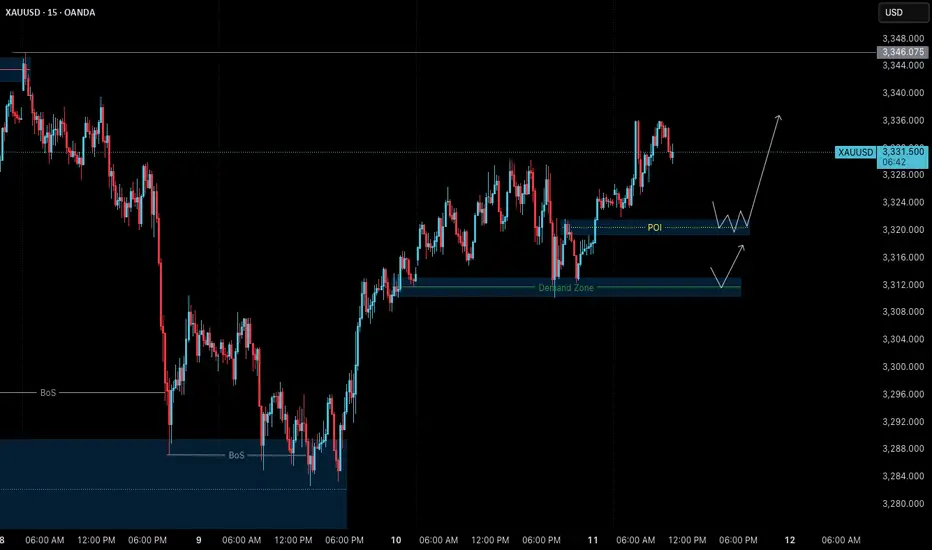
Gold – July 11 | H4 & M15 Aligned, Higher Highs in Sight🟡 Gold – Higher Highs in Sight | July 11 Analysis
As outlined in our July 10 analysis
( Gold – H4 OB Held, BoS Confirmed ),
price retested the 3313–3310.5 POI and continued upward in alignment with the broader bullish structure.
Gold is now trading around 3330–3335 , and both H4 and M15 remain in clear uptrends — forming a consistent sequence of higher highs and higher lows .
This post is intended purely for educational and structural observation —
not as trading advice or encouragement to enter trades.
Please use your own strategy, confirmation methods, and risk assessment before taking any action.
🔄 Structure Alignment
✅ H4: Bullish continuation
✅ M15: Trend aligned, forming HH–HL structure
🟢 Bias: Long-only setups (based on structure)
🔍 Key Supply & POI Zones
📌 3345–3346:
→ Strong supply zone
→ If price breaks above, we expect a new higher high
📍 If retracement occurs before breaking 3346:
→ Watch 3319.5–3321.5 (M15 POI)
→ Valid only if respected with M1 confirmation (ChoCh + BoS)
🎯 Trade Plan (Educational Observation)
🛑 No shorts — structure does not support counter-trading
🕒 Monitor: For price to revisit the 3319.5–3321.5 zone
✅ If respected + M1 confirms → structure favors long
🎯 Target: Move above 3346 , continuing the bullish sequence
🧠 Final Thoughts
Price structure remains in strong alignment — but the key is confirmation, not prediction.
Wait, observe, and only act within your own defined process.
📖 Trade the structure, not the emotion.
When the trend aligns, hesitation costs more than waiting.
📘 Shared by @ChartIsMirror
XAU/USD 15M CHART PATTERNHere's a clear breakdown of your XAUUSD SELL trade setup:
---
🟠 Trade Type: SELL
Entry: 3334
✅ Take Profits:
1. TP1: 3325
2. TP2: 3315
3. TP3: 3300
❌ Stop Loss: 3348
---
🧮 Risk/Reward Summary:
Target Profit (pips) R:R (approx.)
TP1 9 0.64:1
TP2 19 1.36:1
TP3 34 2.43:1
> Stop loss is 14 pips above entry (3348 - 3334).
---
⚠ Quick Notes:
Make sure this aligns with your risk management strategy.
Entry at 3334 is quite close to a round resistance — monitor for reversals.
Use trailing stops if you'd like to lock in profit after TP1 hits.
Would you like a chart
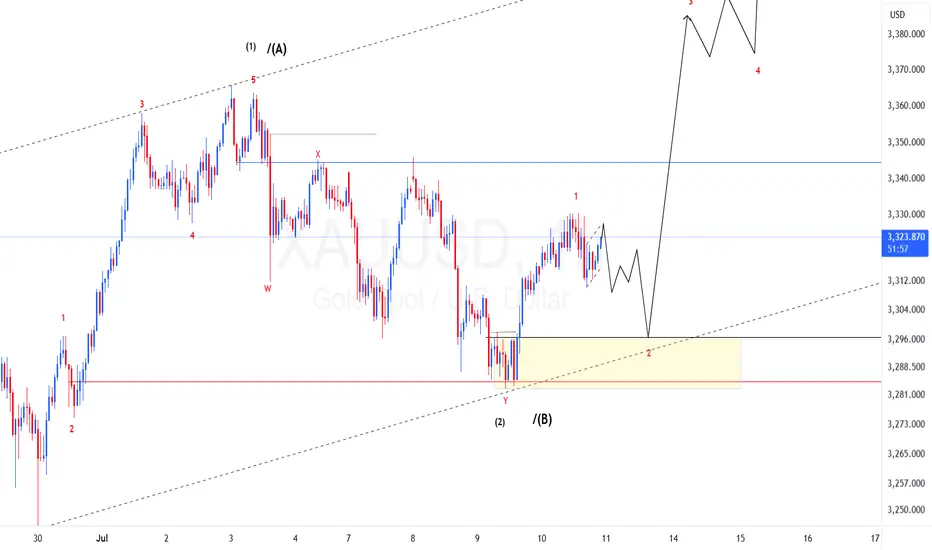
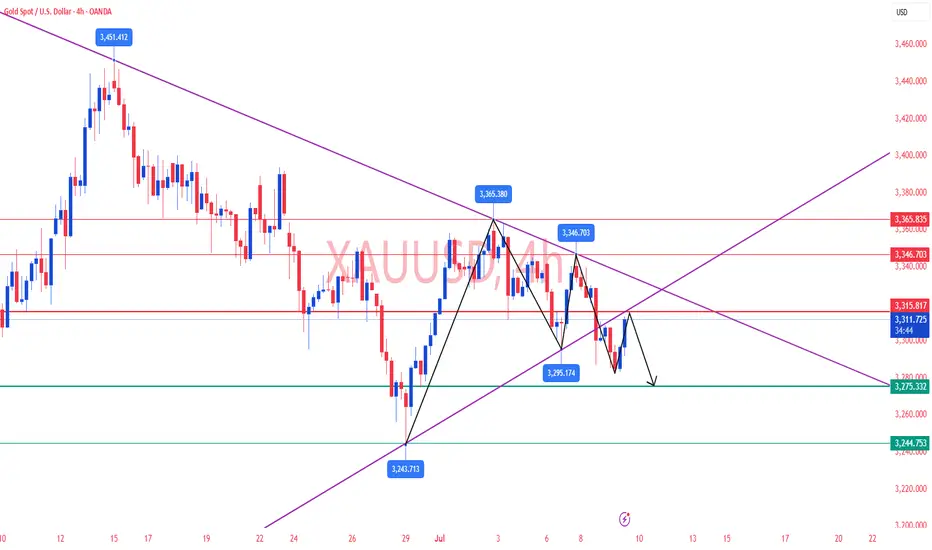
XAUUSD Elliot waves update: What to expect?Bullish bias is still on. Price made impulsive wave 1 of lower degree and now we should expect price to continue up to test the upper trend line. There is also a possibility that the 4th wave is still in play and a possible triangle is about to be finished, however, this does not change our current bias to the upside. I am expecting price to drop to test the extreme order flow before continuing. To take advantage of the bullish move one need to find the entry around this extreme order flow marked with a rectangle. "Trade responsibly, this is not financial advice"
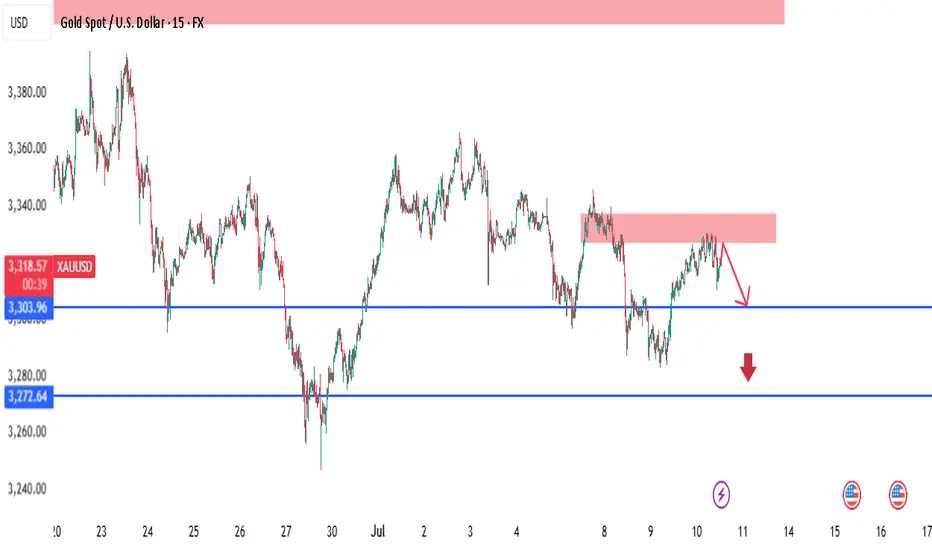
XAUUSD - Intraday SMC Bearish Setup | 15m ChartGold is currently reacting to a visible 15m supply zone after a bullish retracement. Price failed to break above the short-term supply (highlighted in red), showing signs of potential short-term reversal.
🔍 Key SMC Insights:
Supply Zone at 3318.47 – 3320 area is holding firm, with price showing clear rejection and lower highs forming.
Internal CHoCH already confirmed — suggesting short-term bearish order flow is active.
Liquidity Grab and rejection around the supply confirms smart money may be offloading positions.
Imbalance Below near 3303.96, with further inefficiency down to 3272.64.
📍Trade Idea:
Sell Entry: After a retest or failure to break above the 3318.47 zone.
Target 1: 3303.96 (near-term support and minor liquidity)
Target 2: 3272.64 (major liquidity zone + possible demand area)
Invalidation: Bullish break and close above 3320 would shift intraday bias.
⚠️ Monitor lower timeframes (1m–5m) for confirmation before executing trades. This setup aligns with the 4H bearish structure, enhancing confluence.
Perfect prediction, pay attention to the high short entry pointTrump extended the tariff agreement to August 1 and began to collect tariffs again. Although it eased market tensions, his remarks will not be extended after the expiration, and he issued a tariff threat, which increased global trade uncertainty and pushed up risk aversion. There was no clear direction coming out of the Fed's meeting minutes last night, but the potential bias was bullish.
At the beginning of the Asian session this morning, I also indicated that gold would rise and then fall. At present, it has reached the highest point near 3325 and then began to retreat, but the 4H golden cross has just been formed. There is still a certain pressure above 3333. If the gold price repeatedly competes for this position, we can continue to short without hesitation. The second short position today is near 3340-3345. There is potential momentum for the bulls in the short term. If the European session continues to fluctuate below 3333, then the entry of short positions will be slightly more stable. Yesterday, short orders were given at the key points of 3321 and 3333, and TP looked at 3310. If the bulls re-emerge below 3310-3305, you can consider short-term long positions and target 3330-3335.
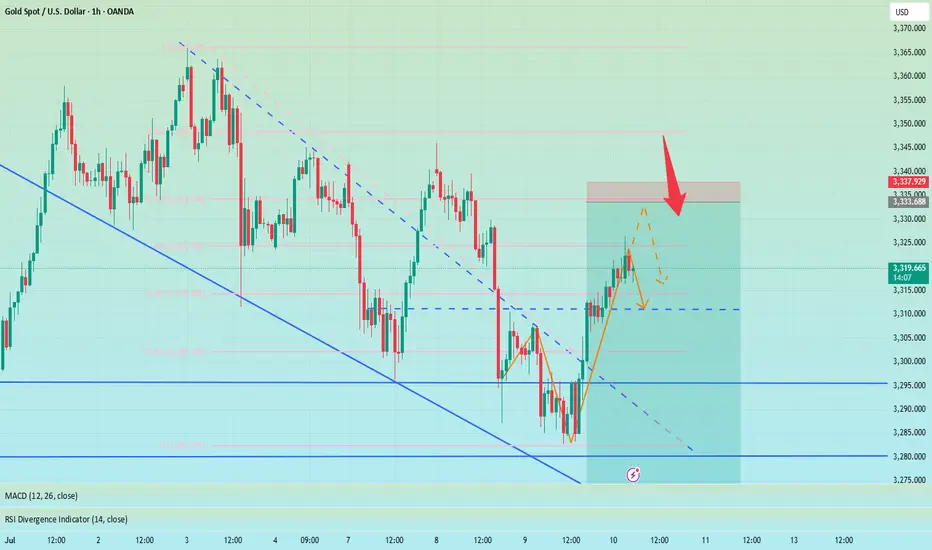
Gold Bounces Strongly from the Bottom XAUUSD: Gold Bounces Strongly from the Bottom – Is This the Start of a Breakout?
🌍 Macro Overview – Gold’s Movement and Market Sentiment
Gold recently experienced a strong bounce from the 3.282 USD/oz low, reaching 3.317 USD/oz. This movement has sparked some optimism, but let’s take a look at the key macroeconomic factors that might be influencing gold:
📉 US bond yields have decreased, signaling that market risk aversion is returning
💵 The USD remains strong, but buying interest in gold in Asia is increasing as confidence in fiat currencies begins to wane
🇪🇺 The EU is accelerating negotiations with the US on tariffs ahead of the August 1st deadline. If these talks fail, gold could benefit
🏦 The Fed continues to maintain interest rates, but the market is betting on a potential rate cut in September if inflation remains controlled
📊 US unemployment data and the Fed's speech tonight will be key, as the market is anxiously waiting for clues on the Fed’s next move
📊 Technical Analysis – Gold Approaching Key Resistance Levels
Gold is trading within a descending channel, but there are clear signs of a potential breakout after testing the lows.
Key resistance levels are found around 3330 – 3340, which will be crucial for determining if gold can continue its upward movement.
The Fair Value Gap (FVG) has appeared between 3310 – 3320, suggesting that if buying pressure continues, a breakout above these levels is likely.
🎯 Trading Strategy for Today – Focused on Clear Entry Points
🟢 BUY SCALP:
Entry: 3310 – 3308
SL: 3304
TP: 3314 → 3318 → 3322 → 3326 → 3330
🔵 BUY ZONE (safer entry points):
Entry: 3290 – 3288
SL: 3284
TP: 3294 → 3298 → 3302 → 3306 → 3310 → 3320 → 3330
🔴 SELL SCALP (if price hits resistance levels):
Entry: 3335 – 3337
SL: 3342
TP: 3330 → 3325 → 3320 → 3315 → 3310 → 3300
⚫ SELL ZONE (strong resistance at 3360-3362):
Entry: 3360 – 3362
SL: 3366
TP: 3356 → 3352 → 3348 → 3344 → 3340 → 3336 → 3330
📌 Note:
Always set SL and TP appropriately to protect your account, especially in a market that might experience significant volatility today.
Watch volume during London and New York sessions to gain clearer insights into market direction. If gold breaks above resistance, a strong breakout could follow.
💬 Gold has bounced back strongly, but is this the start of a larger rally, or just a temporary correction? What’s your take on today’s trend? Share your thoughts in the comments below!
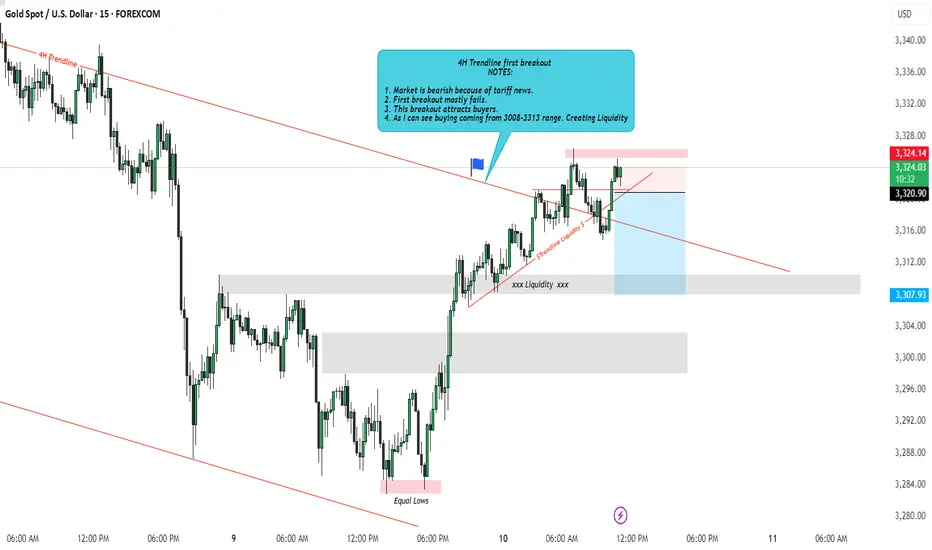
XAUUSD Idea: 4H Trendline First Breakout - Liquidity PlayFOREXCOM:XAUUSD
🔍 Analysis Overview:
Price has just broken above a 4H descending trendline for the first time. However, I remain cautious due to the following key observations:
📌 NOTES:
The broader market sentiment is still bearish due to recent tariff-related news, which often fuels risk-off behavior.
Historically, the first breakout of a strong trendline often fails, trapping early buyers.
This breakout is likely attracting buy-side liquidity, giving institutions an opportunity to hunt stops.
My observation shows buying interest started around the 3308–3313 range, suggesting smart money accumulation and a possible trap.
📉 I'm watching for a fake breakout and potential reversal targeting the liquidity zones marked below around 3307 and possibly lower.
The liquidity sweep below equal lows could offer a better risk-reward setup.
💡 Conclusion:
If price fails to hold above this breakout and shows signs of rejection, I will be anticipating a return towards the previous demand zone for a liquidity grab.
#XAUUSD #GoldAnalysis #SmartMoneyConcepts #LiquidityGrab #ForexTrading #TrendlineBreak #MarketPsychology #TradingSetup #SMC #PriceAction
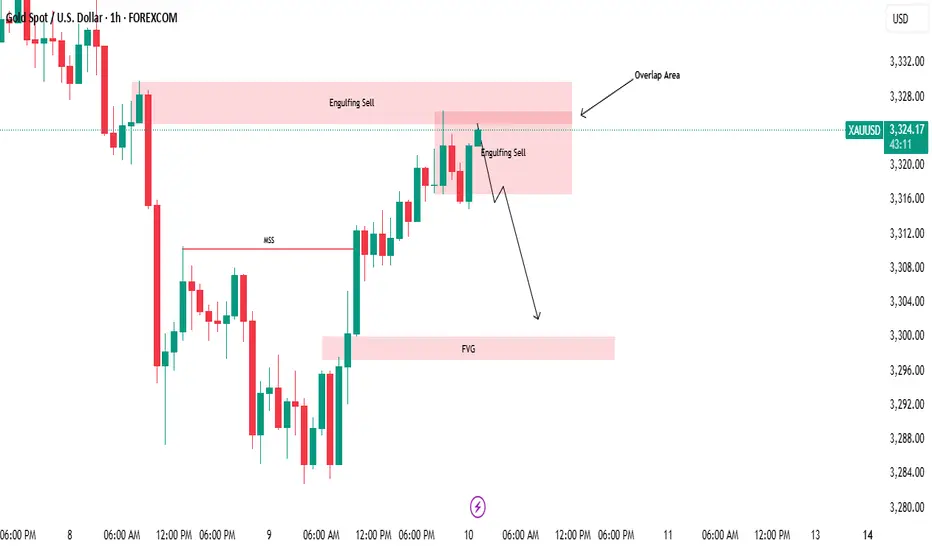
Market Structure Break & Bearish Reaction from Supply Zone.🔍 GOLD – Market Structure Break & Bearish Reaction from Supply Zone
Gold has recently broken its market structure (MSS), which is a significant shift in momentum and a potential indication of a change in the prevailing trend. Following this break, price retraced into a key supply zone, where it was rejected sharply—this rejection came in the form of a strong bearish engulfing candle, highlighting aggressive selling interest.
Interestingly, the market has now printed a second consecutive bearish engulfing from the same zone. This is a powerful signal that sellers are active and defending this level, making it a valid and confirmed short-term resistance zone. The repeated rejection suggests that smart money or institutional sellers may be positioned here.
Given this price action, we can anticipate a potential retracement from the current levels. The most probable downside target for this retracement would be the Fair Value Gap (FVG) that has been marked on the chart. If price respects the FVG and reacts bullishly from there, we may then see a resumption of the uptrend, possibly taking price higher again.
This setup presents a good opportunity for both short-term intraday traders and swing traders to watch for confirmation signals before entering the trade.
📌 Key Takeaways:
MSS indicates shift in trend
Consecutive bearish engulfing candles from supply zone
Sellers likely active in this area
Potential retracement toward marked FVG
Possible bullish continuation from FVG zone
🚨 As always, Do Your Own Research (DYOR) and manage your risk accordingly before making any trading decisions.
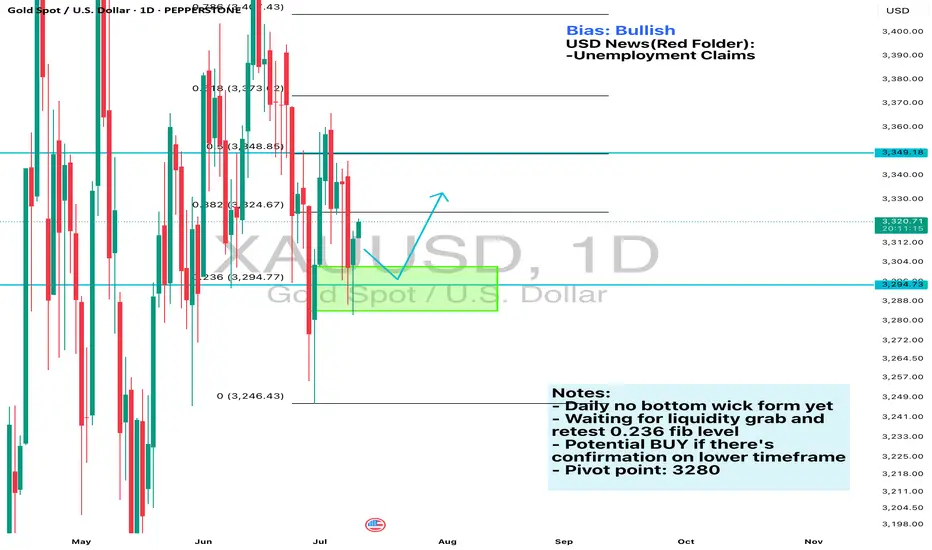
Daily Analysis- XAUUSD (Wednesday, 9th July 2024)Bias: Bullish
USD News(Red Folder):
-Unemployment Claims
Notes:
- Daily no bottom wick form yet
- Waiting for liquidity grab and
retest 0.236 fib level
- Potential BUY if there's
confirmation on lower timeframe
- Pivot point: 3280
Disclaimer:
This analysis is from a personal point of view, always conduct on your own research before making any trading decisions as the analysis do not guarantee complete accuracy.
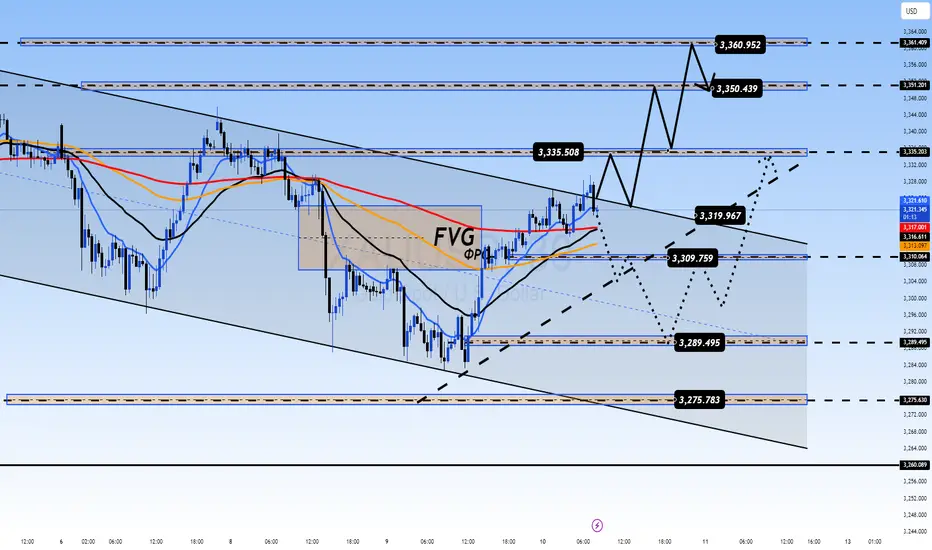
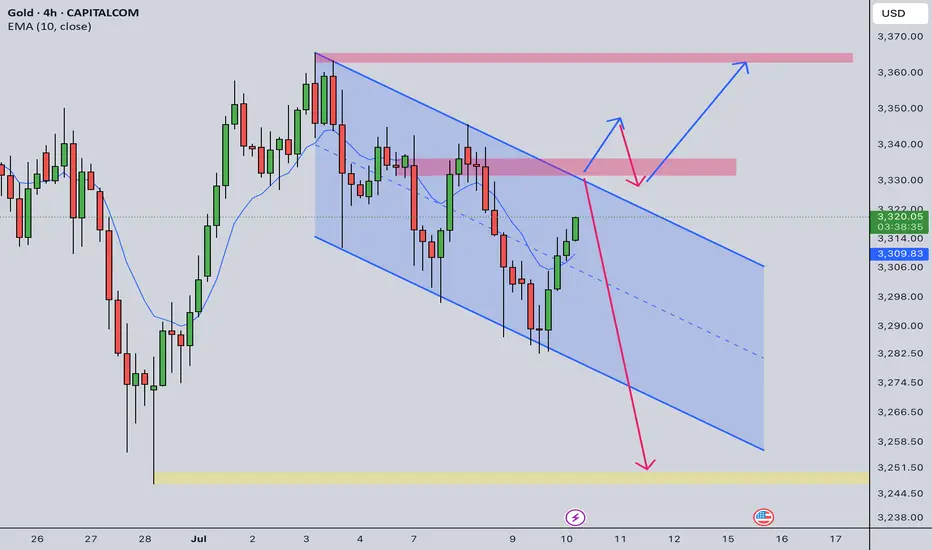
Gold Intraday Trading Plan 7/10/2025Gold has been very choppy recently. It seems not having any clear direction. Although in weekly post I am bearish in short term, there is lack of momentum for it to go down. Currently it is traded within a channel indicated in the chart. I am going to trade on the channel top.
If the channel holds, I will sell around 3330, towards 3250. If the channel top is broken, I will buy upon retest, towards 3365.
Analysis and strategy of gold trend on July 9:
Core logic sorting
Bull-bear game intensifies:
Positive factors:
Risk aversion: Trump's tariffs on Japan and South Korea (effective on August 1) caused market anxiety, and the decline of US stocks supported gold.
Central bank gold purchases: The People's Bank of China has increased its gold holdings for 8 consecutive months, and long-term demand is stable.
Negative factors:
Stronger US dollar: The US dollar index rose to 97.67 (a one-week high), suppressing gold pricing.
Technical pressure: $3345 has become a strong resistance, and multiple highs and falls show that bulls are weak.
Market focus:
In the short term, pay attention to the persistence of risk aversion and the trend of the US dollar index. If the US dollar pulls back or geopolitical risks escalate, gold may break through the range.
In the long run, the weak US dollar (down 10% this year) and global loose policies still support gold.
Key technical signals
1. Daily level
Range oscillation: 3295-3345 US dollars are in a narrow range, and the moving average is glued together, and it is necessary to wait for a directional breakthrough.
Long-short watershed:
Break above 3345 → open upside space, target 3380-3400.
Break below 3295 → may test 3270-3260 support.
2. 4-hour level
Signs of pressure: double tops formed near 3345, MACD golden cross momentum weakened, if the dead cross is confirmed, the callback will be strengthened.
Key support: 3300 (psychological barrier), if it falls below, look to 3270.
3. 1-hour level
Short-term bearish: moving average diverges downward, K-line is under pressure from short-term moving average, and the rebound momentum is insufficient.
Today's operation strategy
1. Main strategy: short on rebound
Entry point: short with a light position in the 3330-3335 range, stop loss above 3345.
Target: 3280-3270 (if it falls below 3270, hold and look at 3260).
Logic: 3345 resistance is effective + strong US dollar + technical side is bearish.
2. Auxiliary strategy: short-term long on pullback
Entry conditions: 3270-3260 stabilizes (such as K-line closes long lower shadow or MACD bottom divergence).
Stop loss: below 3250, target 3295-3300.
Logic: lower edge support of range + risk aversion may be repeated.
3. Breakthrough strategy
Break above 3345: chase long, target 3360-3380, stop loss 3330.
Break below 3260: wait and see whether the decline accelerates, avoid counter-trend operations.
Risk warning
Sudden events: If the US stock market plummets or the trade conflict escalates, gold may quickly break through 3345.
US dollar fluctuations: pay attention to whether the US dollar index can stand firm at 97.5. If it falls back, it will ease the pressure on gold.
Data impact: US economic data (such as PPI, Fed speech) may disturb the market.
Summary
Short-term: Prioritize shorting below 3345, and strictly stop loss.
Mid-term: If it breaks through 3345, turn to long thinking, and if it breaks below 3260, wait and see.

Gold Trading Strategy | July 9-10✅Yesterday, gold prices briefly surged due to heightened safe-haven demand, but we remained skeptical about the sustainability of the rebound and continued to uphold our strategy of shorting at higher levels. As expected, gold eventually moved lower, breaking below the previous day's low and establishing a bearish continuation pattern. Our bearish outlook was confirmed by market action.
✅In terms of price structure, although gold saw a moderate rebound during the latter part of the U.S. session, the momentum was weak, indicating that strong resistance remains overhead. The market continues to exhibit a bearish tone, so today’s strategy remains unchanged—waiting for a rebound to resume short positioning.
✅Technical Analysis:
🔸Daily Chart: Gold remains in a state of high-level consolidation with signs of momentum exhaustion. Yesterday’s price action saw resistance near the 3345 level once again, followed by a pullback. Although it temporarily broke below 3300, the price later recovered, reflecting a tug-of-war between bulls and bears. The candlestick pattern shows alternating bullish and bearish candles, lacking sustained direction, and no clear single-sided trend has emerged yet.
🔸4H Chart: Gold continues to trend lower in a step-like, descending pattern. The recent high at 3345 marks a lower high, and current resistance is forming near the downtrend line and the midline of the Bollinger Bands—around 3333 and 3320. Price action suggests high probability of rejection in this zone. We recommend continuing to short near resistance, with the next target at the 3255 level. The overall structure remains a slow, choppy downtrend.
🔸1H Chart: The bearish trend persists with new local lows being formed. Moving averages are aligned in a clear downtrend formation with strong bearish momentum. After breaking below 3313 yesterday, a minor rebound failed to hold, confirming 3313 as a key resistance level. Now, early trading is facing pressure near 3315, suggesting a good area to look for short entries.
🔴Key Resistance Zone: 3315–3320
🟢Key Support Zone: 3287–3275
✅Trading Strategy Reference:
🔻Short Strategy:
🔰Enter short positions in the 3313–3315 area in multiple entries.
🔰Stop loss: 8–10 USD
🔰Target: 3300–3285, with potential extension toward 3275 if support is broken.
🔺Long Strategy:
🔰Consider long positions in the 3275–3278 range with staggered entries.
🔰Stop loss: 8–10 USD
🔰Target: 3290–3300, with further upside potential toward 3305 if resistance breaks.
🔥Note: Trading strategies are time-sensitive. For more accurate and real-time Trading Signals, feel free to contact me directly.
7.9 Latest gold trend analysis and operation layout📰 News information:
1. Federal Reserve meeting minutes
📈 Technical Analysis:
Our decision to close our positions at 3305 yesterday was undoubtedly a very strategic one. After reaching a high of around 3310 last night, it began to fall. At the same time, I also gave VIP members the news that it might fall back to around 3300. Since the opening, the lowest point has reached around 3285. The overall trend is still under our control.
At present, gold will still usher in technical corrections in the short term. The current price of 3293-3290 support can be considered for long positions. If the European session continues to fall below the low, you can try to go short during the NY session. If the European session continues to maintain sideways consolidation, you can consider retreating and going long during the NY session. As long as the key support of 3250 below is held, gold will maintain its consolidation trend in short-term trading. On the contrary, once it falls below 3250, gold may directly touch the 3200 mark. Focus on the minutes of the Federal Reserve meeting, which may further influence the trend of gold.
🎯 Trading Points:
BUY 3293-3290-3285
TP 3305-3310-3320
In addition to investment, life also includes poetry, distant places, and Allen. Facing the market is actually facing yourself, correcting your shortcomings, facing your mistakes, and exercising strict self-discipline. I share free trading strategies and analysis ideas every day for reference by brothers. I hope my analysis can help you.

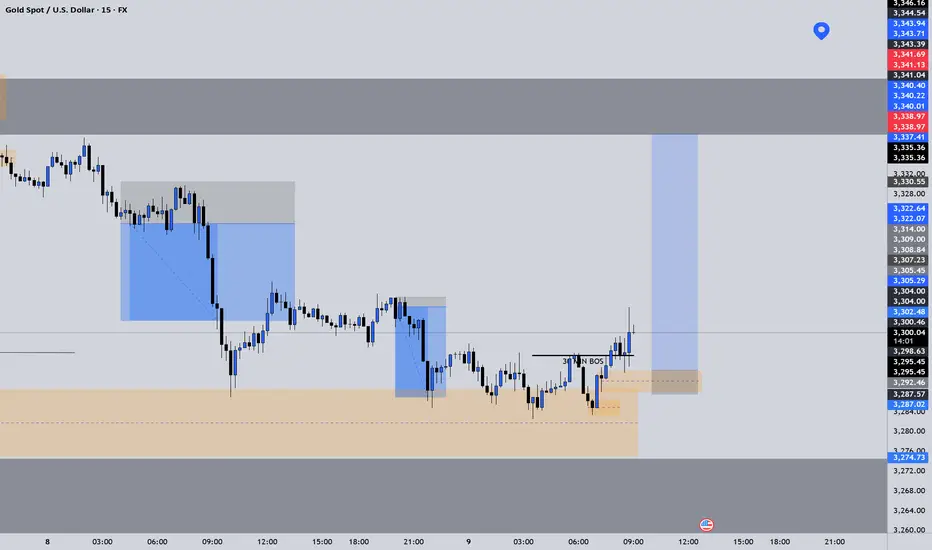
XAUUSD LongElite Analysis
Price came to primary OB.
30m Long BOS was confirmed.
Executed long trade from 10m OB.
Targeting above LP's and top market structure.