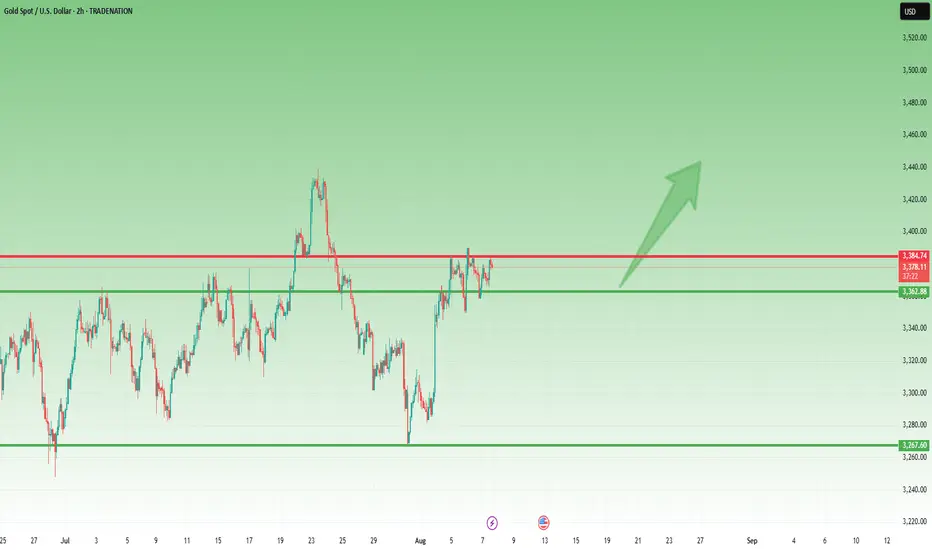
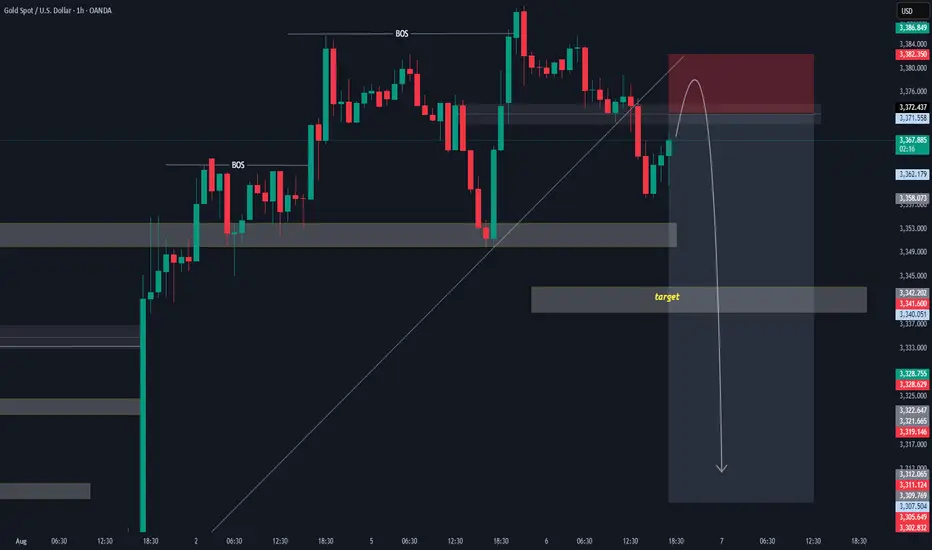
Gold Price Action Update: Neutral to Bearish BiasThis week, apart from my short trade on Tuesday, I’ve maintained a bullish outlook on Gold, suggesting buying the dips with the expectation of a breakout above the 3380-85 zone. I was targeting an acceleration above 3400 and eventually 3440. I followed through with this idea and bought in anticipation of the move.
However, something about Gold's recent price action raised a red flag for me, prompting me to close my buy positions. Let’s break it down:
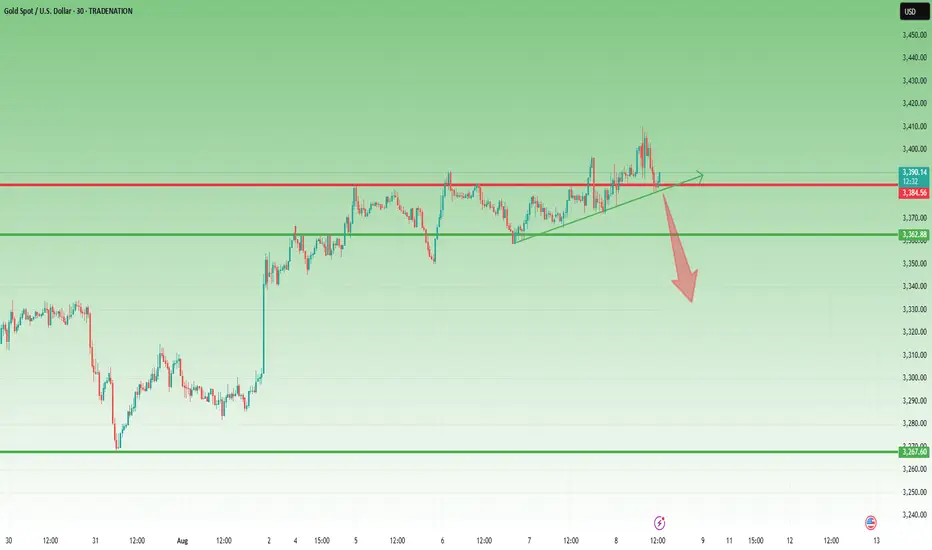
Starting yesterday morning, the price action became erratic. Initially, we saw the expected breakout, but it was quickly reversed, and the price action turned choppy. Then came a series of quick pumps, followed by quick reversals—each time the market would move up, only to fall back again. As of writing, we’re sitting at 3388.
This kind of erratic movement usually suggests that we’re nearing a top, and even if Gold spikes again above 3400, I don’t want to hold positions in a market that’s so volatile and unsustainable in either direction.
So, I’m out for now, adopting a neutral to bearish stance.
If the price drops below 3370, it would indicate a likely top formation, and at that point, I’ll be looking to sell rallies; till then, wait and see.
Disclosure: I am part of TradeNation's Influencer program and receive a monthly fee for using their TradingView charts in my analyses and educational articles.
XAUUSD trade ideas
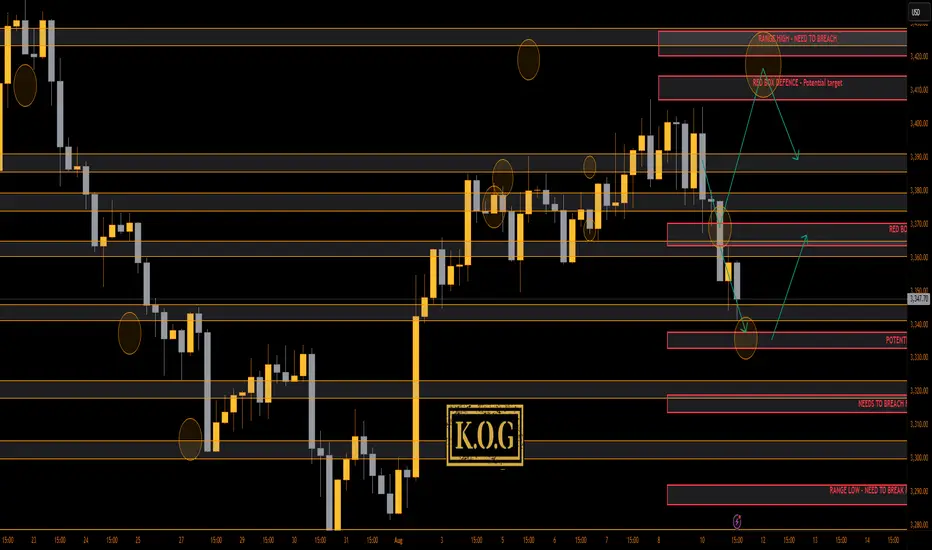
THE KOG REPORT - UpdateEnd of day update from us here at KOG:
We did not expect an open like that! Honestly, we were expecting a low volume day of ranging and choppy price action like last week, but from the get go, gold was off! It resistance the level we wanted, came down in to the 3370-5 level we wanted, gave us nearly 100pips, then continued to break through the bias level and complete all of our target prices. Because we didn't get the opportunity to short it, we only managed to capture some nice tap and bounces to walk away with an extremely good pip capture.
So, what now?
We have a red box break with the lower level 3335-40 open but price is struggling here just below 3350. Resistance is the 3365 level which would be a good target from that lower region as long as we support. We'll keep that path shown for now.
KOG’s Bias for the week:
Bullish above 3365 with targets above 3408, 3410, 3415 and above that 3420
Bearish below 3365 with targets below 3359✅, 3355✅, 3350✅ and below that 3345✅
RED BOX TARGETS: (You can see how effective these are so please make use of these together with the analysis and bias we share. It all goes together, without PRICE ACTION knowledge you only have hope)
Break above 3406 for 3407, 3410, 3420, 3429, 3430 and 3435 in extension of the move
Break below 3395 for 3393✅, 3385✅, 3380✅ and 3370✅ in extension of the move
Please do support us by hitting the like button, leaving a comment, and giving us a follow. We’ve been doing this for a long time now providing traders with in-depth free analysis on Gold, so your likes and comments are very much appreciated.
As always, trade safe.
KOG
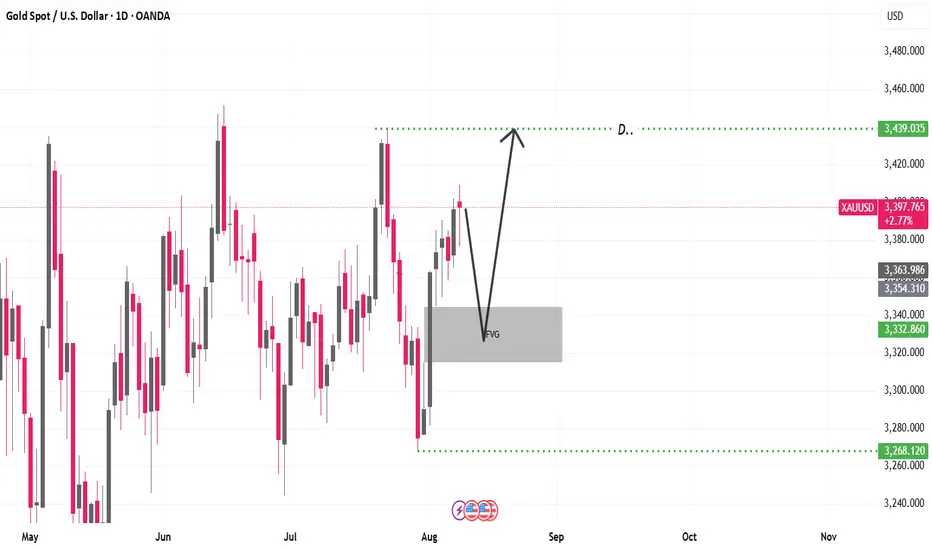
Gold analysis for this weekI expect a gold correction at the level of 3,334. 09 and after a correction we move to the level of 3,439. 03 and if we do not respect the upward price gap we may move to the level of 3,268. 12
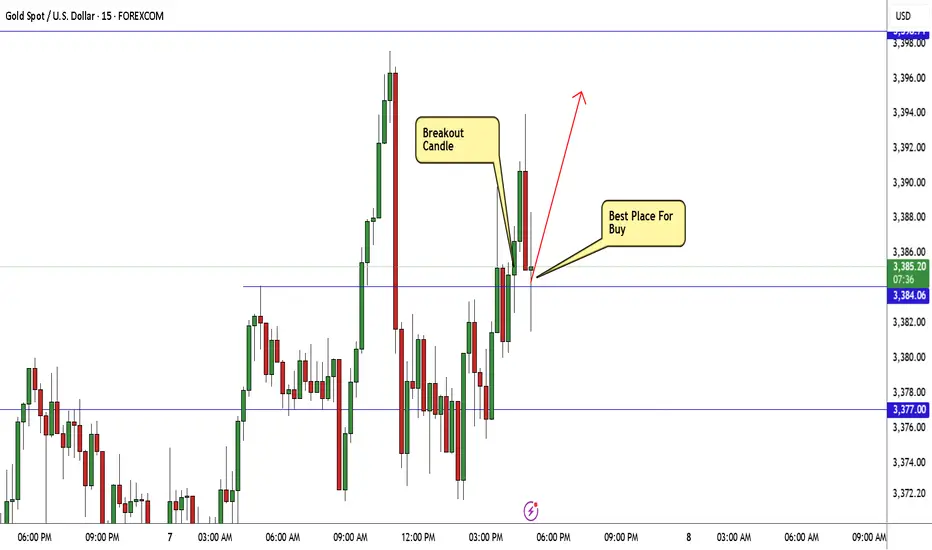
GOLD Breakout Done , Long Setup Valid To Get 150 Pips !Here is My 15 Mins Gold Chart , and here is my opinion , we finally above 3384.00 and we have a 30 Mins Candle closure above it And Perfect Breakout , so we have a good confirmation now to can buy it and we can targeting 100 to 150 pips .
Reasons To Enter :
1- New Support Created .
2- Bullish Price Action .
3- Bigger T.F Giving Good Bullish P.A .
4- Clean Breakout .
THE KOG REPORT - UpdateEnd of week update from us here at KOG:
KOG’s bias for the week:
Bullish above 3340 with targets above 3370✅, 3373✅, 3379✅ and above that 3384✅
Bearish on break of 3340 with targets below 3330, 3320 and below that 3310
RED BOXES:
Break above 3365 for 3372✅, 3375✅, 3379✅, 3384✅ and 3390✅ in extension of the move
Break below 3350 for 3346, 3340, 3335 and 3330 in extension of the move
All bullish above targets completed, no breaks below so we need not worry about the bearish below targets.
Not a bad week at all, even with the ranging and choppy price action. As you can see the red boxes shared for free have worked well and held price giving opportunities up and down following the path and the red box targets. Yesterday we also hit the final target we wanted for the week so no complaints.
Today, we haven't done much apart from a few long trades but now, due to it being late session we would like to see how the market closes and prepare for next week.
Support here stands at the 3375 level with resistance sitting at 3410 which is a possibility if we continue to hold. Is it worth taking however, we don't think so.
LEARN AND GENERATE YOUR OWN SIGNALS. You don't need any of us to guide you.
Please support us and the free channel by hitting the like/boost 🚀 button 🙏 on our Tradingview ideas
As always, trade safe.
KOG

Gold – Bulls Hold the Line, Pressure Builds for Upside BreakoutIn yesterday’s analysis, I argued that following Tuesday’s reversal — which printed a strong continuation bullish Pin Bar — buyers had regained control despite the intraday pullback.
For this reason, I suggested looking to buy dips, as the structure remained constructive.
And once again, during yesterday’s session, the scenario repeated itself.
The drop toward the 3360 zone was met with renewed buying interest, keeping the bullish structure intact.
________________________________________
🔍 Technical Context – Higher Lows Building Pressure
At the time of writing, Gold is trading around 3380, a short-term resistance area that has capped gains so far.
However, the technical picture remains bullish:
Starting with Monday’s low at 3340, which came after a strong impulsive leg up, price has printed a clear succession of higher lows.
This behavior strongly suggests increasing buying pressure and builds the case for a potential breakout to the upside.
________________________________________
🎯 Trading Bias – Holding My Long Position
My bias remains bullish.
In fact, I’m currently holding a long position, entered yesterday, which is now running with a 150 pips unrealized profit.
I’m sticking with the trade, anticipating that a confirmed break above 3380–3390 could trigger upside acceleration toward my final target — a 750 pips profit objective.
________________________________________
🔄 What to Watch Next
• Daily close: A close above 3380=3385 zone would add confirmation to the bullish thesis.
• Key support: The zone around 3360 is now support.
• Breakout trigger: A move above 3380–3385 could unleash momentum buying and open the path to higher levels.
________________________________________
Let’s stay patient and let the market confirm the breakout.
Until then, the structure favors the bulls. 🚀
Disclosure: I am part of TradeNation's Influencer program and receive a monthly fee for using their TradingView charts in my analyses and educational articles.
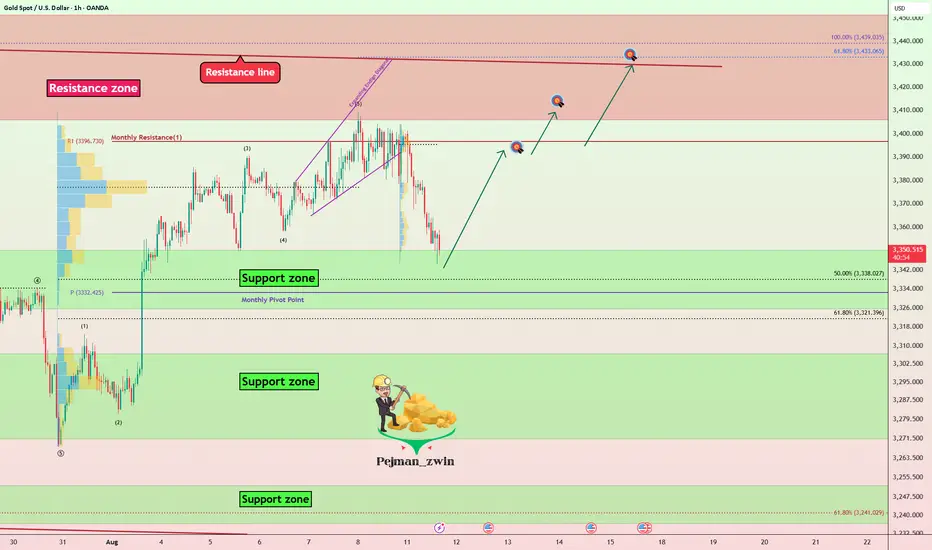
Gold Correction Ending — Time for the Next Rally?Gold ( OANDA:XAUUSD ) is currently moving near the Support zone($3,350-$3,326) and the Monthly Pivot Point .
In terms of Elliott Wave theory , it seems that Gold is completing a corrective wave, and we should wait for the next impulse wave .
I expect Gold to start rising from the Support zone($3,350-$3,326) and rise to at least $3,393 .
Second Target: $3,407
Third Target: $3,427
Note: Stop Loss (SL) = $3,317
Gold Analyze (XAUUSD), 1-hour time frame.
Be sure to follow the updated ideas.
Do not forget to put a Stop loss for your positions (For every position you want to open).
Please follow your strategy; this is just my idea, and I will gladly see your ideas in this post.
Please do not forget the ✅ ' like ' ✅ button 🙏😊 & Share it with your friends; thanks, and Trade safe.
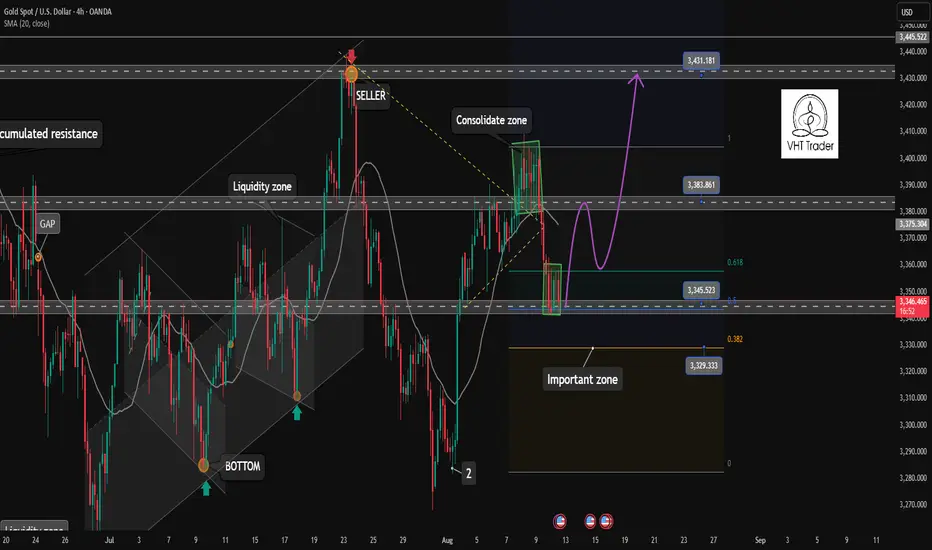
At which support zone will the correction wave end?✏️The accumulation of Gold price in today's trading day from Fibocacci 0.5-0.618 is raising the question of whether the bullish wave structure will continue. Previously a perfect push of Gold price from 3282 to 3406 formed a wave 3 increase, currently the decline in the beginning of the week of Gold is running in the corrective wave of wave 4. 3330 is an important zone in the bullish wave structure, if this zone is broken, the market will end the bullish wave towards ATH.
📉 Key Levels
BUY trigger The reaction of the buying candle at 3330
BUY trigger The confirmation of the candle closing above 3357 (fibonacci 0.618)
Target 3383 Higher is 3431
Leave your comments on the idea. I am happy to read your views.
Latest Gold Price Update TodayHello, let’s strategize and analyze OANDA:XAUUSD together!
Last week, the gold market went through a highly volatile phase when rumors surfaced that the US would impose a 39% tax on gold bars imported from Switzerland on Thursday afternoon. This news immediately triggered a strong buying surge, pushing the spot price of gold above the critical resistance level of 3,400 USD, although the White House later denied it.
Earlier in the week, gold opened at 3,360 USD and fluctuated multiple times between 3,345 and 3,396 USD/ounce as buying and selling forces battled. Interestingly, even after the tax rumor was debunked, the price of gold only dropped slightly before rebounding and maintaining around 3,400 USD until the end of the week.
According to my analysis, gold is currently correcting and moving around 3,370 USD. The 3,435 USD level (the recent peak) is crucial to watch closely. This level has been tested three times in May, June, and July without being broken, reflecting the consistent strength of the buyers.
Looking further ahead, the 3,500 USD level remains a significant resistance. "I hope the next test will come after a steady upward trend, rather than a quick breakout, as this could lead to a stagnation in the rally," I believe.
The overall market sentiment is also positive: the latest survey shows that about 60% of Wall Street experts predict gold prices will continue to rise, while only 10% foresee a decline, with the rest expecting sideways movement. On the retail side, around 69% of individual investors remain optimistic about gold’s short-term outlook.
What about you? How do you predict gold’s movement?
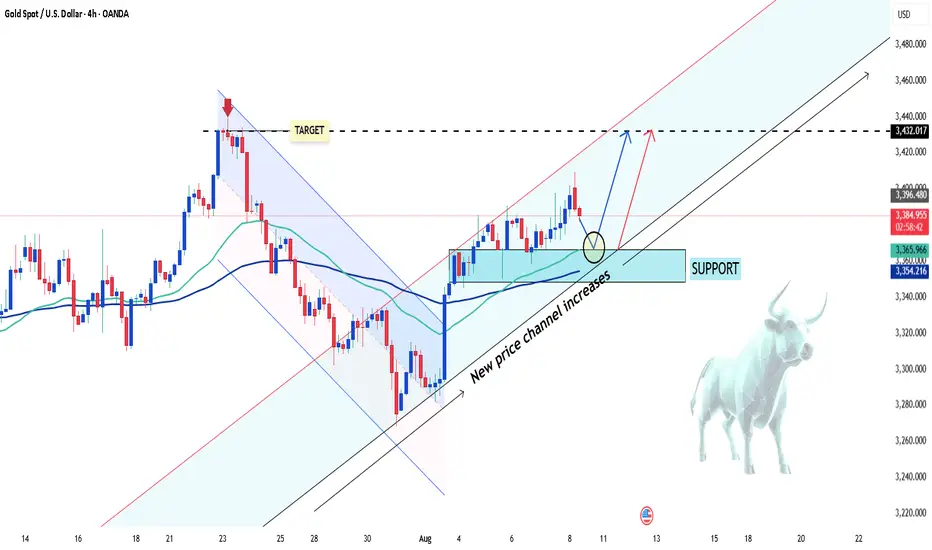
Gold Continues Strong Bullish Move Hello everyone, wishing you a great trading day!
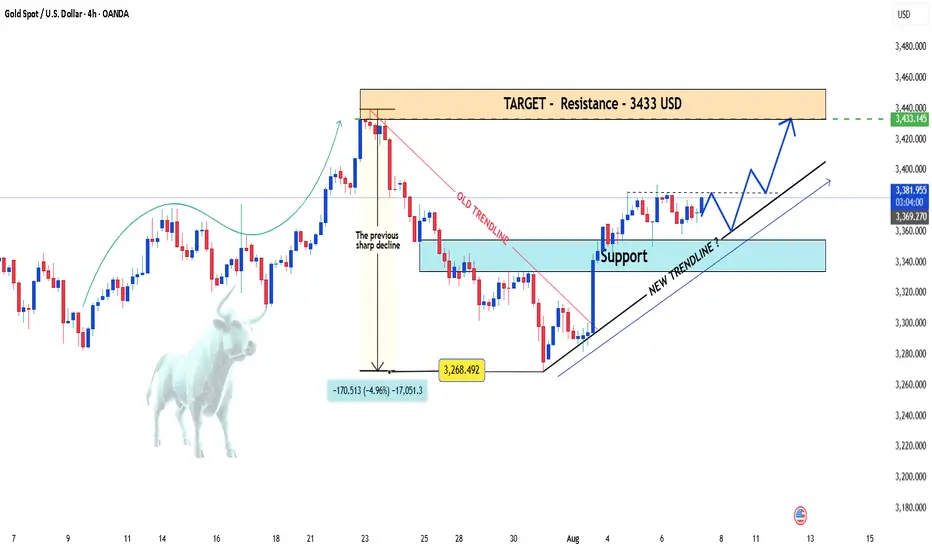
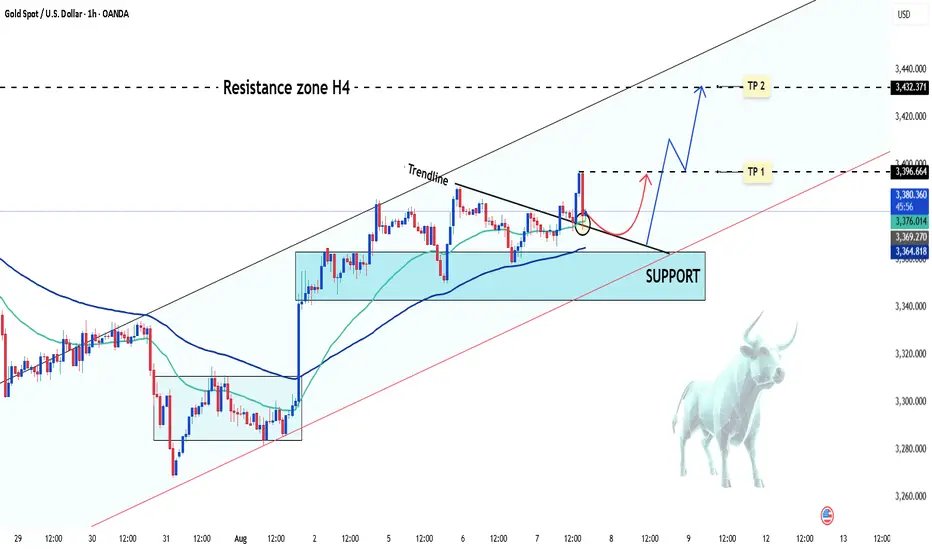
After a sharp decline from the recent highs, OANDA:XAUUSD quickly regained its strength and established a clear upward trend. The H4 chart shows the potential formation of a new upward trendline, with support positioned around the 3,350 USD zone.
This recent recovery is not just a technical bounce – it's supported by strong fundamental factors: weakening US bond yields, rising expectations that the Fed will cut interest rates in September, and a market sentiment that’s leaning towards safe-haven assets.
Currently, gold is trading around 3,380 USD and seems to be consolidating the momentum to approach the next resistance level at 3,433 USD. If the price holds above the new trendline and doesn’t break the marked support, the continuation of the upward trend is highly likely.
Personal view: The bullish trend remains intact – just a breakout confirmation and the 3,433 USD target will be within reach.
What do you think? Will gold continue its breakout this week? Leave your thoughts in the comments below!
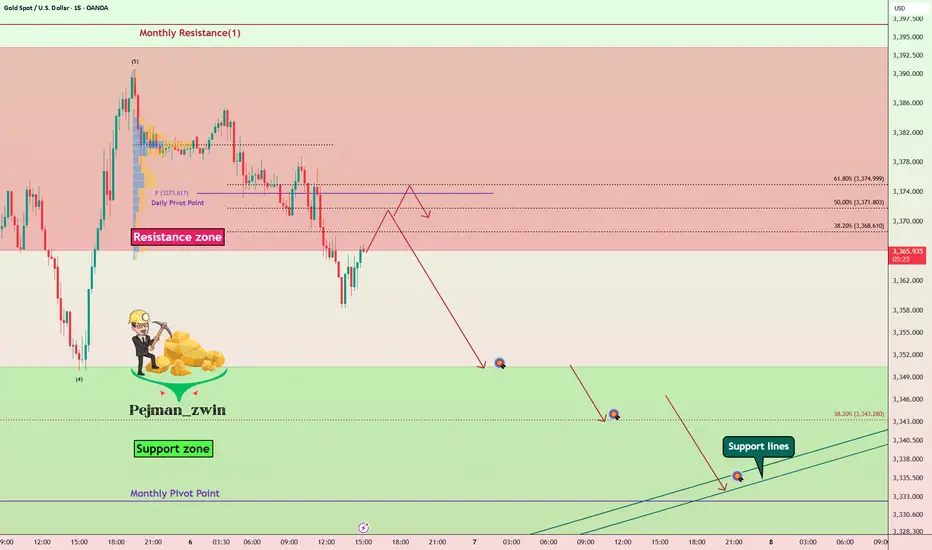
Gold Roadmap — Short termGold ( OANDA:XAUUSD ) rose to $3,383 as I expected in yesterday's idea .
Gold is currently moving in the Resistance zone($3,393-$3,366) .
In terms of Elliott Wave theory , it seems that Gold has completed 5 impulse waves , and we should wait for corrective waves on the 15-minute time frame .
I expect Gold to start declining from one of the Fibonacci levels and fall to at least $3,351 .
Second Target: $3,344
Third Target: Monthly Pivot Point/Support lines
Note: Stop Loss (SL) = $3,392
Gold Analyze (XAUUSD), 15-minute time frame.
Be sure to follow the updated ideas.
Do not forget to put a Stop loss for your positions (For every position you want to open).
Please follow your strategy; this is just my idea, and I will gladly see your ideas in this post.
Please do not forget the ✅ ' like ' ✅ button 🙏😊 & Share it with your friends; thanks, and Trade safe.
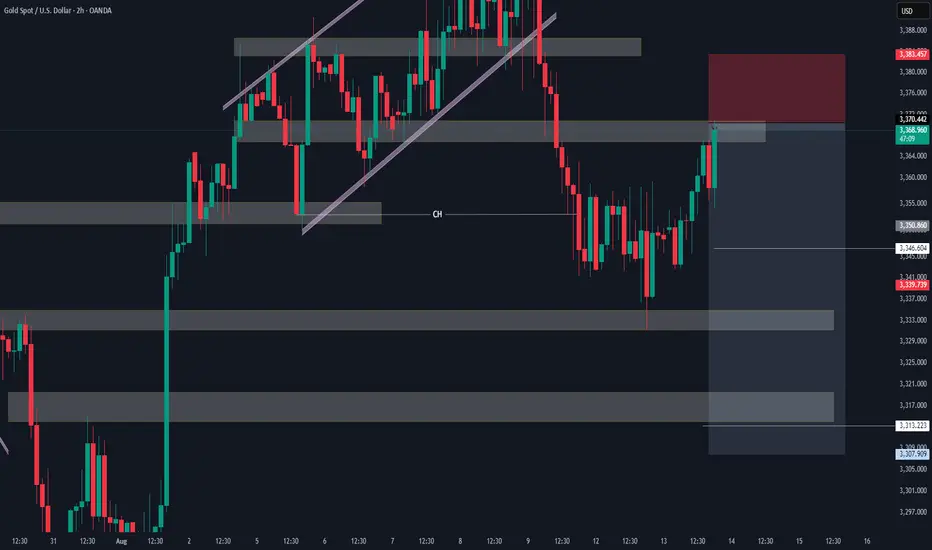
GOLD undecided: Looking for a positive outlookThe current market context on GOLD seems undecided and heavily influenced by news release and macroeconomic catalysts. The recent reversal from the support was pretty decisive, catching short-sellers off guard and forcing them to cover positions.
However, the structure has yet to produce a clean breakout beyond the mid-range, suggesting a lack of strong conviction from either side.
The probability of a pause or reversal here under this circumstances may increase substantially as well. But if I were to take a side I would definitely choose more upside , before any correction begins.
This is a high-risk zone for positioning without confirmation. The market is potentially preparing for a breakout or a fakeout, and patience is key. Wait for clear signs of intent before committing.

The Illusion of ControlThere comes a point in every trader’s journey when you do everything right, and it still goes wrong.
You plan the trade meticulously, plot the levels, define your risk, wait patiently for the setup, and enter with the kind of discipline that would make any textbook proud. You follow your rules. You trust your process. And yet, the market does what it does!
It breaks through your stop as if your risk management was never there. Sometimes it gaps hard against you, leaving no room to act. Sometimes it simply meanders sideways, wearing down your conviction until, exhausted and uncertain, you exit - only to watch the market finally rally the moment you’re out.
This experience is frustrating and discouraging. Yet, for those with enough experience, it's a familiar scenario.
It's not just about losing money, though that definitely stings. This kind of hit really messes with your confidence, throws off your game, and makes you feel disconnected from your work. Before you know it, those sneaky little doubts creep in: Did I miss something? Could I have stopped this? Am I just not good enough at this yet?
So you go back to the charts, really digging into every detail. You watch replays, try out new filters, and pile on more indicators, scrutinizing the trade from every possible angle. You tell yourself this super careful process makes you better, a crucial part of being a professional. But if you're real with yourself, it's more than just getting better. Underneath all this striving for improvement is often a deeper reason: you really want to be in control.
We often discuss risk management, patience, and emotional discipline, yet we seldom acknowledge our deep-seated desire to control the market. We invest countless hours in learning, testing, and refining, expecting our efforts to yield tangible results. When the market doesn't respond as we anticipate, it's disheartening. This is because, at our core, we not only aspire to be skilled traders but also crave the belief that we are truly in command.
The market just does its thing, plain and simple. It doesn't care how much work you put in or how carefully you prepare. It's not about rewarding effort; it just moves. Trying to find a reason for every little change is pointless, like trying to argue with the ocean. You can't outsmart randomness; you can only learn to coexist with it.
The best traders do prepare with care. They’re thoughtful, meticulous, and dedicated. But many cross a subtle line, often unknowingly - the line where preparation morphs into obsession, where working harder becomes an emotional shield, and where we start to believe that if we can just control every input, we can guarantee the output.
This is where it all becomes dangerous. Not financially, necessarily, but psychologically. When your self-worth becomes intertwined with your performance, every loss starts to feel personal. Every drawdown feels like an indictment. You tell yourself you’re striving for excellence, but what you’re really chasing is certainty; and in a domain governed by uncertainty, that’s a recipe for chronic frustration.
The truth is, trading isn't about being right all the time, or even most of the time. The real skill is staying cool when you mess up and not freaking out when things go sideways. You don't have to be perfect; you just need to handle the unknown without needing to control it. You won't pick up this tough lesson from courses, forums, or even tons of practice, unless you're truly reflecting on what you're doing. You learn it by watching winning trades go bad, by handling losses without freaking out, and by being able to stay cool when things get uncomfortable.
You know that annoying feeling we sometimes get? It's usually just fear, popping up as worries about messing things up, looking foolish, or not being quite good enough. When you're trading, these fears can seriously mess with your mind. You might jump into trades too quickly, fiddle with your stop-loss, settle for smaller gains, or just abandon your whole strategy when things get tough. We might try to convince ourselves we're being clever, but typically, we're just trying to escape feeling uncomfortable.
Trying too hard to control the market often hurts your edge. Trading systems usually don't fail because of math errors; they fail because traders don't have the patience to stick with them through tough times and let them do their job.
Every trader eventually faces a fundamental, liberating truth: you are not in control. Once you accept this, you can stop trying to control the uncontrollable and instead concentrate on what you can manage: your risk, routine, discipline, and behavior.
Detaching from the outcome isn't about indifference or a lack of concern; it's about embracing trust. Trust in your preparation. Trust in your edge. Trust in the law of large numbers — that over time, if you execute consistently, the results will follow. Not perfectly, not smoothly, but faithfully.
You build trust over time, often without even realizing it. It's about sticking to your plan even when things aren't going your way, taking losses in stride, and not messing with something that's working, just because it hasn't paid off yet.
Over time, your trading approach transforms. You no longer dwell on every loss or micromanage winning trades. The urge to constantly adjust your system after a bad week/month subsides. Your perspective broadens; you begin to think in terms of years, not just days. This shift cultivates a deeper, process-driven confidence, untethered from mere numbers. You stop striving for absolute control, and in doing so, discover a sense of peace.
True mastery isn't about dominating the market, but rather relinquishing the illusion that you ever could.
Gold price maintains upward trend to 3400⭐️GOLDEN INFORMATION:
Gold (XAU/USD) edged lower during the North American session, pressured by rising U.S. Treasury yields, profit-taking, and reports that President Donald Trump may announce a replacement for Fed Governor Adriana Kugler later this year. The precious metal is trading around $3,372, down 0.23%.
After a three-day rally, bullion struggled to gain further traction as investors locked in profits. This came despite Trump signing an executive order imposing a 25% tariff on India in response to its continued imports of Russian oil. The new duties—set to take effect 21 days after August 7—will raise tariffs on select Indian exports to as much as 50%.
⭐️Personal comments NOVA:
Gold prices continue to increase, heading towards 3400. The context of trade tensions heats up again, along with increasing expectations of interest rate cuts.
⭐️SET UP GOLD PRICE:
🔥SELL GOLD zone: 3429- 3431 SL 3436
TP1: $3418
TP2: $3408
TP3: $3392
🔥BUY GOLD zone: $3332-$3330 SL $3325
TP1: $3342
TP2: $3355
TP3: $3368
⭐️Technical analysis:
Based on technical indicators EMA 34, EMA89 and support resistance areas to set up a reasonable BUY order.
⭐️NOTE:
Note: Nova wishes traders to manage their capital well
- take the number of lots that match your capital
- Takeprofit equal to 4-6% of capital account
- Stoplose equal to 2-3% of capital account

Gold Potential UpsidesHey Traders, in today's trading session we are monitoring XAUUSD for a buying opportunity around 3,360 zone, Gold is trading in an uptrend and currently is in a correction phase in which it is approaching the trend at 3,360 support and resistance area.
Trade safe, Joe.
GOLD NEXT MOVE (expecting a bearish move)(13-08-2025)Go through the analysis carefully and do trade accordingly.
Anup 'BIAS for the day (13-08-2025)
Current price- 3370
"if Price stays below 3382, then next target is 3360, 3350 and 3320 and and above that 3400 ".
-POSSIBILITY-1
Wait (as geopolitical situation are worsening )
-POSSIBILITY-2
Wait (as geopolitical situation are worsening)
Best of luck
Never risk more than 1% of principal to follow any position.
Support us by liking and sharing the post.
GOLD ROUTE MAP UPDATEHey Everyone,
Great finish to the week with our chart idea playing out as analysed.
We complete dour Bullish target 3370 followed with cross and lock confirmation opening 3392 also completed this week. We now also have a cross and lock above 3392 opening 3416.
We will keep the above in mind when taking buys from dips. Our updated levels and weighted levels will allow us to track the movement down and then catch bounces up.
BULLISH TARGET
3370 - DONE
EMA5 CROSS AND LOCK ABOVE 3370 WILL OPEN THE FOLLOWING BULLISH TARGETS
3392 - DONE
EMA5 CROSS AND LOCK ABOVE 3392 WILL OPEN THE FOLLOWING BULLISH TARGET
3416
We will now come back Sunday with a full multi timeframe analysis to prepare for next week’s setups, including updated views on the higher timeframes, EMA alignments, and structure expectations going forward.
Thanks again for all your likes, comments, and follows.
Wishing you all a fantastic weekend!!
Mr Gold
GoldViewFX

GOLD NEXT MOVE (expecting a bearish move)(06-08-2025)Go through the analysis carefully and do trade accordingly.
Anup 'BIAS for the day (06-08-2025)
Current price- 3370
"if Price stays below 3380, then next target is 3360, 3345 and 3330 and above that 3400 and 3440 ".
-POSSIBILITY-1
Wait (as geopolitical situation are worsening )
-POSSIBILITY-2
Wait (as geopolitical situation are worsening)
Best of luck
Never risk more than 1% of principal to follow any position.
Support us by liking and sharing the post.
Gold rises on continued central bank buyingHello everyone, great to see you again!
Gold prices have continued their upward momentum since last night, reaching as high as 3,403 USD, up 33 USD from the session’s low. At the time of writing, gold is undergoing a slight pullback but remains elevated around 3,385 USD.
The primary driver behind today’s rally is news that the People’s Bank of China (PBoC) continued accumulating gold in July, marking the ninth consecutive month of purchases.
Specifically, PBoC’s gold reserves increased by 60,000 ounces, bringing total holdings to 73.96 million ounces. Since November last year, China has purchased roughly 36 tonnes of gold in a move to diversify reserves and reduce reliance on the US dollar.
This trend of central bank gold buying, particularly by China, has been one of the key factors pushing gold prices up by 30% year-to-date, even though the pace has slowed as prices remain high.
With continued buying from central banks, gold is expected to maintain its upward trajectory, although a stronger US dollar could pose some headwinds.
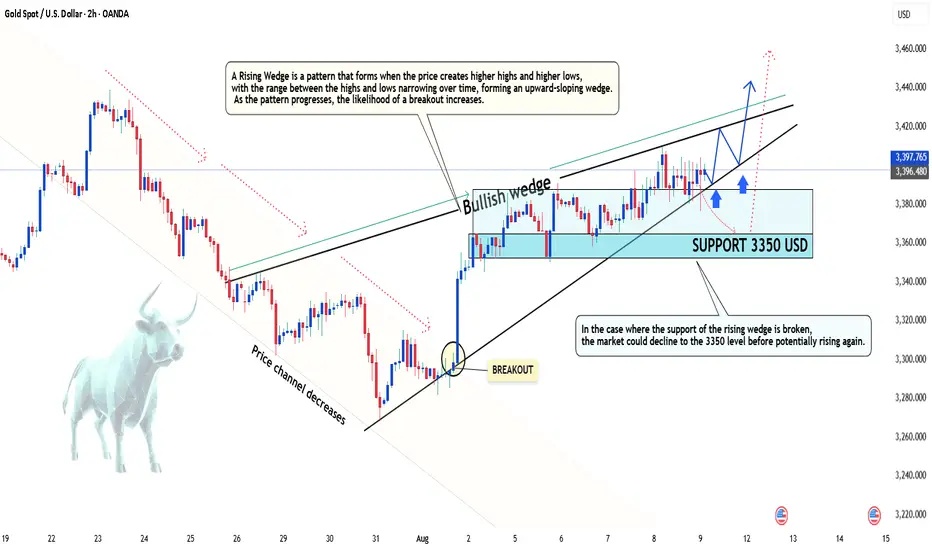
Gold holds its bullish momentum - Strategy 1000 pips ? Hello everyone, what do you think about gold prices?
Yesterday, gold ended the session near the key psychological level of 3,400 USD. Overall, the metal remains in a short-term uptrend.
Some immediate supporting factors include:
-Concerns about the US economy – The Fed may soon have to cut interest rates, weakening the USD and making gold more attractive.
-Geopolitical uncertainty – Trade tensions between the US and India over Russian oil imports are prompting investors to turn to gold.
-Financial market volatility – Global equities show signs of a pullback after a strong rally, driving defensive capital flows into gold to reduce portfolio risk.
From a technical perspective: XAUUSD is maintaining a steady upward trend after breaking out of its previous down channel and forming a Rising Wedge pattern. On the chart, prices are consistently creating higher highs and higher lows, with the range narrowing over time — a sign that the market is consolidating before a potential breakout.
Currently, the lower boundary of the wedge is acting as support. If prices hold above this level, the primary scenario remains a move higher toward the 3,433 to 3,450 USD resistance zone. Conversely, if the wedge’s support is broken, the price could retrace to 3,350 USD before the uptrend resumes.
And you — what’s your view on XAUUSD’s next move? Share your thoughts in the comments!
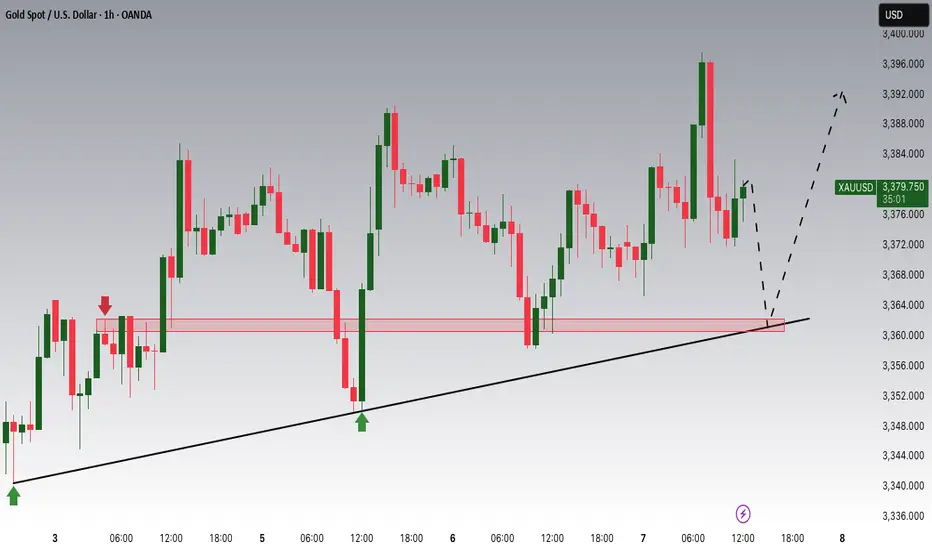
XAU/USD Short-Term Buy Opportunity ? XAU/USD has recently formed a bullish pattern, currently trading around 3,380 USD and showing an increase of more than 10 USD for the day.
From a technical analysis perspective, the price is following an upward trendline and showing signs of momentum accumulation. The area around 3,350 USD provides strong support, which could establish a solid base for further upward movement.
Key Levels:
Resistance (Target 1): 3,396 USD
Resistance (Target 2): 3,432 USD
To consider a short-term buy, it’s important to monitor price action around the support levels and wait for confirmation t
Good luck!
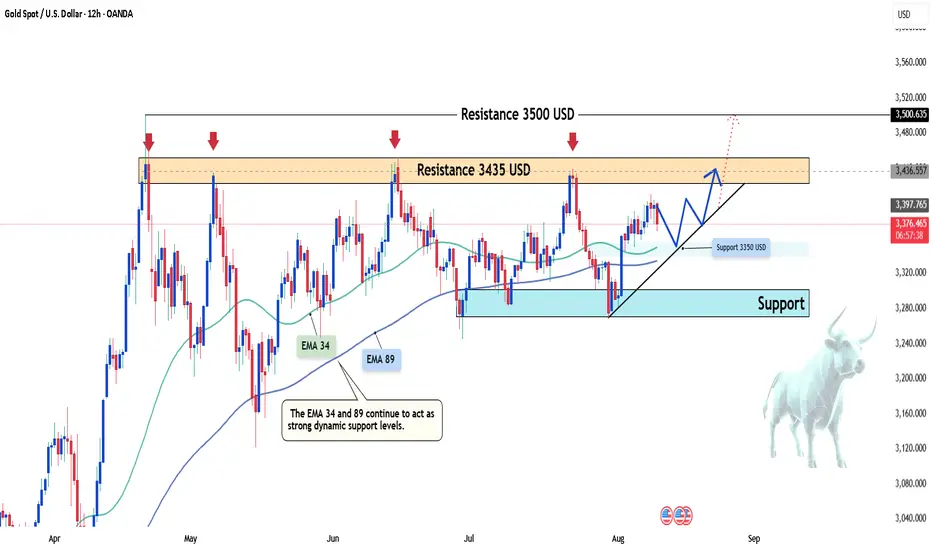
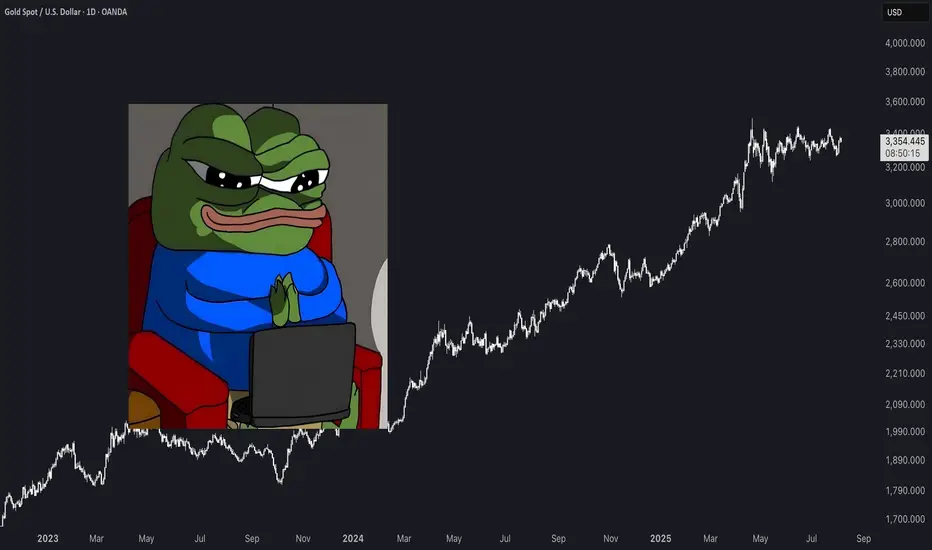
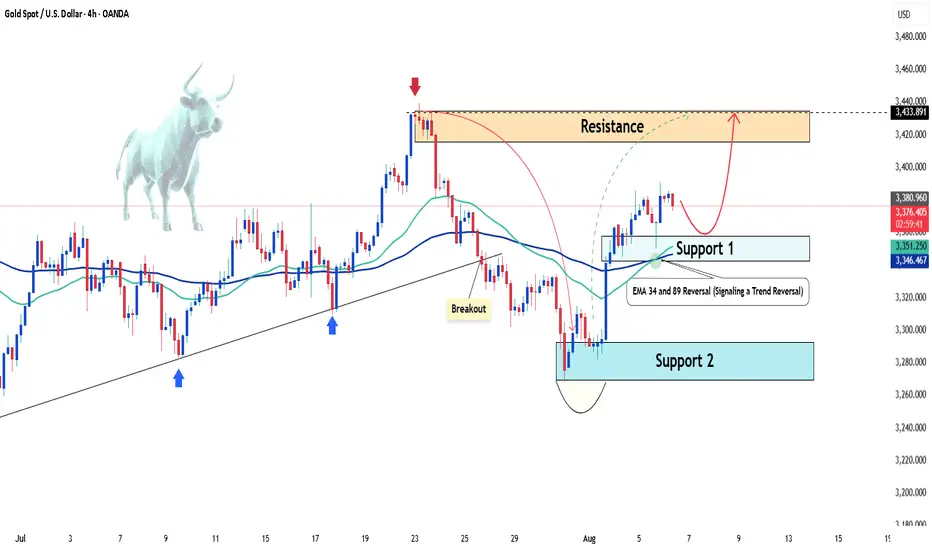
Gold Set to Reach Historic HighsHello everyone, great to see you again!
Gold has been on a strong upward trajectory, breaking previous bearish structures and showing solid growth momentum. Market sentiment is heavily supported by the weakening of global currencies, particularly the US dollar, and expectations surrounding the potential interest rate cuts by the Federal Reserve.
Looking at the technical picture, we are approaching the historic peak of $3,433. The gold market is showing significant strength, confirmed by EMA 34 and EMA 89, as well as new support zones, signaling a trend reversal and confirming the bullish outlook.
The next few trading sessions could play a critical role in confirming whether the precious metal can break the all-time highs.
What do you think? Is gold about to make history? Let me know in the comments below!
GOLD DUMPS $50 – LIQUIDITY ZONE AHEAD | CPI IN FOCUS! GOLD DUMPS $50 – LIQUIDITY ZONE AHEAD | CPI IN FOCUS!
📌 MARKET RECAP
Gold kicked off the week with a sharp $50 drop, breaking multiple key trendlines and nearby support levels in quick succession.
Main drivers behind the move:
Profit-taking after the recent strong rally.
Stronger USD expectations ahead of CPI data (forecast +0.1% vs previous).
Geopolitical factors – Ukraine–Russia ceasefire talks approaching their conclusion, adding to risk-off sentiment.
🧐 WHAT’S NEXT?
If CPI comes in strong → USD strengthens → Gold could slide further into the 333x – 330x liquidity zone.
If CPI disappoints → USD weakens → Gold may quickly bounce back toward the 337x key level (previous breakdown area) for a retest before deciding direction.
🎯 MMFLOW GAME PLAN
1️⃣ BUY SCALP
📌 Entry: 3331 – 3329
📌 SL: 3325
📌 TP: 3335 – 3340 – 3345 – 3350 – 3360 – 3370 – 3380
2️⃣ BUY ZONE
📌 Entry: 3310 – 3308
📌 SL: 3304
📌 TP: 3314 – 3318 – 3322 – 3326 – 3330 – 3335 – 3340 – 3350 – 3360 – ???
3️⃣ SELL SCALP
📌 Entry: 3363 – 3365
📌 SL: 3370
📌 TP: 3360 – 3356 – 3352 – 3348 – 3344 – 3340
4️⃣ SELL ZONE
📌 Entry: 3376 – 3378
📌 SL: 3382
📌 TP: 3372 – 3368 – 3364 – 3360 – 3355 – 3350 – 3340
⚠️ RISK NOTE
CPI is a potential game-changer – even a small deviation from forecasts can trigger a massive one-way move.
Always keep an eye on AD-marked Key Levels on the chart before pulling the trigger.
