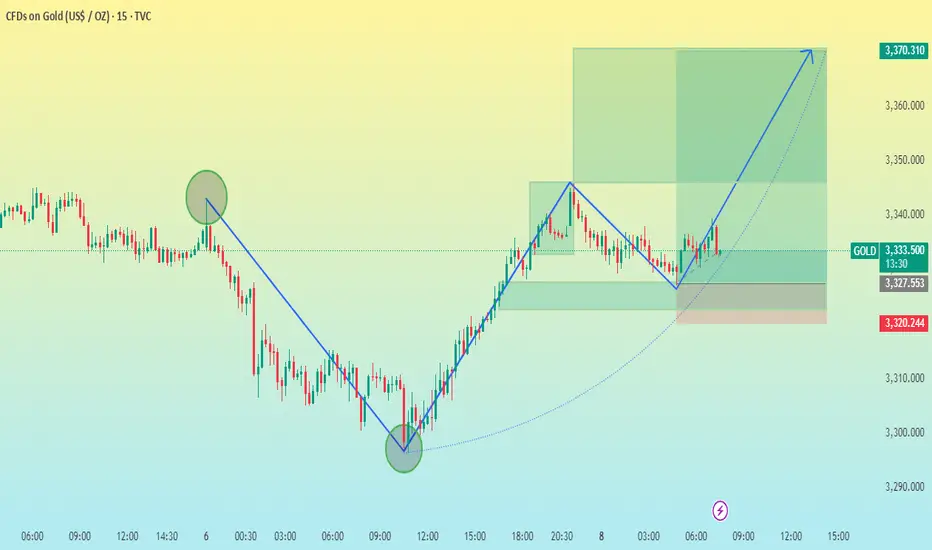
XAU/USD 15M CHART PATTERNHere's a structured summary of your XAUUSD (Gold/USD) trade setup:
---
📈 Trade Setup: BUY XAUUSD
Entry: 3333
Stop Loss: 3320 (13 pips below entry)
---
🎯 Take Profit Levels:
1. TP1: 3340 (7 pips gain)
2. TP2: 3350 (17 pips gain)
3. TP3: 3370 (37 pips gain)
---
⚖ Risk/Reward Ratios (Approx):
TP1: ~0.54 : 1
TP2: ~1.31 : 1
TP3: ~2.85 : 1
---
✅ Comments:
You’re targeting scaling out profits as the price climbs, which is a sound risk management approach.
Stop loss is tight, so you may get stopped out easily on volatility unless you're trading with confirmation (e.g., bounce from support or bullish candlestick setup).
Consider monitoring macroeconomic events or news that could affect gold prices (like CPI, NFP, Fed speeches).
Would you like help with setting this up in a trading platform or calculating position size based on your risk?
XAUUSD trade ideas
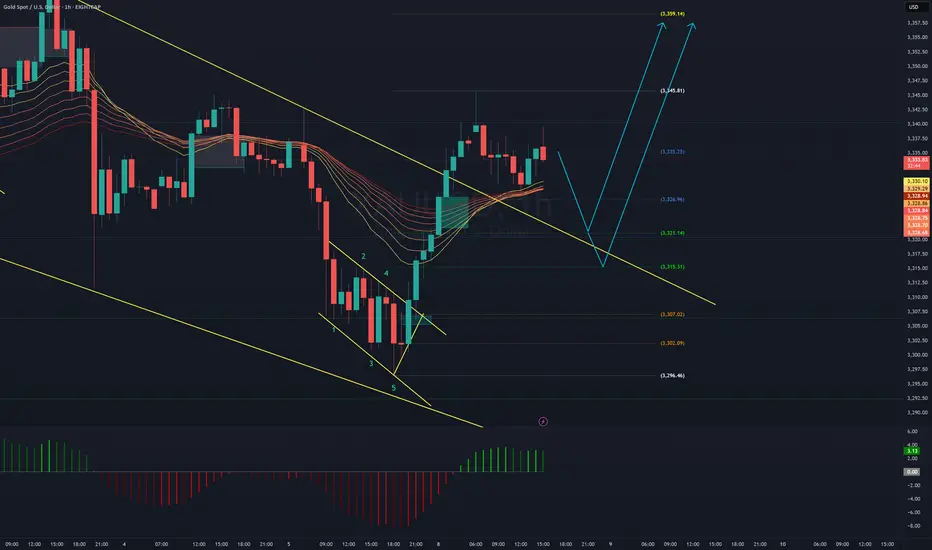
GOLD SETUP UPDATE - CLEAN BREAKOUT & RETEST PLANGold just broke out of a falling wedge pattern with a clean 5-wave completion.
Now it's pulling back — we prepare for two potential scenarios:
🔹 Scenario A:
If price retests the lower trendline (around 3,315–3,320) and gives a strong rejection, we look to buy targeting:
→ 3,345
→ 3,359
🔹 Scenario B:
If it skips the retest and continues to rally — we follow the breakout momentum.
✅ EMA ribbons are still holding bullish.
✅ MACD histogram flipped green — showing buyer pressure coming in.
🚫 Invalid if price breaks below 3,307 or 3,296.
Time to cut and reassess if that happens.
💡 Reminder: Wait for confirmation. Don’t FOMO.
Plan your trade — ride the structure, not the hype.
#GoldAnalysis #TechnicalSetup #ForexTrading #PriceAction #FaizIsmail
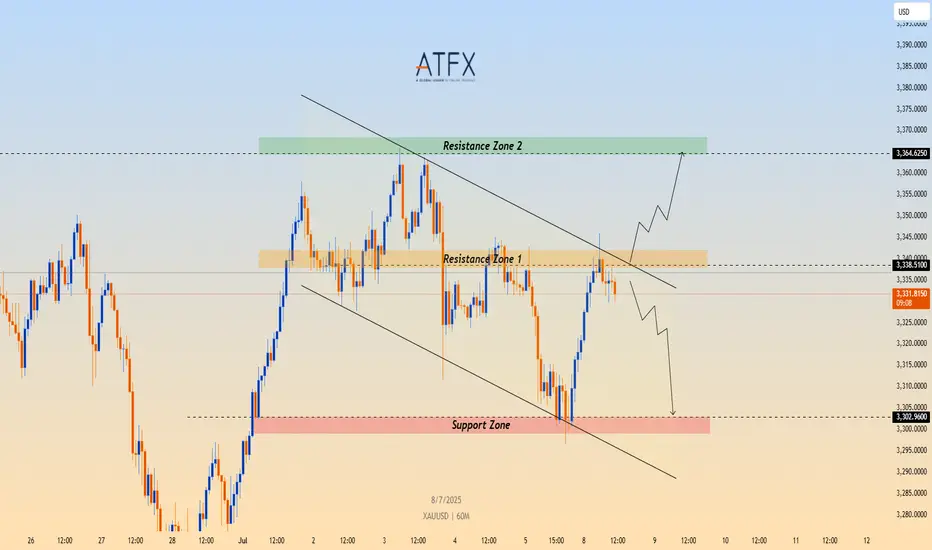
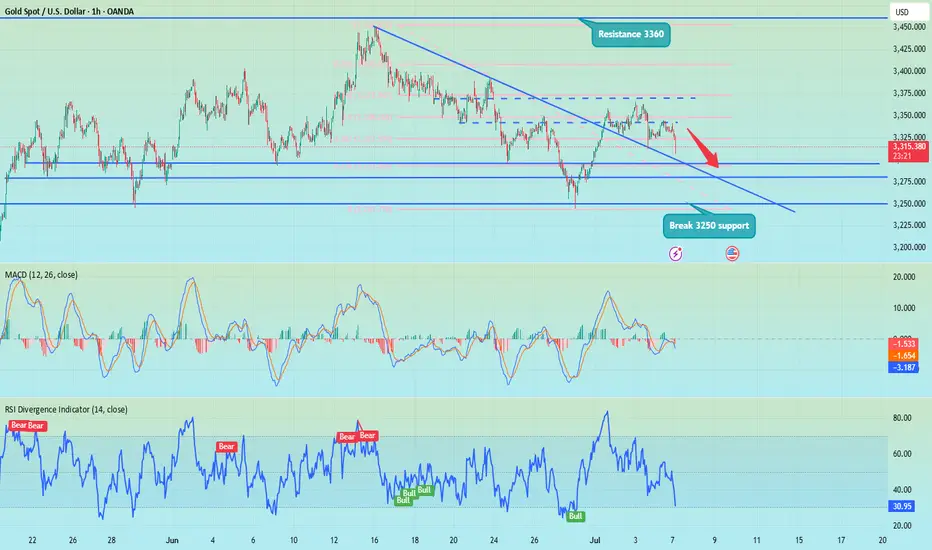
XAU/USD Eyes Key Resistance Amid Fresh Tariff Fears🟡 TVC:GOLD Gold Price Forecast: XAU/USD Eyes Key Resistance Amid Fresh Tariff Fears
OANDA:XAUUSD Spot gold (XAU/USD) is recovering from intraday lows near $3,296, now trading around $3,330 as fears over renewed U.S. tariffs fuel safe-haven demand. President Trump has begun issuing formal letters announcing fresh import tariffs—25% on South Korea, additional measures on Japan, and a 10% universal tariff on countries aligning with BRICS. With the 90-day tariff pause expiring August 1 and no trade progress in sight, geopolitical and economic uncertainty continue to support gold’s floor.
📉 Technical Structure
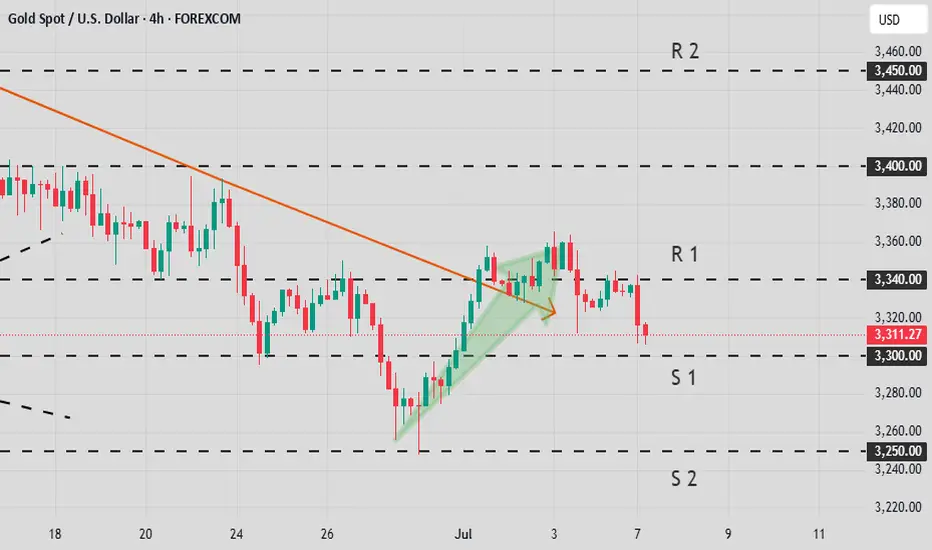
XAU/USD remains within a descending channel on the 1H chart, with price currently approaching the $3,338–$3,340 Resistance Zone 1. A clean breakout above the upper channel boundary could trigger a move toward the broader $3,364 Resistance Zone 2. Conversely, failure to break above Resistance Zone 1 would keep the bearish channel intact, with downside targets toward the $3,302–$3,305 support zone.
📌 Key Technical Zones
Resistance Zone 1: $3,338–$3,340
Resistance Zone 2: $3,364
Support Zone: $3,302–$3,305
Channel Structure: Bearish unless broken to the upside
📘 Strategy Summary
XAU/USD is showing signs of short-term recovery, but remains technically capped unless it breaks through $3,340 resistance. As long as the descending channel holds, rallies may be sold into. A confirmed break above $3,340 could shift bias toward $3,364, while rejection may reopen the path to $3,305 and potentially lower.
⚠️ Disclaimer
This analysis is for informational purposes only and does not constitute investment advice. Please consult a licensed financial advisor before making trading decisions.

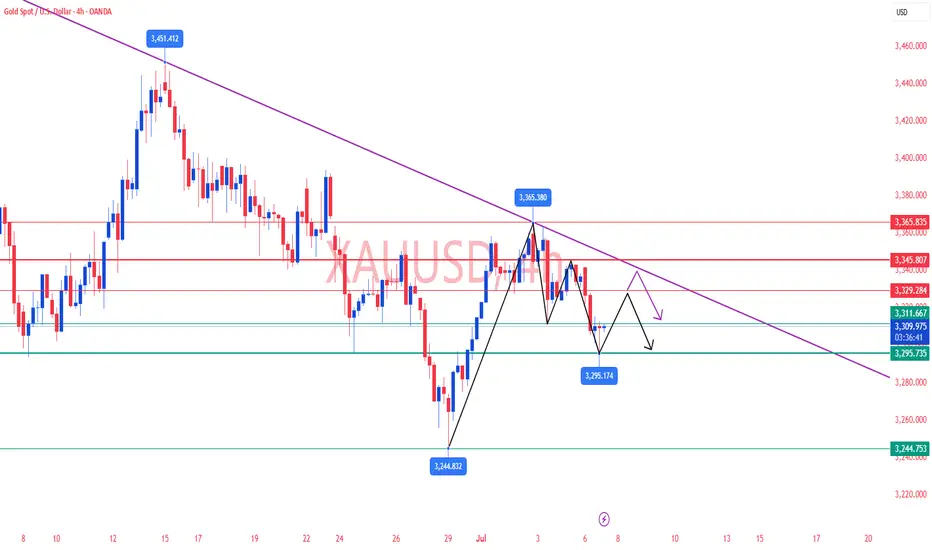
Gold Analysis and Trading Strategy | July 7✅Gold opened weakly during the Asian session today, with prices dropping nearly $40 in early trading—likely due to technical selling pressure from above. The rebound once again failed to break the key 3345 resistance level, which serves as the neckline of the previous “M-top” pattern formed at the 3365 high. This level has become a clear resistance zone. If gold continues to struggle below this line, the short-term trend remains biased toward consolidation with a bearish tone.
✅ 4-Hour Chart Structure:
Since retreating from the 3365 high, multiple rebound attempts have been capped around the 3345 area. Last Friday, a second rally failed at the mid-Bollinger Band and closed lower, forming a local double-top pattern. This morning’s rebound to 3342 was again rejected, confirming continued downward pressure in this area.
✅ 1-Hour Chart Structure:
After the release of last week's non-farm payrolls data, gold formed a short-term double top. After breaking the neckline, the rebound lacked momentum, reaffirming that sellers dominate near resistance. In the short term, bearish pressure remains in control.
✅ Key Technical Levels:
🔴Short-term Resistance: 3325–3330
🔴Major Resistance Zone: 3345 (M-top neckline)
🔴Strong Resistance: 3365 (M-top peak)
🟢Short-term Support: 3305
🟢Critical Support: 3295
🟢A break below 3295 could open further downside toward 3275 or even 3246
✅Intraday Trading Strategy:
🔻 Short Position Strategy:
Consider layering into short positions around the 3325–3330 area. Stop-loss: 8–10 $
Targets: 3310–3300; if 3300 breaks, watch for a move toward 3295
🔺 Long Position Strategy:
If price pulls back and stabilizes around 3295–3298, consider layering into long positions. Stop-loss: 8–10 $
Targets: 3305–3315; if 3315 breaks, look for a move toward 3325
✅Strategy Summary & Outlook:
Gold remains in a broad high-level consolidation phase, with frequent short-term shifts between bullish and bearish sentiment. We recommend a range-trading approach—selling on rallies and buying on dips—while closely monitoring whether the 3345–3350 resistance zone is breached. This key area will likely determine the directional breakout this week.
✅Maintain disciplined risk management, avoid chasing moves, and stay alert to intraday momentum shifts.
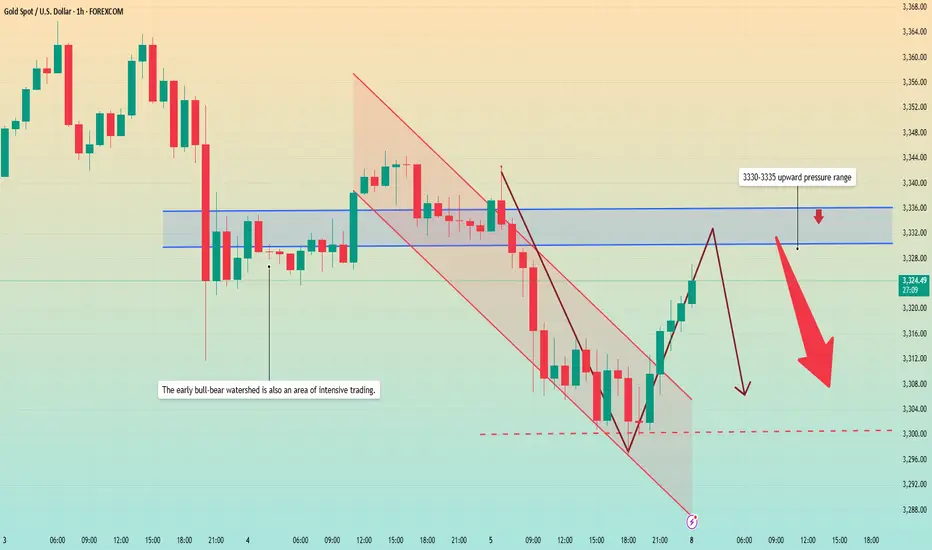
Gold rebounded from the bottom. Is the decline over?Gold prices faced selling pressure in today's Asian market. The price fell from 3343 to around 3320 in the early Asian session. The European price continued to fall, reaching a low of around 3296, and then rebounded upward. The current price is fluctuating around 3320.
Most investors will focus on the minutes of the Federal Open Market Committee (FOMC) meeting to be released on Wednesday to get guidance on the trend.
From the hourly chart, the upper pressure position is constantly being corrected. The current average pressure value is around 3330-3335. At the same time, this position is also the watershed between long and short positions in the previous dense area. The price may rebound to this position again. The lower support level is in the range of 3300-3290.
Quaid believes that the current market is still showing a downward trend, and the price may fall back below 3300 again.
Operation strategy:
Short around 3330, stop loss 3340, profit range 3310-3300, sustainable ownership after breakthrough.
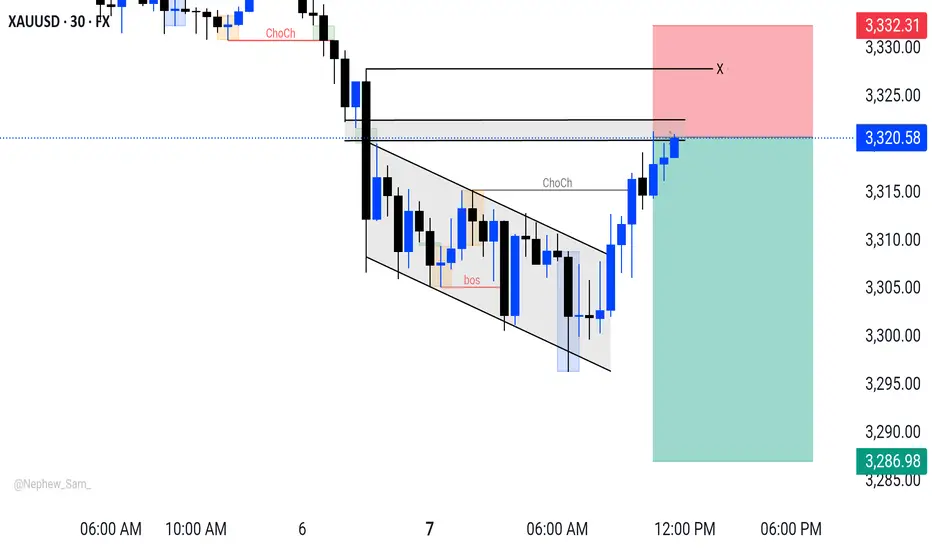
XAUUSD Sell Setup 30MGold (XAUUSD) looks bearish on 30M timeframe.
🔽 Entry: 3320
🎯 Target 1: 3303
🎯 Target 2: 3286
🛑 Stoploss: 3332
Bias: Selling below 3320 with tight risk.
Trade safe — not financial advice.
Gold short-term shock operation ideas
💡Message Strategy
Current Price and Context
Gold is trading around $3,310 and continues to retreat as traders remain cautious amid heightened macroeconomic uncertainty. While some safe-haven demand remains, a stronger dollar and weakening confidence among safe-haven buyers put gold under selling pressure. Concerns about global trade policy and tightening monetary policy continue to weigh on gold's short-term outlook.
Key Drivers
Geopolitical Risks: Trade tensions and global uncertainty have again sparked cautious sentiment, which has provided limited support for gold, but the absence of major conflicts has left it lacking direction.
U.S. Economic Data: Strong labor market data and upcoming inflation data supported the dollar, curbing gold's upward momentum.
FOMC Outcomes: The Fed remains cautious and does not signal an immediate rate cut; high yields reduce the appeal of non-interest-bearing assets such as gold.
Trade Policy: While tariffs have been a concern, flows between risk and safe-haven assets have been mixed as there has been no new escalation.
Monetary policy: Rising global bond yields and the Federal Reserve's wait-and-see attitude limit gold's gains in the short term.
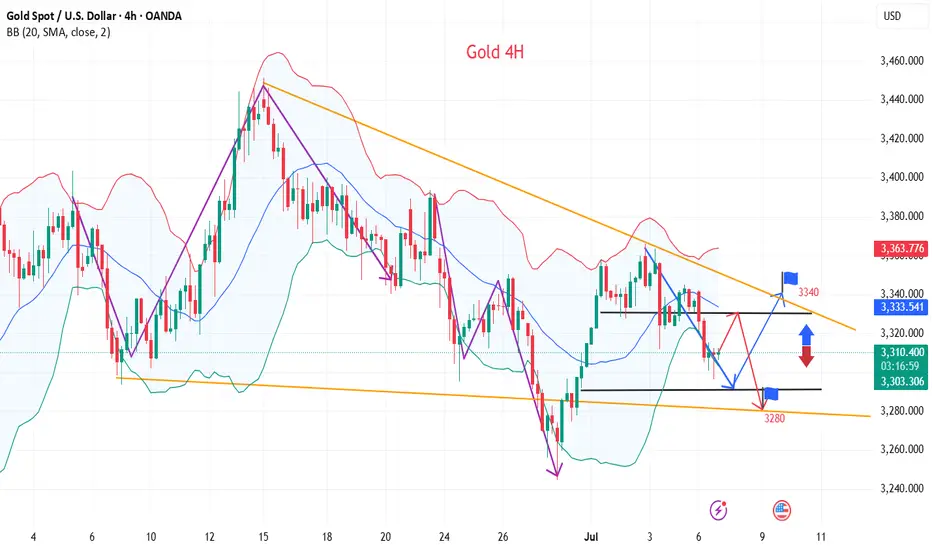
📊Technical aspects
From the 4-hour analysis, the support line of 3290-3300 is concerned below, the short-term resistance above is concerned about 3315, and the suppression line of 3345-50 is focused on. The overall main tone of high-altitude low-multiple cycle participation remains unchanged. In the middle position, watch more and do less, and follow orders cautiously, and maintain the main tone of participation in the trend. Wait patiently for key points to participate. Pay attention to the specific operation strategy in time.
💰Strategy Package
Long Position:3290-3300,SL:3275,Target: 3330-3340
Short Position:3320-3330,SL:3305,Target: 3280-3290
New tariffs are coming. How should gold respond?📰 News information:
1. 90-day tariffs are about to expire
2. New unilateral tariffs
3. Geopolitical situation
📈 Technical Analysis:
On July 4th local time, there were constant turmoil in American politics and trade. Trump declared that the US government would send letters to trading partners that day to set new unilateral tariff rates, which would most likely take effect on August 1. He also revealed that the new tariff rates could soar to 70%. At the same time, Japan-US trade negotiations encountered obstacles, India planned to impose retaliatory tariffs on the United States, and the China-EU tariff war had also begun. At present, the news seems to be more favorable to the bulls.
From a technical point of view, gold closed higher last week, showing that there is still upward momentum this week. In the short term, we need to pay attention to the pressure in the 3365 and 3375 - 3380 areas, and the 3400 mark is a key position where bulls and bears are fighting fiercely. Before breaking through this position, we must be alert to the risk of falling back after a high rise. Pay attention to the support of 3310-3305 and 3295-3285 below. If effective support is obtained, we can consider going long. If it breaks, it may go to 3270-3260. Gold jumped to 3342 at the opening of the Asian session and then fell back. 3345 is the key in the short term. The news may affect its subsequent trend. In the short term, pay attention to the suppression of 3345 on the upper side, and further to the strong resistance area of 3365-3380. If there is resistance and pressure, you can short at a high level. The impact of recent news is erratic, so enter the market with caution and be sure to set TP and SL strictly.
🎯 Trading Points:
SELL 3330-3345
TP 3320-3310-3295
BUY 3310-3305
TP 3320-3330-3345
In addition to investment, life also includes poetry, distant places, and Allen. Facing the market is actually facing yourself, correcting your shortcomings, confronting your mistakes, and strictly disciplining yourself. I hope my analysis can help you🌐.
TVC:GOLD OANDA:XAUUSD FX:XAUUSD FOREXCOM:XAUUSD PEPPERSTONE:XAUUSD FXOPEN:XAUUSD
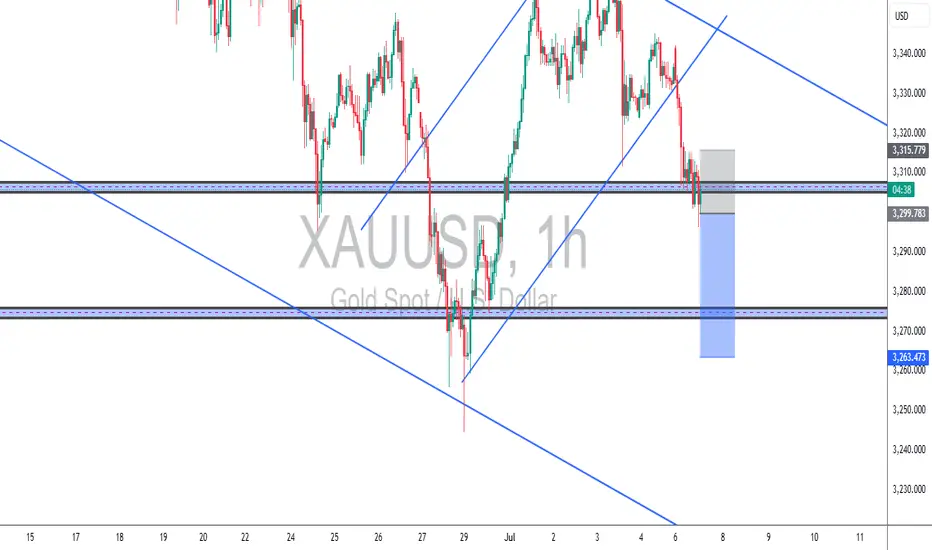
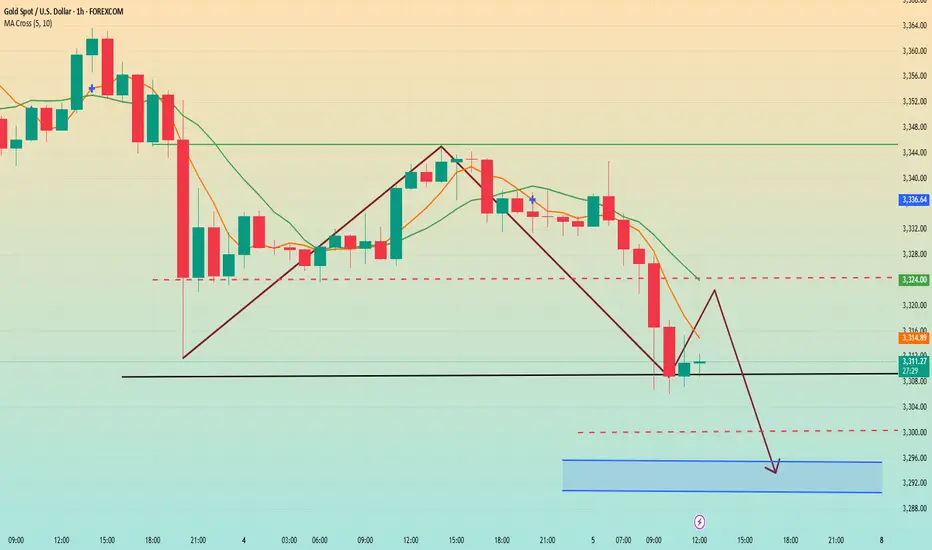
XAUUSD – Bearish Breakout Retest (TCB Strategy)🔍 Technical Overview:
Trend: Price has clearly broken below the rising channel.
Retest Zone: The grey box shows a bearish retest zone at 3,315–3,310, which price tapped before rejecting.
Current Support: Price is reacting at the 3,300 horizontal level (former demand zone).
Target Area: The blue box points to a possible TP zone around 3,263, aligned with previous structure support.
🔻 XAUUSD – Bearish Breakout Retest (TCB Strategy)
📅 Date: July 7, 2025
🕐 Timeframe: 1H
✅ Checklist Score: 95%
🔍 TCB Setup Breakdown:
Price broke below a rising channel and pulled back into a clean supply zone (3,310–3,315). NY session provided a strong rejection, aligning with structure shift and confirming short bias.
🎯 Entry: 3,310.00
🛑 Stop Loss: 3,316.50
🎯 Target: 3,263.47
📈 R-Multiple: Targeting ~+2.5R
🧠 Strategy: Trend → Countertrend → Breakout
📛 #TCBFlow #XAUUSD #GoldAnalysis #SmartMoneyConcepts #BreakoutRetest #TradingViewIdeas #GoldTrading #PriceAction #MarketStructure #NYSession #ForexStrategy #RiskReward #TrendlineBreak #SupplyDemand
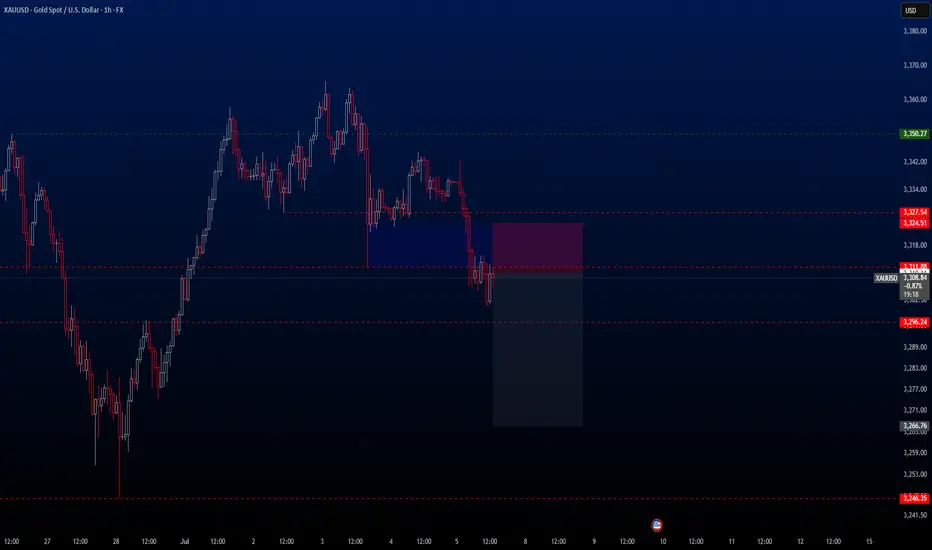
XAUUSDHello traders,
The Gold trade I shared last week has just hit TP. Based on current market conditions, I believe gold may continue its downward movement for a while. Therefore, I’m still holding a bearish bias and have just activated a new sell trade, which I’d like to share with you as well.
🔍 Trade Details
✔️ Timeframe: 1-Hour (H1)
✔️ Risk-to-Reward Ratio: 1:3
✔️ Trade Direction: Sell
✔️ Entry Price: 3310.11
✔️ Take Profit: 3266.76
✔️ Stop Loss: 3324.51
🔔 Disclaimer: This is not financial advice. I’m simply sharing a trade I’ve taken based on my personal trading system, strictly for educational and illustrative purposes.
📌 Interested in a systematic, data-driven trading approach?
💡 Follow the page and turn on notifications to stay updated on future trade setups and advanced market insights.
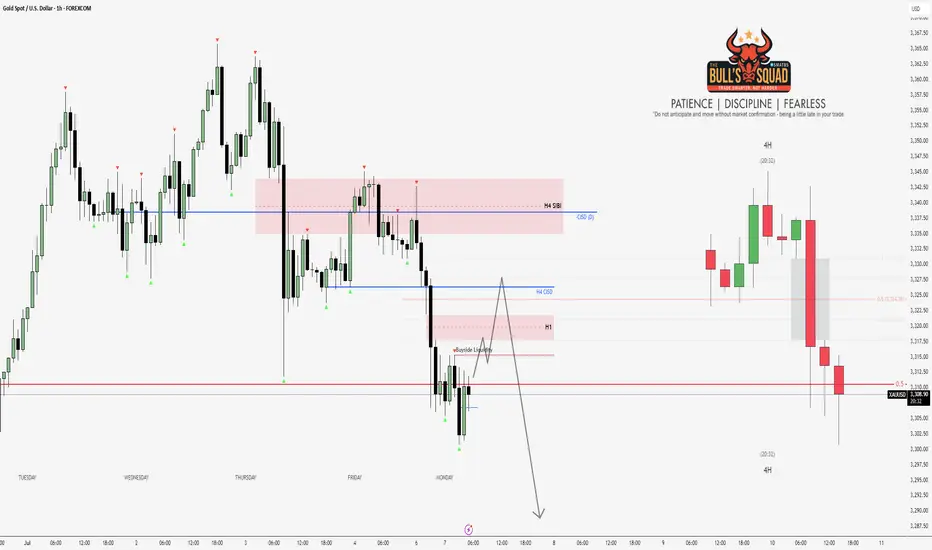
Technically is Bearish the chart that I shared on Sunday that prediction was according to fundamentals but now technically we are bearish ... if the until TRUMP announce the terriff may be in NY open... so our PRICE ACTION is right now bearish that sunday's chart is invalid for now
XAU/USD: Today's Strategy AnalysisVerification of Support Level Effectiveness
- $3306: As the 0.5 retracement level of the 3247-3365 band Fibonacci, it rebounded slightly after being first touched today. It is necessary to monitor whether a bullish candlestick stabilization signal forms at this level. If broken, the next target is $3290.
- $3290: Overlapping with the lower Bollinger Band support of the 4-hour chart, if a pullback signal with shrinking trading volume appears here, it can be regarded as a short-term long opportunity.
Suppression Effect of Resistance Level
- $3320-$3325: The suppression zone of the 5-day moving average at the 1-hour level, which is also near the early session rebound high. If the price is resisted and closes bearish when rebounding to this range, it confirms a short entry opportunity.
-
Operation Tips
Strictly set stop-loss orders to avoid capital drawdown caused by false breakouts of support/resistance levels.
XAUUSD
buy@3285-3295
tp:3310-3320
sell@3315-3325
tp:3305-3295
I am committed to sharing trading signals every day. Among them, real-time signals will be flexibly pushed according to market dynamics. All the signals sent out last week accurately matched the market trends, helping numerous traders achieve substantial profits. Regardless of your previous investment performance, I believe that with the support of my professional strategies and timely signals, I will surely be able to assist you in breaking through investment bottlenecks and achieving new breakthroughs in the trading field.
The bill was introduced; the price did not rise but fell.Due to the implementation of the US bill, most traders in the market are bullish on gold and believe that gold will soar on Monday. As a result, it jumped up and fell sharply this morning. This is the uncertainty of the market. Although the short position given near 3340 last Friday was late, it fell to the low point of 3306 at the opening of the Asian market today.
In addition, the key to this sharp drop is the high point before the rebound, that is, the starting point or the position of the top and bottom conversion. Once it is broken, you have to change your mindset. The volatile market is like this, just get used to it. The turmoil caused by Trump's bill will not appear for a while. It takes a process and cannot be unilaterally considered as bullish or bearish.
In the early Asian market, the price fell all the way from 3342 US dollars to 3306. How to judge the end of the decline? It is to stare at the high point of the rebound before the last decline of 3320 US dollars. The loss of 3300 US dollars in the early trading indicates that the gap-up opening is a lure for more.
Today, I think that 3325 above 3320 can be used as the dividing point between long and short positions. You can short with a light position near 3315, and pay attention to the 3295-3290 line below. After the upward breakthrough is confirmed, consider adjusting the position and making other arrangements. For the time being, we will look at the weak adjustment during the day.
Gold showing early sign of Consolidation?
Gold not respecting both Bullish and Bearish FVG (PD arrays). Both Bearish and Bullish Rejection taken out (ranging between 3300-70). Wait before execution price action to be clear .
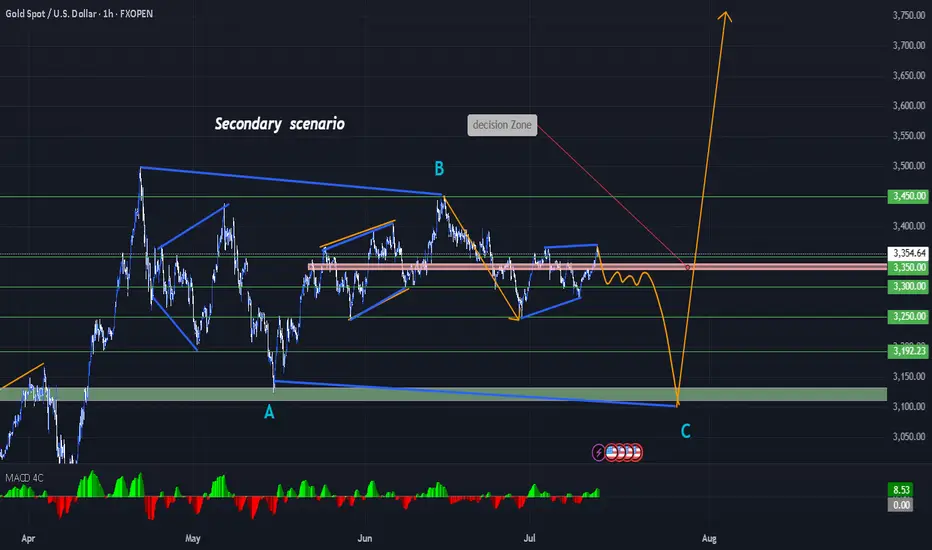
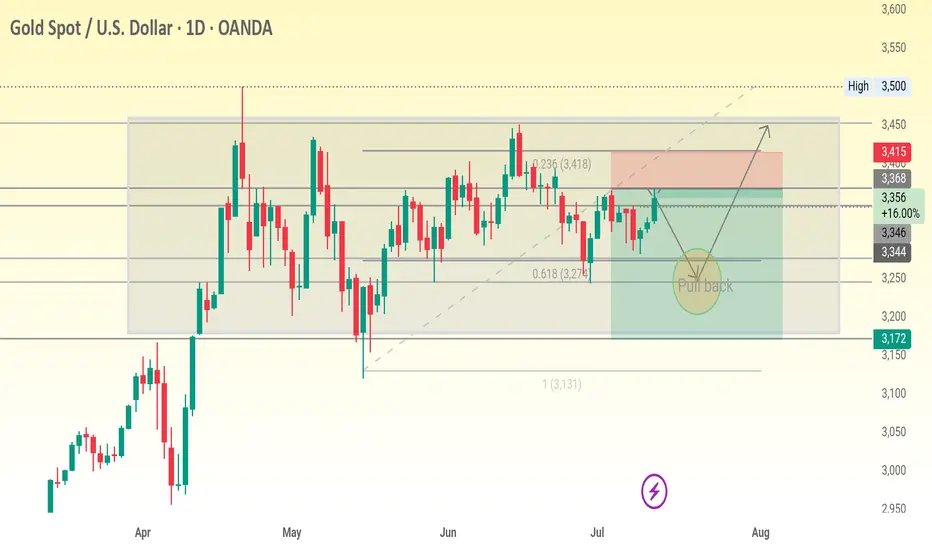
my second imagination about the future of the XAUUSDI'm sharing with you my trading opinion with the improved Elliott Wave. If the market enters the zone, it's likely to reach the zone.
If not, the second scenario will be respected. I'd like to have your opinion.
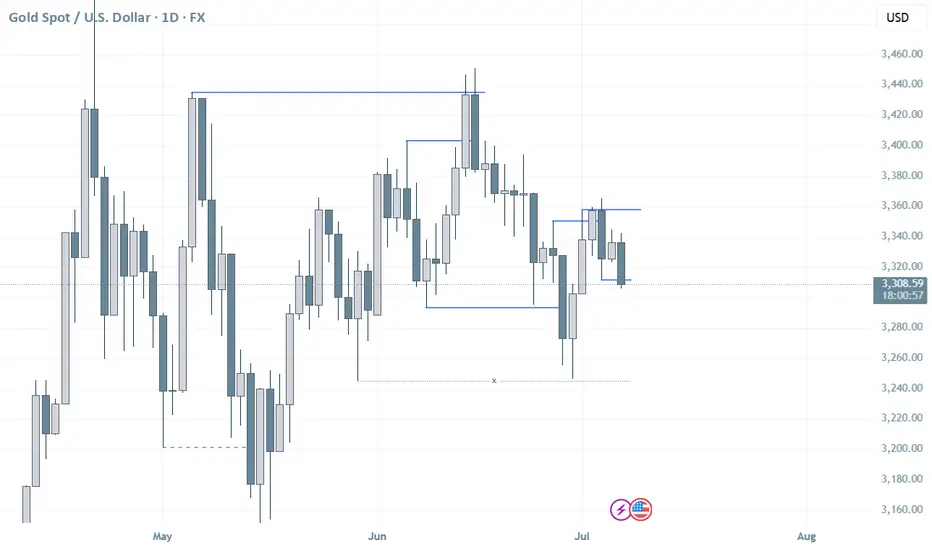
1D, chart analysis.
Drawn from the major swing low ($3,500):
0.236 Level = $3,418 → minor resistance
0.618 Level = $3,274 → critical retracement (gold bounced near this)
1.000 Level = $3,131 → absolute support
These levels suggest the retracement may be over, and price could be prepping for a new push.
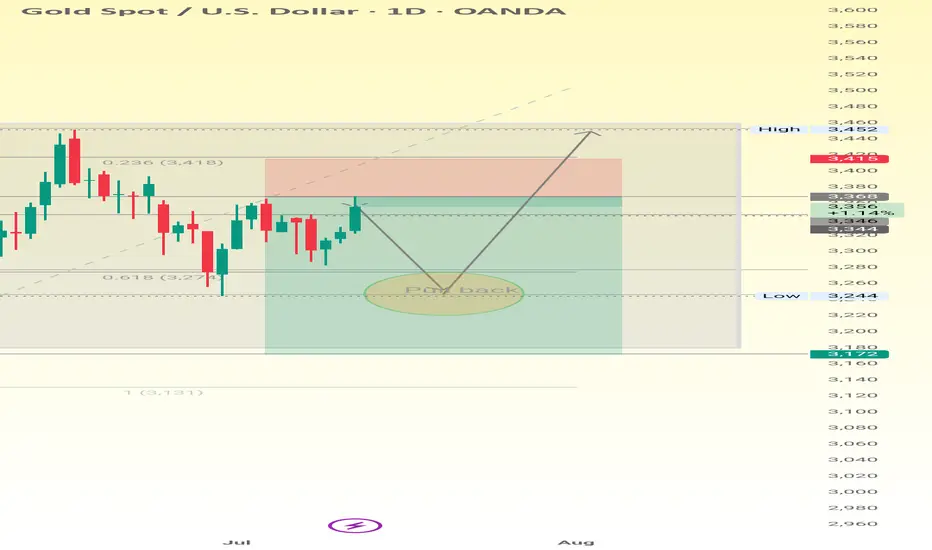
D1, chart analysis.
Gold is currently ranging within a horizontal consolidation zone.
The price is oscillating between the support at ~$3,172–$3,344 and resistance at ~$3,415–$3,500.
A pullback zone is identified near $3,344–$3,346, aligning with prior minor structure and the Fibonacci 0.618 level.
These levels suggest the retracement may be over, and price could be prepping for a new push.
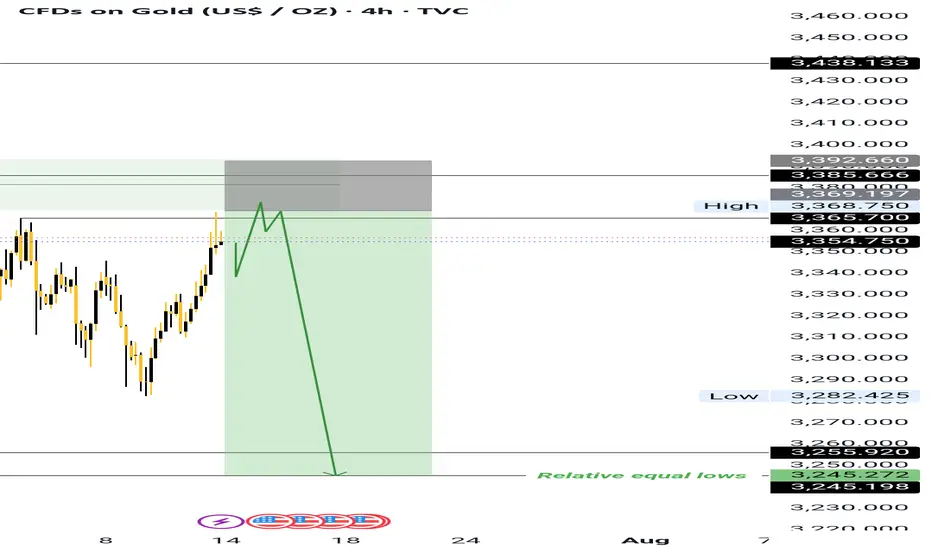
Sell long!!!!!I'm looking at a long term sell in respect of the 4hr order, If gold has to tap in into it. It will definitely reach the relatively equal lows.
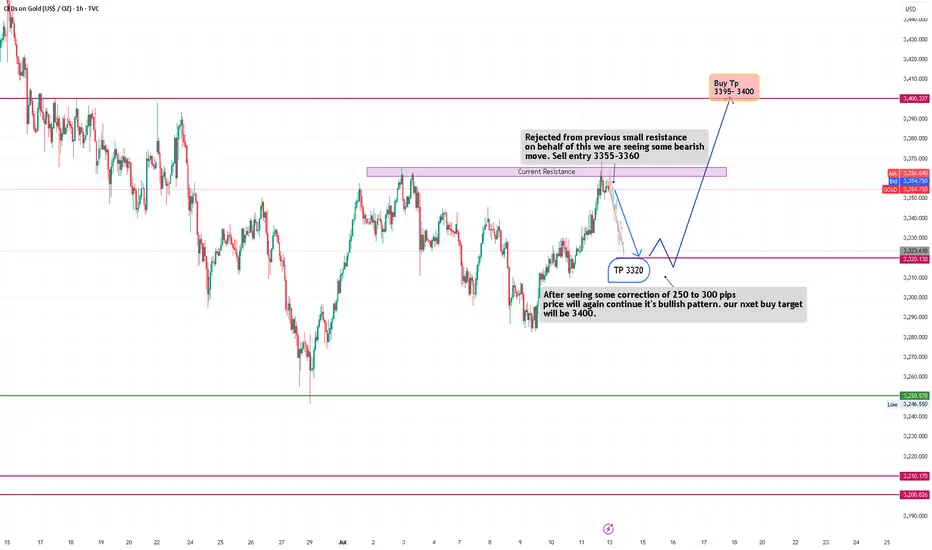
XAUUSD trade idea🟣 Current Market Behavior
Price has reached a resistance zone around 3355–3360, previously respected as a supply area.
A rejection candle or price weakness at this level is triggering a short-term bearish outlook.
🔻 Short-Term Bearish Plan
Sell entry zone: 3355–3360
> Target for this sell (TP): 3320
➤ This suggests a possible drop of around 250–300 pips from the current high.
> Reason: The price is expected to make a technical correction after hitting a resistance level.
🔼 Mid-Term Bullish Plan
: After reaching the 3320 support area, the chart expects a bullish reversal or continuation of the uptrend.
> Buy setup target: 3395–3400
➤ This level represents the next potential bullish wave after the correction.
> Reason: The overall pattern remains bullish. The idea assumes this drop is temporary and part of a healthy pullback before the uptrend resumes.
📝 Summary:
Phase 1: Sell from 3355–3360 to 3320 (correction phase)
Phase 2: Buy from 3320 toward 3395–3400 (bullish continuation)
Strategy combines resistance rejection + correction + trend continuation principles.
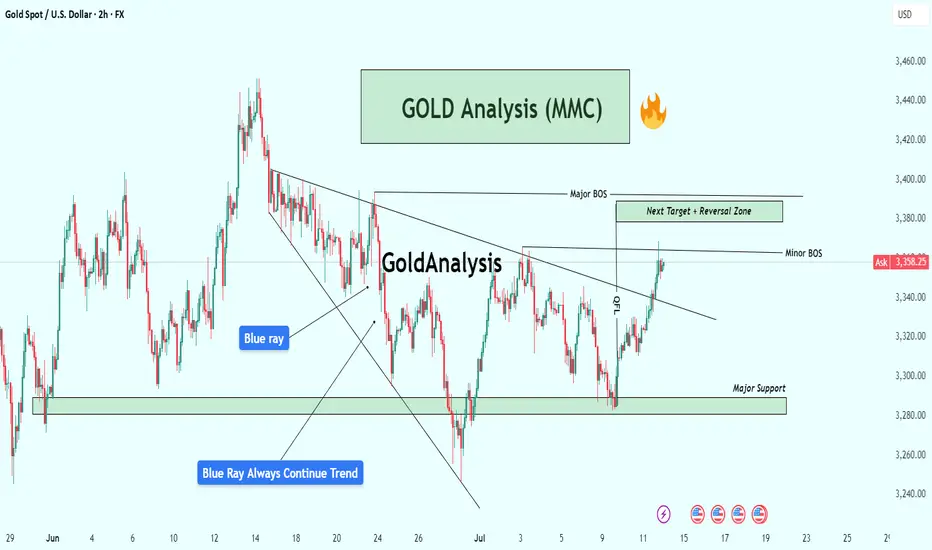
XAUUSD Analysis : Bullish Move Toward Key Resistance + Target🟩 Overview:
Gold is currently showing a clear bullish breakout on the 2-hour timeframe. The market structure has shifted from a downtrend into a bullish phase, with price now approaching a critical Reversal Zone. Let’s break down the key levels, structure shifts, and potential trade opportunities.
🔍 1. Structure Shift – Trendline Break & BOS Signals:
The price previously followed a Blue Ray Descending Trendline, which acted as dynamic resistance and guided the bearish trend.
As highlighted, “Blue Ray Always Continue Trend” – but in this case, we’ve seen a clean Break of Structure (BOS) that invalidated the bearish setup.
A Minor BOS occurred first, which hinted at weakening selling pressure.
Later, a Major BOS confirmed the bullish transition as the price broke above a key resistance level with strong momentum.
This transition was supported by consistent higher lows and a breakout above the descending resistance trendline — a classic reversal signal.
🟩 2. Demand Zone Reaction – Major Support Held Firm:
The Major Support Zone between $3,280 – $3,300 provided a strong base for buyers.
Multiple wick rejections and bullish engulfing patterns near this zone indicated aggressive buyer interest.
This support has now become the foundation for the recent bullish rally.
🎯 3. Next Target & Reversal Zone:
The current price is hovering around $3,358, showing strong bullish momentum.
The next major resistance area is marked between $3,380 – $3,400, identified as the Next Target + Reversal Zone.
This zone is critical — it aligns with a historical supply area and the previous market swing highs.
Traders should be cautious here, as price may react sharply. Reversal patterns (like bearish engulfing, pin bars, or double tops) could signal a potential retracement.
⚠️ 4. Trade Plan:
🟢 Bullish Bias (Short-Term):
If you entered from the support or trendline breakout, continue to hold long positions until price nears the reversal zone.
Trail stop-loss under the most recent higher low to secure profits.
🔴 Bearish Scenario (Near-Term Reversal Play):
Watch for bearish rejection patterns in the $3,380 – $3,400 zone.
If confirmation appears, potential short setups could offer a retracement back to $3,330 – $3,320.
📌 Key Levels Summary:
Major Support Zone: $3,280 – $3,300 ✅
Next Target + Reversal Zone: $3,380 – $3,400 ⚠️
Current Price: $3,358
Major BOS Level: Confirmed
Trendline: Broken with strong bullish pressure
🧠 Final Thoughts:
Gold has officially shifted gears. The bullish breakout is in motion, and the trendline break + BOS combo supports further upside — at least until the reversal zone is tested. However, this is also where the market could exhaust, making it crucial to monitor price action closely.
Stay patient, wait for confirmation, and let the levels guide your next move.
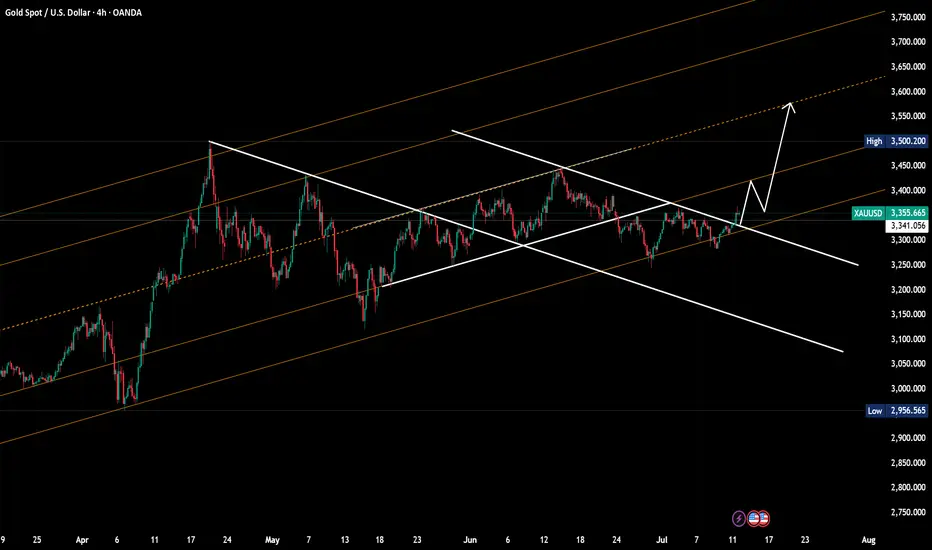
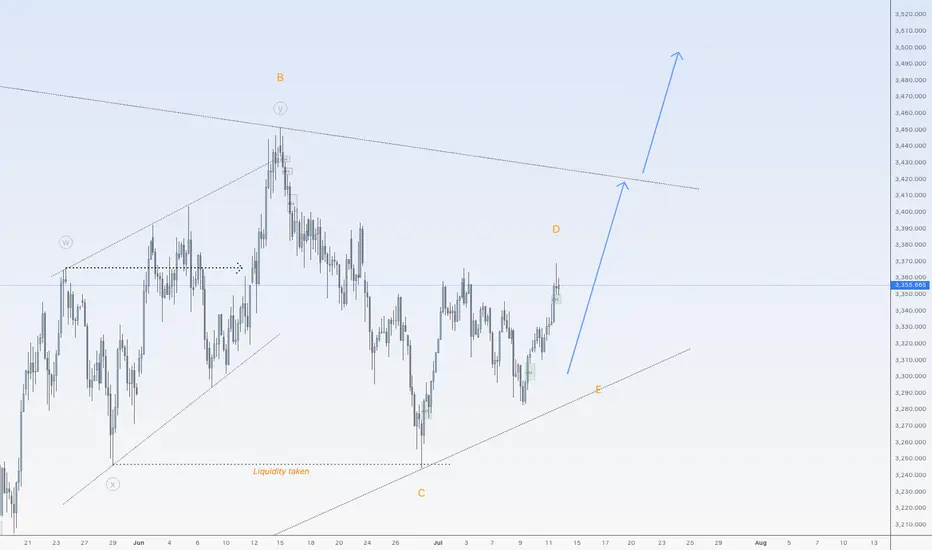
Gold is ready to go up againHi traders,
Last week gold went up again after a correction to finish (orange) Wave D just as I've said in my outlook.
Next week we could see another move down for Wave E and after that the next impulsive wave 5 up.
Or the last correction down was already wave E and gold started the next impulsive wave up.
In both cases gold will shoot up after a correction down.
Let's see what price does and react.
Trade idea: Wait for a small correction down on a lower timeframe and a change in orderflow to bullish to trade longs.
If you want to learn more about trading FVG's & liquidity sweeps with wave analysis, please make sure to follow me.
This shared post is only my point of view on what could be the next move in this pair based on my technical analysis.
Don't be emotional, just trade your plan!
Eduwave
Gold Weekly Report Conclusion: Continue to be bullishGold Weekly Report Conclusion: Continue to be bullish
I. Market Review This Week
Under pressure in the first half of the week: Affected by the strengthening of the US dollar, the gold price once fell below 3,300 points.
Rebound in the second half of the week: As the Trump administration announced new tariffs on Canada, market risk aversion increased, and the gold price rebounded to above 3,350 points and finally closed at 3,355 points.
Review of key influencing factors:
Federal Reserve policy expectations: The market still expects a possible rate cut in September, but some officials expressed hawkish views, resulting in short-term fluctuations in gold prices.
Geopolitical risks: US-Canada trade frictions and tensions in the Middle East support safe-haven demand.
Central bank gold purchases: The People's Bank of China has increased its gold holdings for eight consecutive months, and the global central bank's gold purchase trend has not changed.
II. Analysis of gold trend next week
1. Fundamental outlook
(1) Federal Reserve policy and US dollar trend
Next week, focus on the speech of Federal Reserve Chairman Powell (July 16) and US June retail sales data (July 17).
If retail data is weak, it may strengthen expectations of a rate cut in September, which is good for gold. On the contrary, if the data is strong, the US dollar may rebound, suppressing gold prices. The US dollar index (DXY) is currently around 104.5. If it falls below 104, gold may rise further. (2) Geopolitical risks: US-Canada trade friction: If the conflict escalates, safe-haven buying may continue to support gold prices. Middle East situation: Progress in Iran nuclear negotiations and Red Sea shipping safety are still potential catalysts. (3) Central bank gold purchases and institutional holdings: The global central bank's gold purchase trend has not changed. China, Poland and other countries are still increasing their holdings, which will support gold prices in the long term. ETF holdings: SPDR Gold ETF holdings increased by 5.3 tons last week, indicating that market sentiment has warmed up. Technical analysis: (1) Short-term trend (daily chart) Key support levels: 3300 (psychological support level), 3277 (trend line support level). Key resistance levels: 3373 (61.8% Fibonacci retracement level), 3400 (psychological barrier).
Moving average system: 50-day moving average (3330) provides support.
If it stands at 3350 points, it may challenge 3400 points.
MACD indicator: The fast and slow lines form a golden cross, the momentum column turns strong, and the short-term trend is bullish.
(2) Medium-term trend (weekly chart)
The rising channel is maintained, and the long-term trend is still bullish.
Key resistance: 3452 (previous high point), which may open up upward space after breaking through.
Key support: 3247 (61.8% retracement level), if it falls below, it may enter a macro adjustment.
III. Trading strategy for next week
1. Bullish scenario (breakthrough 3373 points)
Entry conditions: Stand firm at 3373 points, and the US dollar weakens.
Target: 3400→3452.
Stop loss: below 3340.
2. Bearish scenario (falling below 3300)
Entry conditions: falling below 3300 and the US dollar rebounding.
Target: 3277→3247.
Stop loss: above 3320.
3. Oscillating strategy (3300-3373 range)
Buy low and sell high, pay attention to the competition around 3350.
Conclusion
Short term (next week): Gold prices may fluctuate in the range of 3300-3373, pay attention to the speech of the Federal Reserve and retail data.
Breakout direction: If it stands at 3350, it is expected to test 3400; if it falls below 3300, it may fall to 3277.