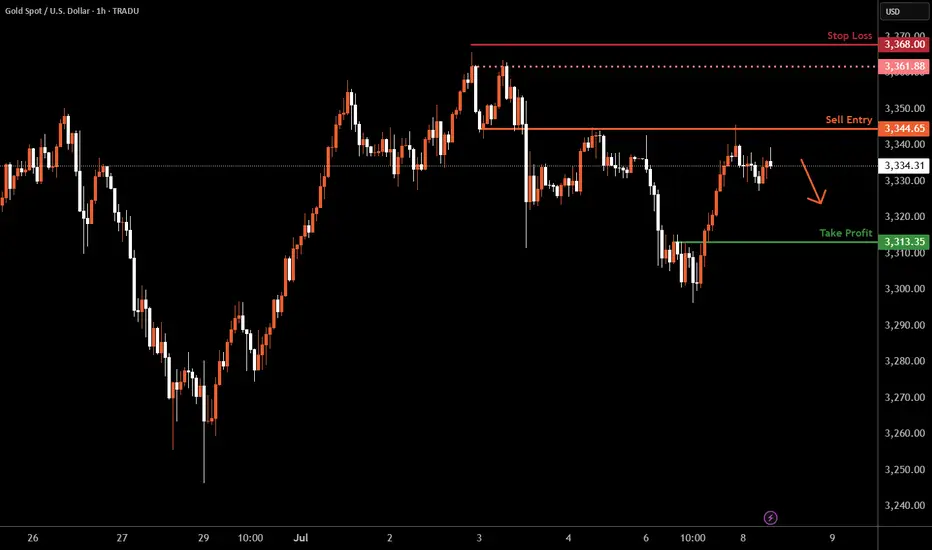
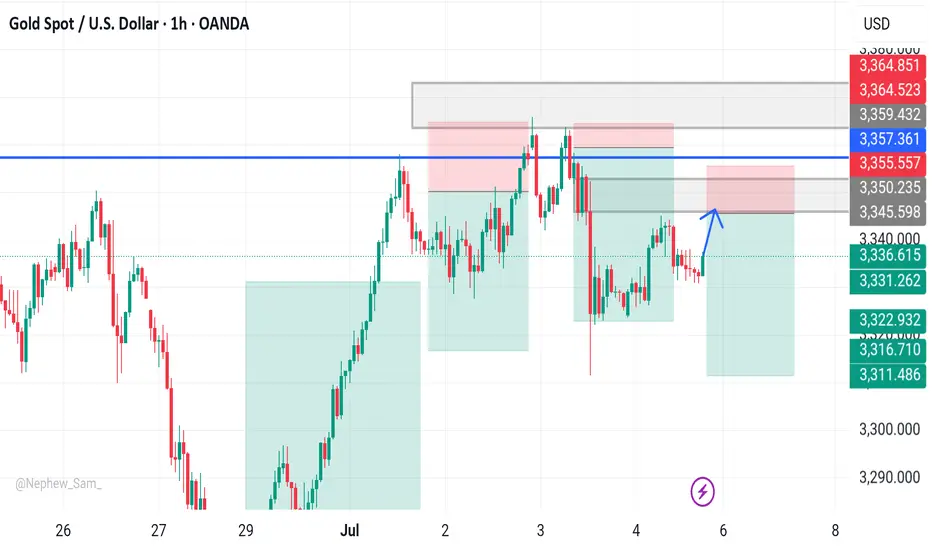
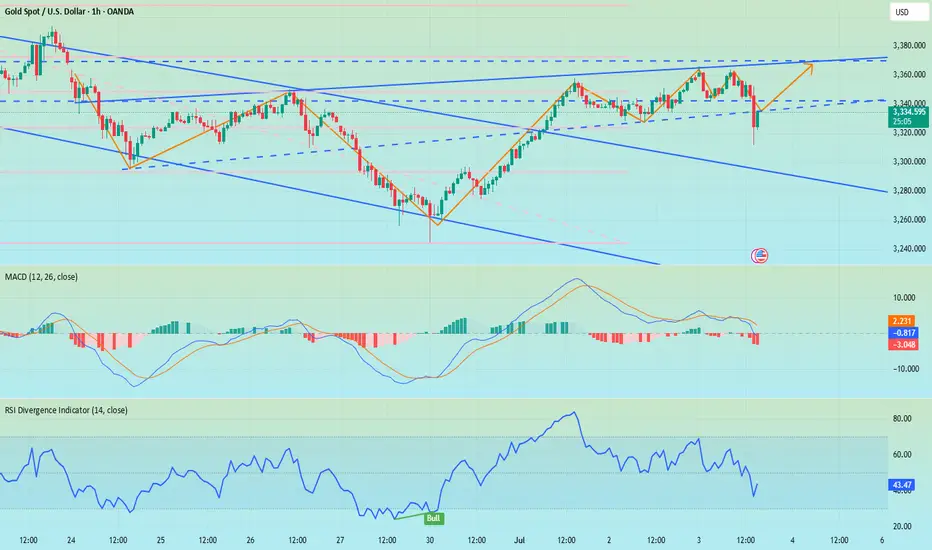
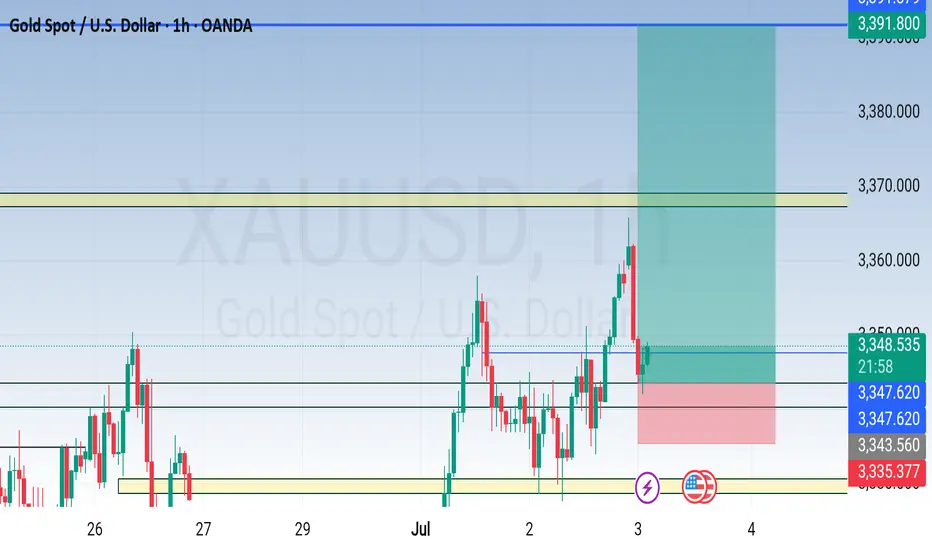
Gold H1 | Approaching an overlap resistanceGold (XAU/USD) is rising towards an overlap resistance and could potentially reverse off this level to drop lower.
Sell entry is at 3,344.65 which is an overlap resistance.
Stop loss is at 3,368.00 which is a level that sits above a swing-high resistance.
Take profit is at 3,313.35 which is a pullback support.
High Risk Investment Warning
Trading Forex/CFDs on margin carries a high level of risk and may not be suitable for all investors. Leverage can work against you.
Stratos Markets Limited (tradu.com ):
CFDs are complex instruments and come with a high risk of losing money rapidly due to leverage. 63% of retail investor accounts lose money when trading CFDs with this provider. You should consider whether you understand how CFDs work and whether you can afford to take the high risk of losing your money.
Stratos Europe Ltd (tradu.com ):
CFDs are complex instruments and come with a high risk of losing money rapidly due to leverage. 63% of retail investor accounts lose money when trading CFDs with this provider. You should consider whether you understand how CFDs work and whether you can afford to take the high risk of losing your money.
Stratos Global LLC (tradu.com ):
Losses can exceed deposits.
Please be advised that the information presented on TradingView is provided to Tradu (‘Company’, ‘we’) by a third-party provider (‘TFA Global Pte Ltd’). Please be reminded that you are solely responsible for the trading decisions on your account. There is a very high degree of risk involved in trading. Any information and/or content is intended entirely for research, educational and informational purposes only and does not constitute investment or consultation advice or investment strategy. The information is not tailored to the investment needs of any specific person and therefore does not involve a consideration of any of the investment objectives, financial situation or needs of any viewer that may receive it. Kindly also note that past performance is not a reliable indicator of future results. Actual results may differ materially from those anticipated in forward-looking or past performance statements. We assume no liability as to the accuracy or completeness of any of the information and/or content provided herein and the Company cannot be held responsible for any omission, mistake nor for any loss or damage including without limitation to any loss of profit which may arise from reliance on any information supplied by TFA Global Pte Ltd.
The speaker(s) is neither an employee, agent nor representative of Tradu and is therefore acting independently. The opinions given are their own, constitute general market commentary, and do not constitute the opinion or advice of Tradu or any form of personal or investment advice. Tradu neither endorses nor guarantees offerings of third-party speakers, nor is Tradu responsible for the content, veracity or opinions of third-party speakers, presenters or participants.
XAUUSD trade ideas
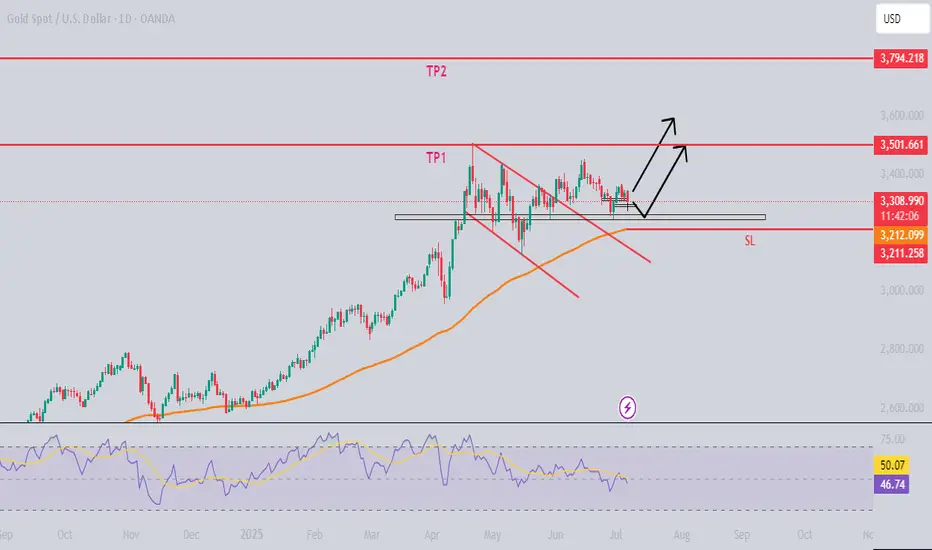
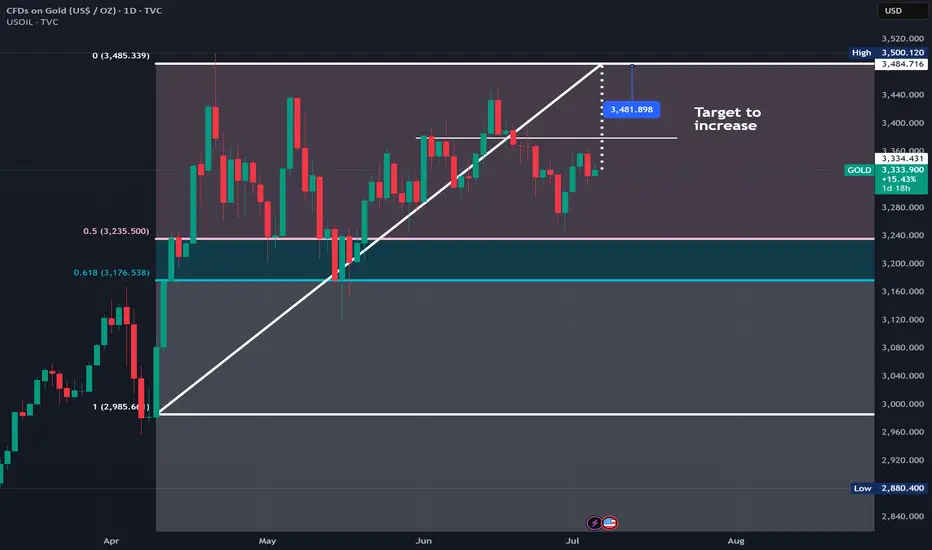
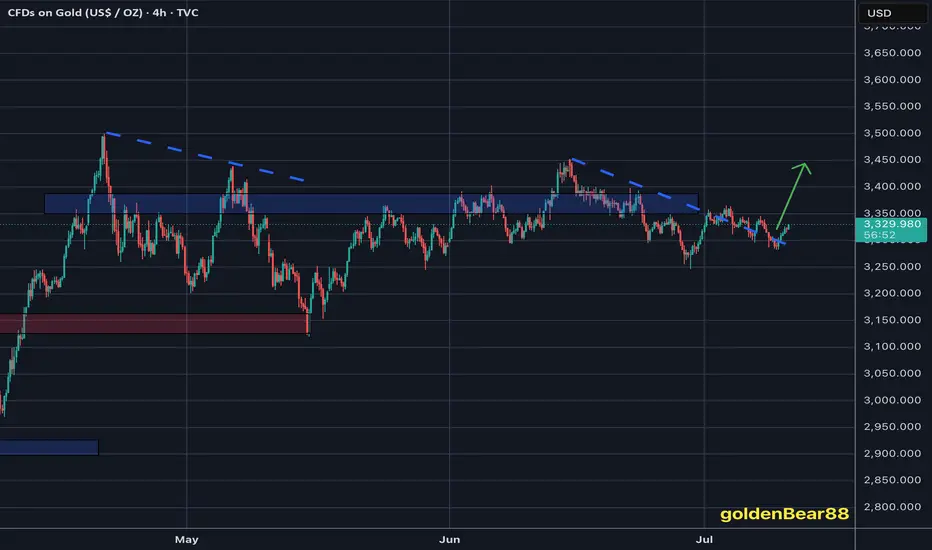
GOLDAlthough there is a bearish divergence visible on the weekly timeframe (which often signals a possible slowdown or reversal in the trend) the daily timeframe shows that gold has broken out of a bullish flag pattern a continuation pattern that usually leads to further upside.
This breakout suggests that, despite the divergence gold still has room to move higher in the short term. Based on this pattern it could rise up to around 38000 before it begins a retracement (a temporary pullback). After the retracement the overall upward trend may resume, especially if strong support levels hold.
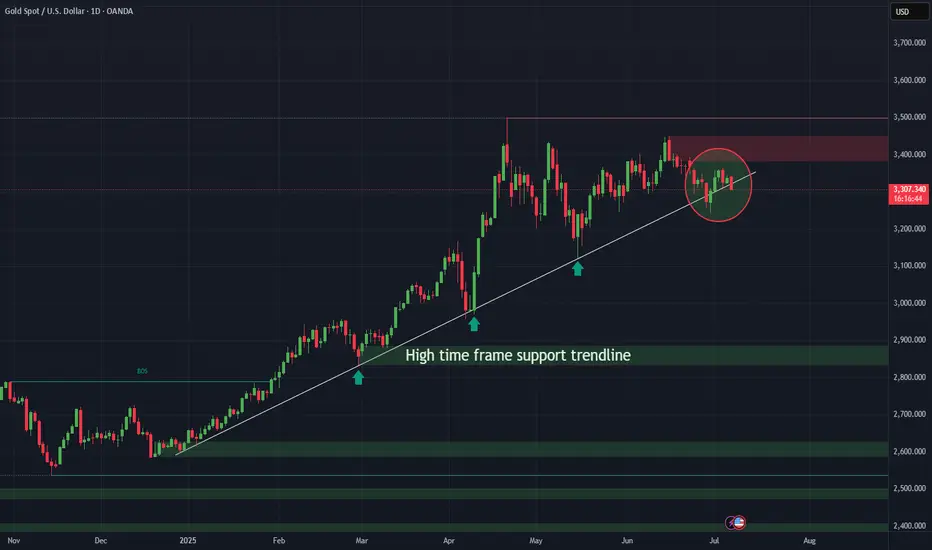
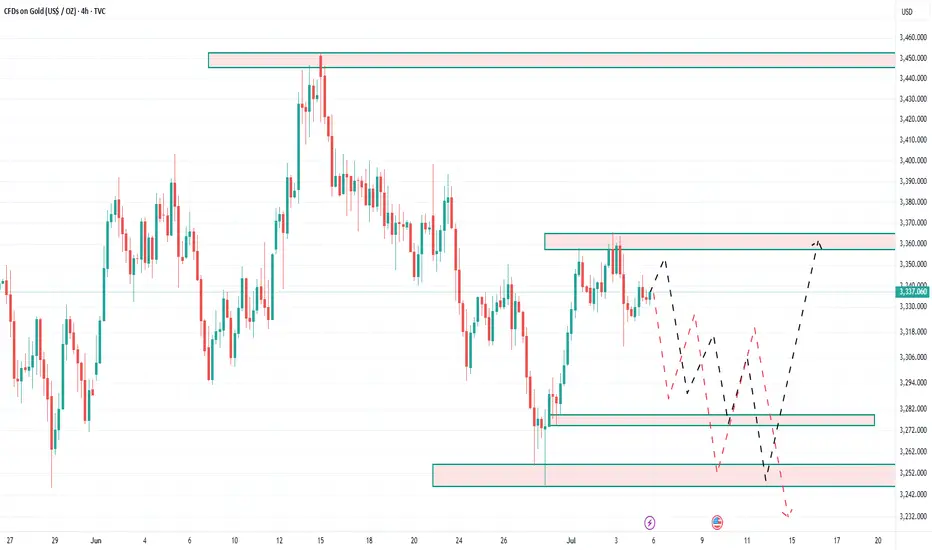
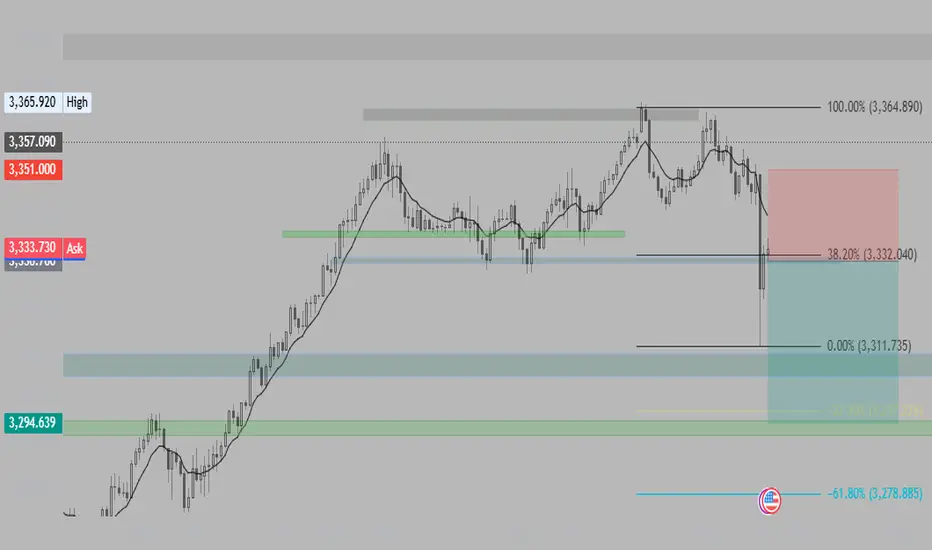
$XAU mau breakdown besarDisclaimer:
THIS IS NOT A SELL INSTRUCTION
BUT SERVES AS A REFERENCE FOR THE BIG MAJOR TREND IF IT TURNS OUT TO BE VALID
From the retest to the nearest resistance, I suspect that gold may fail to break through the red resistance area.
And from the chart, there’s already a slight hint of a breakdown.
Will gold plunge and break its major daily trendline support?
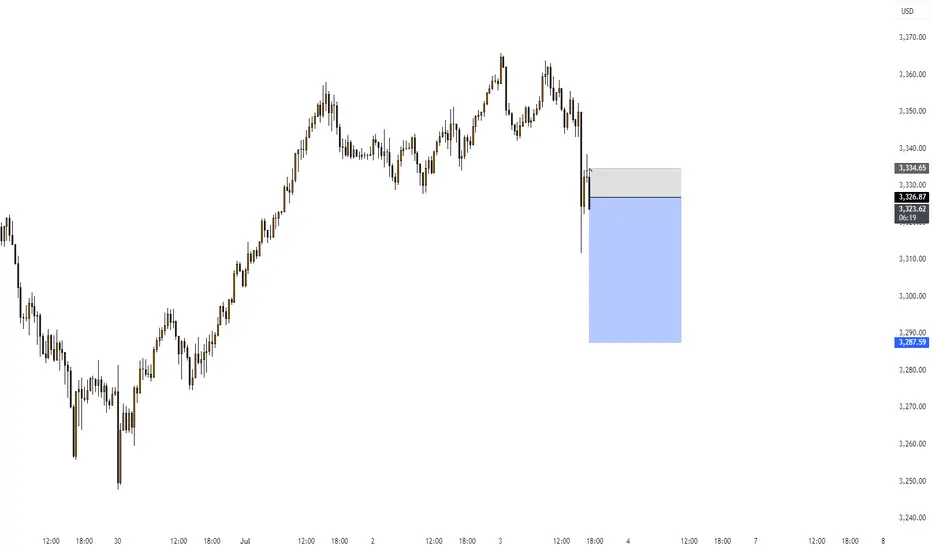
July 5, 2025 - XAUUSD GOLD Analysis and Potential OpportunityAnalysis:
After market liquidity returned today, price failed to hold above 3345, and once 3324 key support broke, it retraced to the previous bullish cost zone.
Now, price is testing the 3300 psychological level — if it breaks, watch for shorts targeting 3290, then 3275.
Short-term resistance is around 3320 — as long as it holds, bearish momentum remains strong.
If price breaks below 3306, I plan to add to shorts, with focus on the 3300 level.
For longs, I will wait for a clear reversal candle before considering entry.
🔍 Key Levels to Watch:
• 3362 – Resistance
• 3350 – Resistance
• 3345 – Intraday resistance zone
• 3330 – Resistance zone
• 3322 – Short-term resistance zone
• 3315 – Short-term resistance
• 3306 – Short-term support
• 3300 – Critical support / Psychological level
• 3290 – Key support
• 3283 – Key support
👉 If you want to learn how I time entries and set stop-losses, hit the like button so I know there’s interest — I may publish a detailed post by the weekend if support continues!
Disclaimer: This is my personal opinion, not financial advice. Always trade with caution and manage your risk.
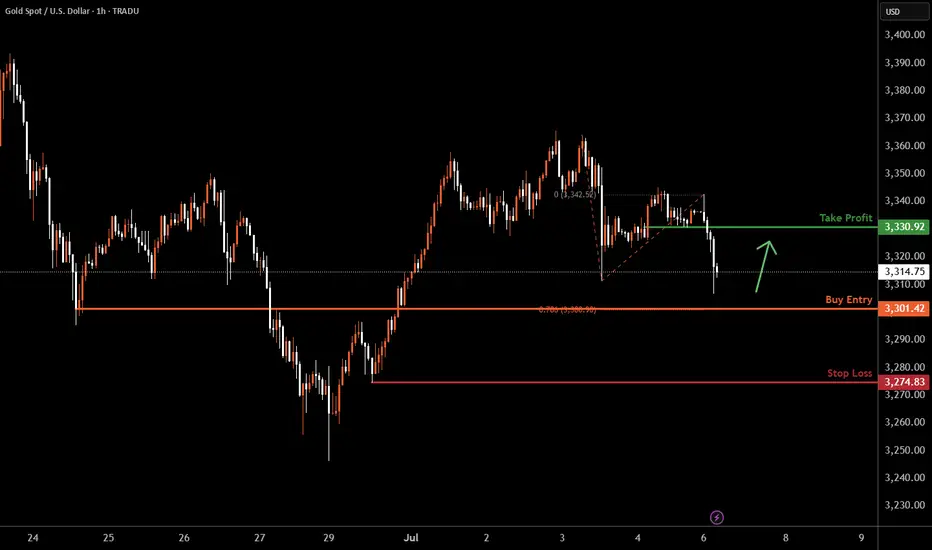
XAUUSD H1 I Bullish Bounce Off Based on the H1 chart analysis, the price is falling toward our buy entry level at 3301.42, a pullback support that aligns with the 78.6% Fib projection.
Our take profit is set at 3330.92, a pullback resistance.
The stop loss is placed at 3274.83, a swing low support.
High Risk Investment Warning
Trading Forex/CFDs on margin carries a high level of risk and may not be suitable for all investors. Leverage can work against you.
Stratos Markets Limited (tradu.com ):
CFDs are complex instruments and come with a high risk of losing money rapidly due to leverage. 63% of retail investor accounts lose money when trading CFDs with this provider. You should consider whether you understand how CFDs work and whether you can afford to take the high risk of losing your money.
Stratos Europe Ltd (tradu.com ):
CFDs are complex instruments and come with a high risk of losing money rapidly due to leverage. 63% of retail investor accounts lose money when trading CFDs with this provider. You should consider whether you understand how CFDs work and whether you can afford to take the high risk of losing your money.
Stratos Global LLC (tradu.com ):
Losses can exceed deposits.
Please be advised that the information presented on TradingView is provided to Tradu (‘Company’, ‘we’) by a third-party provider (‘TFA Global Pte Ltd’). Please be reminded that you are solely responsible for the trading decisions on your account. There is a very high degree of risk involved in trading. Any information and/or content is intended entirely for research, educational and informational purposes only and does not constitute investment or consultation advice or investment strategy. The information is not tailored to the investment needs of any specific person and therefore does not involve a consideration of any of the investment objectives, financial situation or needs of any viewer that may receive it. Kindly also note that past performance is not a reliable indicator of future results. Actual results may differ materially from those anticipated in forward-looking or past performance statements. We assume no liability as to the accuracy or completeness of any of the information and/or content provided herein and the Company cannot be held responsible for any omission, mistake nor for any loss or damage including without limitation to any loss of profit which may arise from reliance on any information supplied by TFA Global Pte Ltd.
The speaker(s) is neither an employee, agent nor representative of Tradu and is therefore acting independently. The opinions given are their own, constitute general market commentary, and do not constitute the opinion or advice of Tradu or any form of personal or investment advice. Tradu neither endorses nor guarantees offerings of third-party speakers, nor is Tradu responsible for the content, veracity or opinions of third-party speakers, presenters or participants.
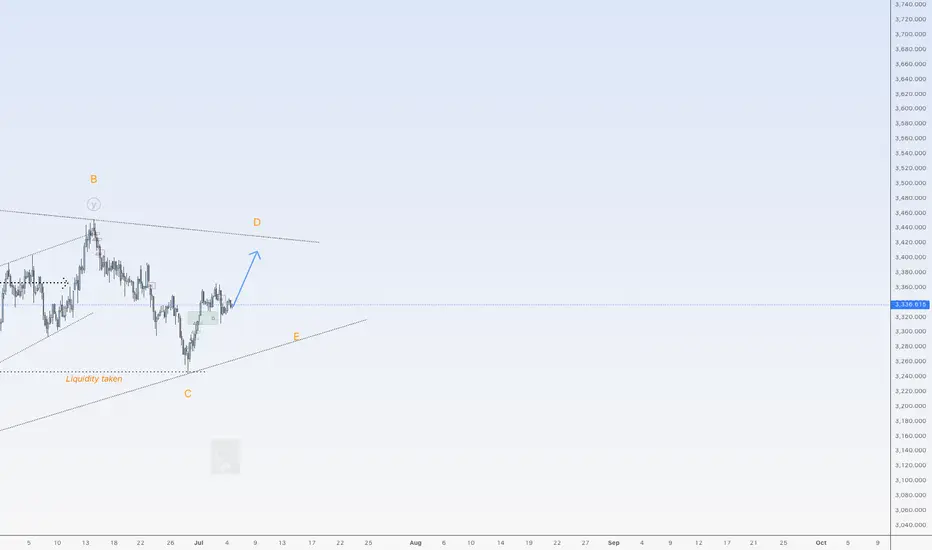
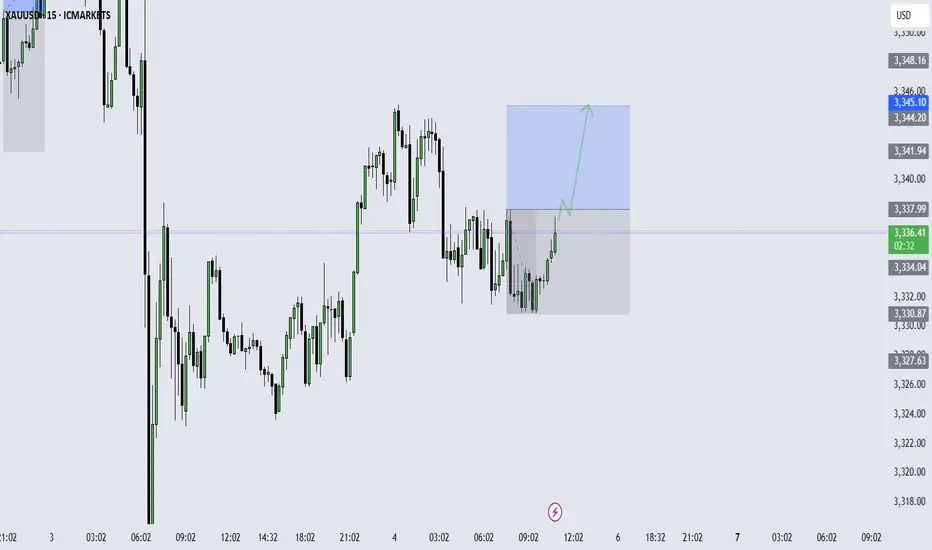
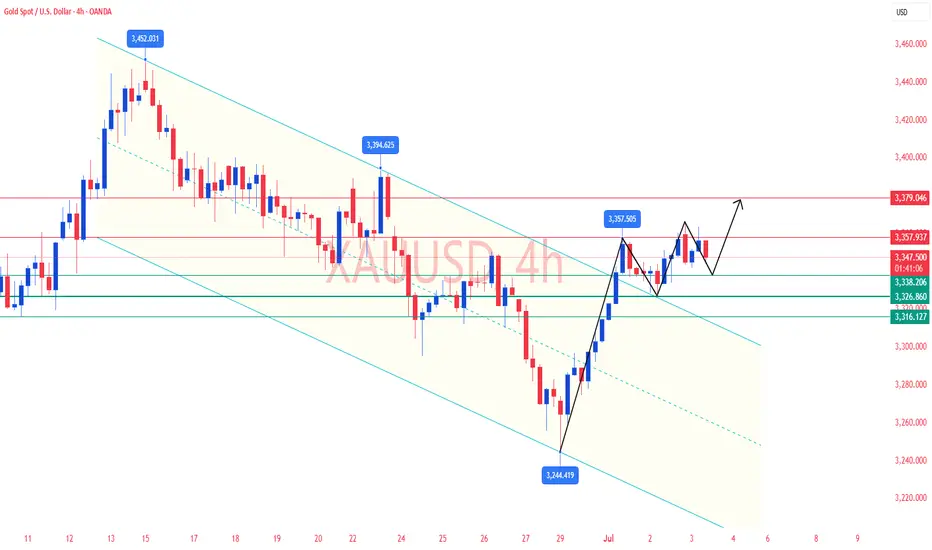
Little more upside for goldHi traders,
Last week gold swept the liquidity and went up again just as I said in my outlook.
The last wave down could be wave 2 or it's part of a big Triangle (orange C)/ Flat.
Next week we could see this pair go up again to finish (orange) Wave D. After that we could see another move down for Wave E.
Let's see what price does and react.
Trade idea: Wait for the bigger correction to complete.
If you want to learn more about trading FVG's & liquidity sweeps with wave analysis, please make sure to follow me.
This shared post is only my point of view on what could be the next move in this pair based on my technical analysis.
Don't be emotional, just trade your plan!
Eduwave
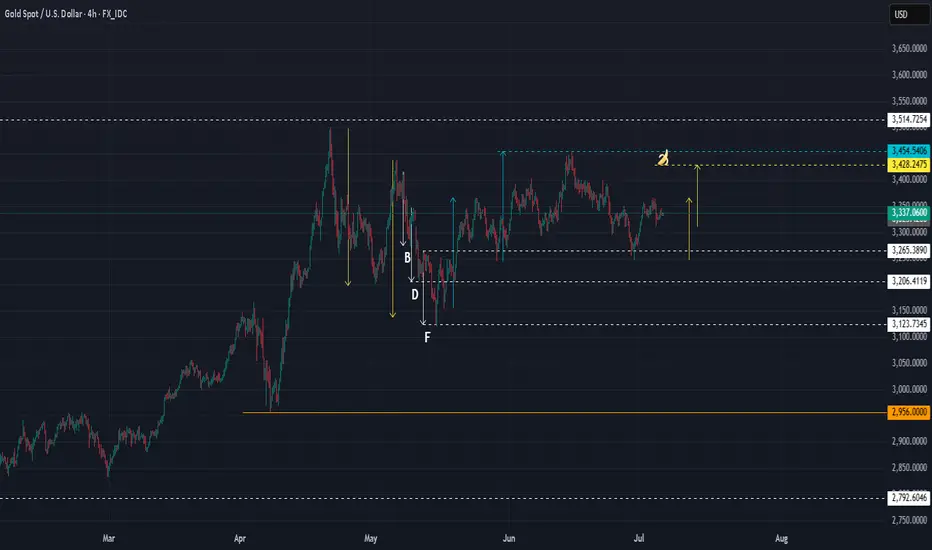
XAUUSD : Clear weakeningWhat about XAU?
Many would be asking.
From a harmonic point of view, I can see price is weakening. Even with a push by BUYERS, it would only reach the banana, which is BELOW the previous high at the blue line.
So, the plan is that when it reaches banana, a SELL is possible with SL just above the blue line. In this way, we have a higher probability of success, plus a fantastic R/R.
Looking at the DXY, the $ is also at an inflection point.
Good luck.
XAUUSD to continue bearishingI expect XAUUSD to spike up and reversed to continue bearishing this coming week.
gold is still bearishgold is still bearish
in the higher timeframe gold is still bearish after a strong bull run week gold settled below the weekly neckline.
which is an indication of the bearish is still present. a few support and resistance.
during NFP a strong bearish enter from 3351 to 3312.
3351 is a goo retest area of bear.
bull stop at 3312 now as key level.
break 3312 next destination is 3289 and 3248.
break above 3352 and 3363 next destination is 3400.
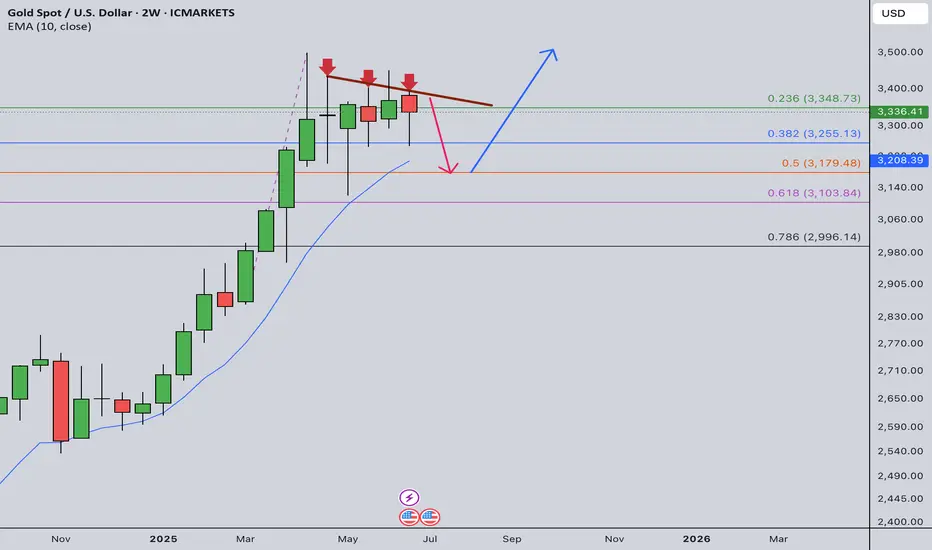
Gold Weekly Summary and Forecast 7/5/2025In my half year review, I expected next half year gold will continue its bullish drive. Overall picture shows a bullish momentum. However, the road is not straight and could be bumpy.
In 2W TF, there is a three drive pattern indicated in the chart with three red arrows. An immediate price drop will follow from this pattern. Therefore, I am expecting the price to drop to 3180 before next take off.
Next week's high is max at 3380 and could drop to 3260. Watch out the daily trading plan for more details next week.
XAUUSD (GOLD): Buy setupXAUUSD (GOLD): Buy setup. check for 5m candle close and buy when the level is broken.
Cheers.
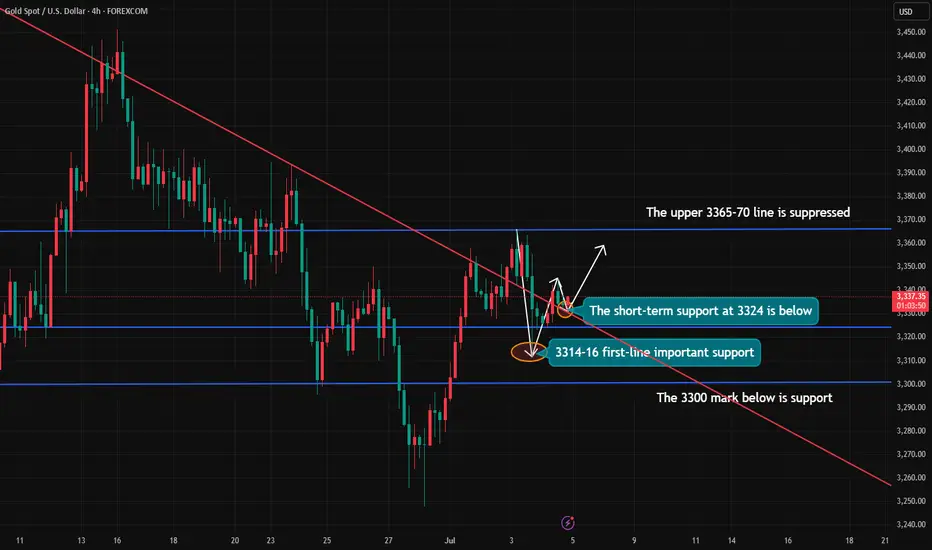
Gold lacks downward momentum.Today, gold is relatively quiet due to the impact of the US Independence Day holiday. Below, we continue to pay attention to the short-term quality layer of 3324. The key pressure above is maintained at yesterday's opening point of 3345-50. At midnight, gold rebounds near 3345-50 and can be shorted. The target is around 3330-33. It closes early at midnight and maintains a range of fluctuations! If your current gold operation is not ideal, I hope I can help you avoid detours in your investment. Welcome to communicate!
From the 4-hour analysis, pay attention to the support of 3324-30 below, focus on the support position of 3316, and pay attention to the short-term resistance of 3345-50 above. At midnight, the overall high-altitude low-multiple cycle participation remains unchanged. In the middle position, watch more and move less, be cautious in chasing orders, and wait patiently for key points to participate.
Excellent NFP sessionAs discussed throughout yesterday's session commentary: "My position: Gold is Trading within #3,350's belt which represents crossroads for the Short-term. Either #3,362.80 - #3,368.80 break-out to the upside towards #3,377.80 strong Resistance, or #3,342.80 - #3,352.80 break-out to the downside towards #3,327.80 Support. Current Price-action is ideal for Scalping since I don't expect major movement until tomorrow's NFP numbers."
Firstly I have re-Sold Gold almost all Wednesday's Asian session from #3,360's (Wednesday - Thursday) closing my orders on #3,352.80 then re-Bought Gold with set of aggressive Scalping orders from #3,345.80 towards #3,352.80. As NFP numbers were delivered, I have waited for decline to find a Support and Bought Gold aggressively from #3,312.80 and closed on #3,320.80. Later on, #3,332.80 Sold again (#4 aggressive Scalps) and closed on #3,327.80 and with mentioned order finalized excellent NFP session.
Technical analysis: The Short-term Price-action is Trading within #3,327.80 - #3,352.80 belt as I can easily spot idle movements on Hourly 4 chart with #3,327.80 Support bounces but regardless, Gold is Trading within my predicted values. Spot though on the Hourly 4 chart how Technicals are showcasing different / mixed values, and Gold is isolated within Neutral Rectangle with detectable Higher Low’s Upper and Lower zone. This is what I described on my commentary as an Bearish Divergence (BD) and is usually a first alert that the trend might be pointing to even stronger takedown. See how the very same divergence has Traded since November - April. On the November #12 Low, the Price-action started rising on an Ascending Channel but only once the structure formed a new Low. Then again after mentioned Low’s, Gold started rising until the next Bullish Divergence (which means, after local Low's tested, Gold engaged parabolic uptrend). I am monitoring closely #MA50 on Daily chart which is pointer for new #1 - #3 Month cycle.
My position: I will take no new orders as I am Highly satisfied with my returns / also it is holiday in U.S. as I do not expect major moves throughout the session (only ranging candles with Low Volume). Enjoy the Profits and have a great weekend!
NFP unexpectedly broke out, where will gold go?📰 News information:
1. Initial jobless claims and NFP data
2. The final decision of the Federal Reserve
📈 Technical Analysis:
The unexpectedly negative NFP data caused a sudden plunge in gold prices, which forced me to terminate the transaction urgently. Currently, gold has not fallen below the 3,300 mark. Therefore, I will still pay attention to the closing of the hourly line. If gold closes below 3,320, the downward trend will continue. On the contrary, if it closes above 3,320, gold will consolidate at a high level in the short term. Two days ago, I gave the support level of 3315-3305 below. Please be cautious in trading at the moment.
🎯 Trading Points:
For now, let’s focus on the hourly closing situation
In addition to investment, life also includes poetry, distant places, and Allen. Facing the market is actually facing yourself, correcting your shortcomings, confronting your mistakes, and strictly disciplining yourself. I hope my analysis can help you🌐.
TVC:GOLD OANDA:XAUUSD FX:XAUUSD FOREXCOM:XAUUSD PEPPERSTONE:XAUUSD FXOPEN:XAUUSD
XAUUSD - trade - market structure XAUUSD - trade - market structure , this is a easy and clean setup, of course there is no analysis:)., use risk and trade managment
SHORT XAUUSD IDEABullish NFP results
Bearish PA
Target 3295
Depending on 30 m PA if we close below prv candle, entry to previous long wick and retest the latest low
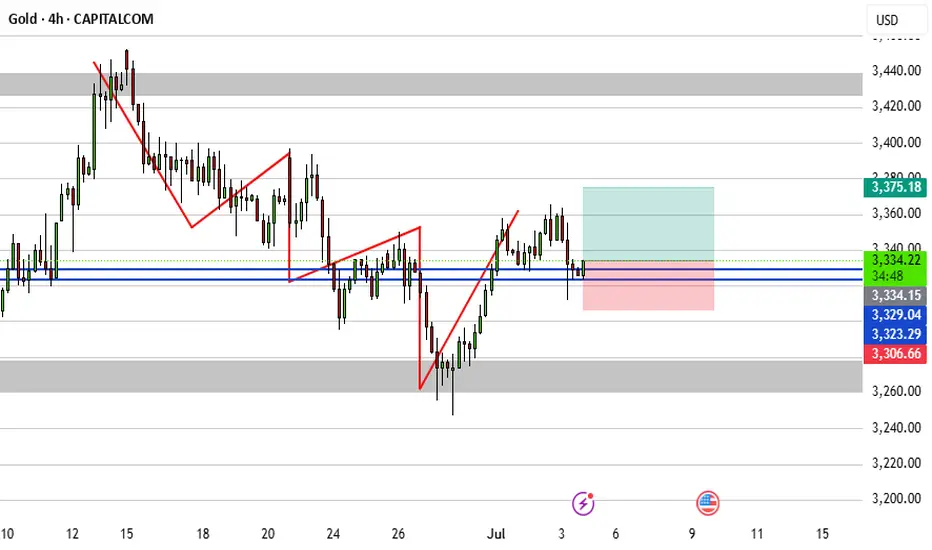
Gold Analysis and Trading Strategy | July 3✅ Fundamental Overview:
The U.S. ADP employment data released on Wednesday came in significantly below expectations, with only -33,000 new jobs added, far short of the market forecast of 100,000. This raised concerns about a potential slowdown in the U.S. labor market and strengthened expectations for Fed rate cuts later this year. As a result, gold prices rose by $18.2 during the session.
✅Today’s primary focus shifts to the U.S. Non-Farm Payroll (NFP) report. Market expectations are as follows:
🔹New jobs added: 110,000 (previous: 139,000)
🔹Unemployment rate: Expected to rise to 4.3%
🔹Average hourly earnings: Also closely watched for inflation implications
If the actual data falls significantly short of expectations, especially if job growth is below 100,000 or the unemployment rate exceeds 4.3%, this would likely reinforce rate cut expectations, driving gold to break above key resistance levels and extend its rally.
Conversely, if the data beats expectations, the market may scale back its rate-cut bets, supporting the U.S. dollar and putting downward pressure on gold prices. In this case, a pullback in gold should not be ruled out.
✅ Technical Analysis:
🔴Key Resistance Levels: 3358 is the major short-term resistance. A firm breakout and hold above this level could open the path toward the psychological barrier at 3400.
🟢Key Support Levels: 3320 serves as a critical short-term support. If it breaks, gold may test the $3300 level next, with further downside support at $3246.
✅ Trading Strategy Suggestions:
🔸 Aggressive Strategy (Pre-NFP Participation):
🔰If gold pulls back to the $3340–3345 range during the European session, consider small long positions. and look for targets at $3360–3380. If the NFP data is bullish for gold, there’s potential for a move toward $3400.
🔸 Conservative Strategy (Post-NFP Reaction):
Wait for the NFP data to be released and trade based on the market's immediate reaction:
🔰If gold breaks above $3358, consider buying the breakout, targeting $3400.
🔰If gold drops below $3320, short-term downside targets are $3300 and possibly lower.
✅ Key Factors to Watch in the NFP Report:
🟠Whether job creation is significantly below expectations (e.g., <100k)
🟠Whether the unemployment rate exceeds 4.3%
🟠The pace of wage growth and its impact on inflation expectations
✅If the data disappoints across the board, gold may extend the strength seen after the ADP report, breaking through $3370 and testing $3400. However, if the data comes in stronger than expected, be prepared for a potential pullback to $3300 or even lower.
🔥If your recent trading results haven’t been ideal, feel free to reach out. I’d be happy to help you avoid common pitfalls and improve your performance. I will provide real-time strategy updates during market hours based on price action — stay tuned🤝
Gold next target NFP News As you know, today is NFP news and my target in the news is that gold should go to 3391 which is becoming the best position for a buy. If you are satisfied with my analysis, then you can play and this is my analysis.
Gold reverses on new Bull legTechnical analysis: Gold has made an important Bullish step towards full scale Hourly 4 chart’s reversal as it almost recovered the #3,330.80 pressure point. That makes Hourly 4 chart practically Neutral but leaning on the Bullish side, however well Supported within #3,300’s belt now, which has held on multiple occasions so far. As mentioned throughout my remarks, Hourly 4 chart is still Neutral as said, but invalidated Descending Channel has expanded giving me Buying signs that Gold may test #3,352.80 psychological benchmark on current Fundamental mix (if #3,337.80 gets invalidated, Gold can kick-start aggressive upswing towards #3,345.80 zone / wall of Resistance lines first and #3,352.80 benchmark in extension. Gold was mainly correlated with DX during first Months of the Year as there was no shift which lifts the probability that July will also be DX Month is (#91.99%) since Bond Yields were on downtrend, taking strong hammering and broke all Support zones, and Gold was also on Short-term decline which confirms my Gold - DX correlation on #Q1 opening, so look for pointers there. Remember, when you are unsure of the Medium-term direction on Gold always look for clues on DX and Trade accordingly. Only when DX Trades on Weekly chart’s Higher High’s Lower zone, I will be able to note with a Higher degree of certainty that the Bearish reversal on Gold is sustainable.
My position: I was Selling Gold until #3,282.80 all the way and was aware that if #3,277.80 - #3,282.80 gets invalidated, Gold will continue with the decline, and reversal there will deliver Bullish leg. I have engaged #3,284.80 Buying order and closed near #3,300.80 benchmark. Then re-Sold aggressively from #3,304.80 towards #3,298.80. Bought #3,307.80 and kept my order all the way towards #3,315.80. Current session I will re-Buy Gold with Scalp orders aggressively, do not Sell today / my practical suggestion.
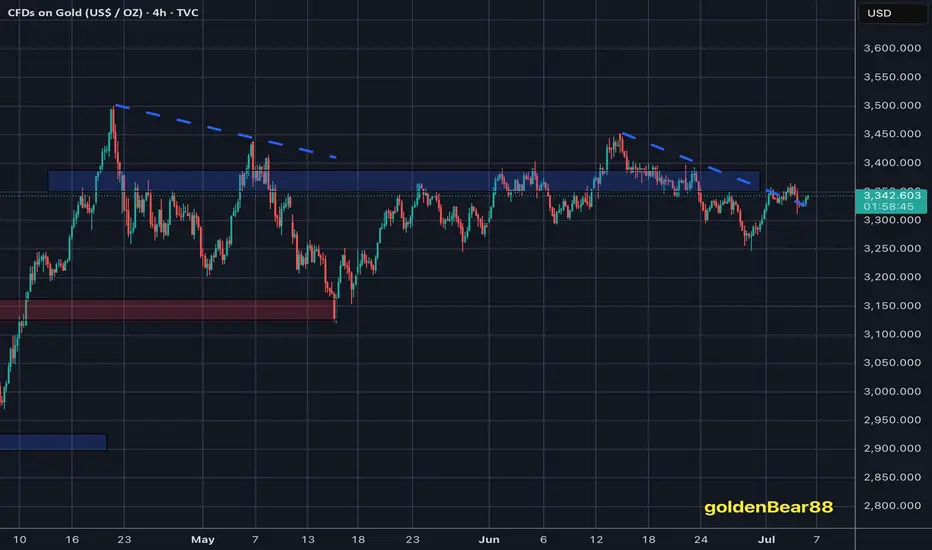
Gold Extends Gains Amid Uncertainty FOREXCOM:XAUUSD
XAUUSD is currently moving within the $3,270 – $3,360 range 📈, holding steady under buying pressure over the last few hours ⏳.
🌏 During today’s Asian and early European sessions, gold climbed to around $3,330 🥇, extending gains as investors monitored trade tensions and absorbed the latest FOMC Minutes 🗂️. A weaker U.S. dollar 💵⬇️ continues to support gold, attracting safe-haven flows 🛡️ amid ongoing market uncertainty.
📊 Meanwhile, the Fed’s June meeting minutes 🪙 revealed disagreements among officials 🤔 on the timing and scale of potential rate cuts 🔻. While most anticipate some easing later this year, views range from cuts as early as July to no cuts until year-end. The Fed maintains a cautious, data-driven approach 🧭, citing tariff-related inflation risks, slowing consumer spending, and a strong labour market as key factors for their policy outlook.
👀 We will continue to monitor gold closely for potential breakout or reversal signals within this range. Stay tuned for updates!
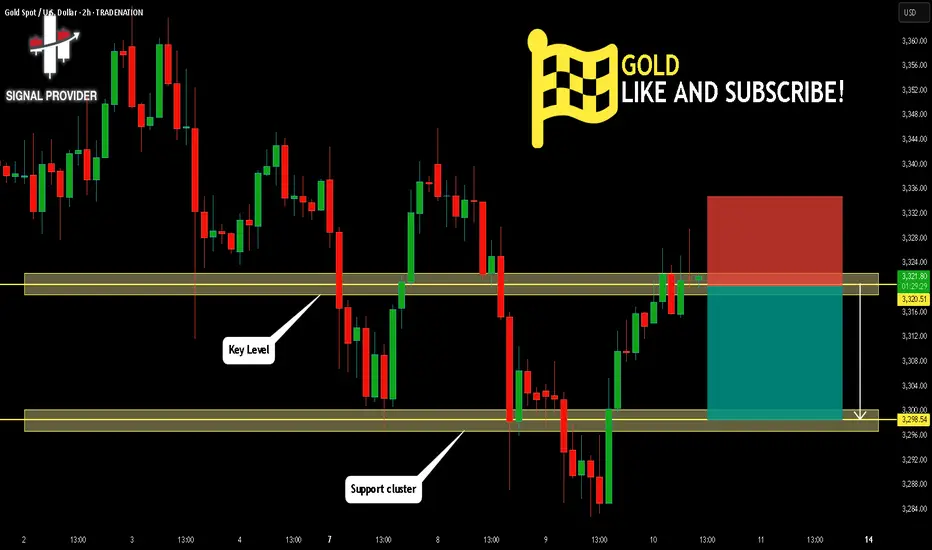
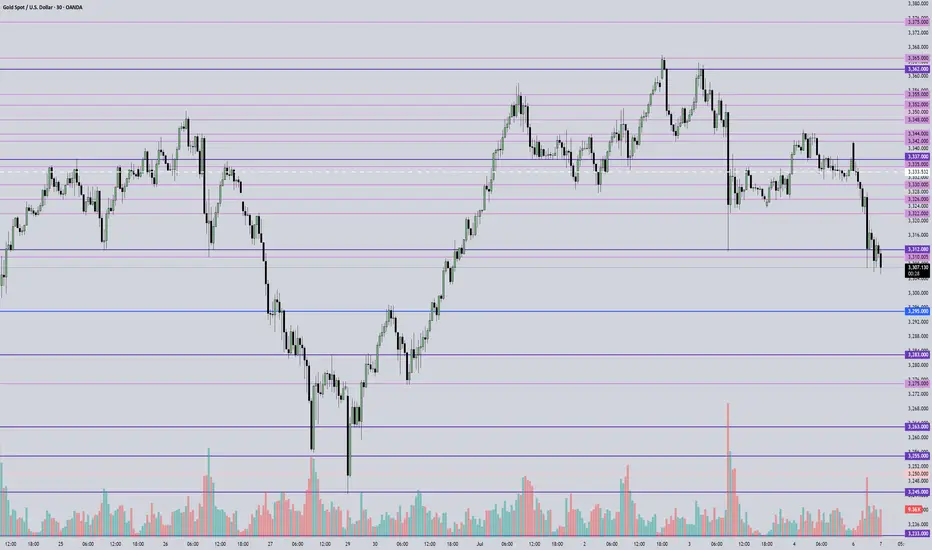
GOLD Is Very Bearish! Short!
Here is our detailed technical review for GOLD.
Time Frame: 2h
Current Trend: Bearish
Sentiment: Overbought (based on 7-period RSI)
Forecast: Bearish
The market is approaching a significant resistance area 3,320.51.
Due to the fact that we see a positive bearish reaction from the underlined area, I strongly believe that sellers will manage to push the price all the way down to 3,298.54 level.
P.S
Please, note that an oversold/overbought condition can last for a long time, and therefore being oversold/overbought doesn't mean a price rally will come soon, or at all.
Disclosure: I am part of Trade Nation's Influencer program and receive a monthly fee for using their TradingView charts in my analysis.
Like and subscribe and comment my ideas if you enjoy them!