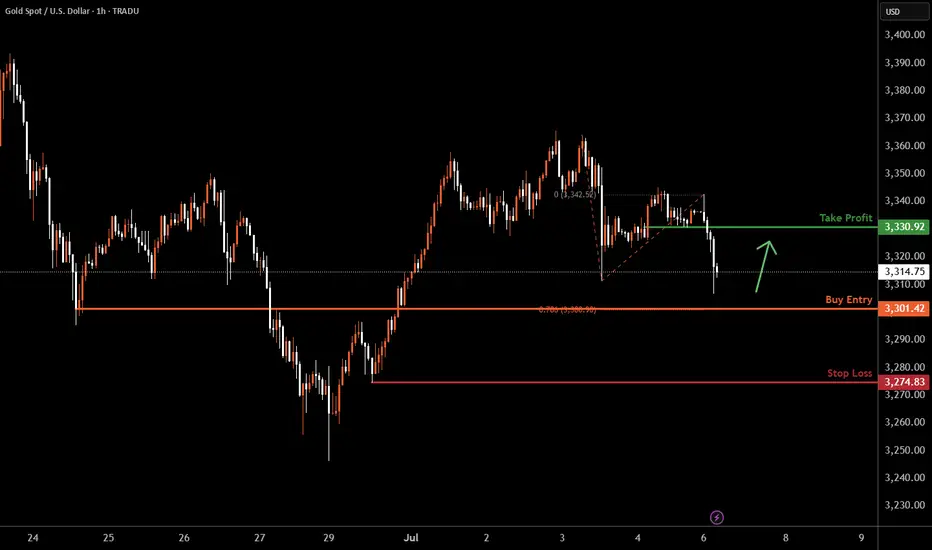
XAUUSD H1 I Bullish Bounce Off Based on the H1 chart analysis, the price is falling toward our buy entry level at 3301.42, a pullback support that aligns with the 78.6% Fib projection.
Our take profit is set at 3330.92, a pullback resistance.
The stop loss is placed at 3274.83, a swing low support.
High Risk Investment Warning
Trading Forex/CFDs on margin carries a high level of risk and may not be suitable for all investors. Leverage can work against you.
Stratos Markets Limited (tradu.com ):
CFDs are complex instruments and come with a high risk of losing money rapidly due to leverage. 63% of retail investor accounts lose money when trading CFDs with this provider. You should consider whether you understand how CFDs work and whether you can afford to take the high risk of losing your money.
Stratos Europe Ltd (tradu.com ):
CFDs are complex instruments and come with a high risk of losing money rapidly due to leverage. 63% of retail investor accounts lose money when trading CFDs with this provider. You should consider whether you understand how CFDs work and whether you can afford to take the high risk of losing your money.
Stratos Global LLC (tradu.com ):
Losses can exceed deposits.
Please be advised that the information presented on TradingView is provided to Tradu (‘Company’, ‘we’) by a third-party provider (‘TFA Global Pte Ltd’). Please be reminded that you are solely responsible for the trading decisions on your account. There is a very high degree of risk involved in trading. Any information and/or content is intended entirely for research, educational and informational purposes only and does not constitute investment or consultation advice or investment strategy. The information is not tailored to the investment needs of any specific person and therefore does not involve a consideration of any of the investment objectives, financial situation or needs of any viewer that may receive it. Kindly also note that past performance is not a reliable indicator of future results. Actual results may differ materially from those anticipated in forward-looking or past performance statements. We assume no liability as to the accuracy or completeness of any of the information and/or content provided herein and the Company cannot be held responsible for any omission, mistake nor for any loss or damage including without limitation to any loss of profit which may arise from reliance on any information supplied by TFA Global Pte Ltd.
The speaker(s) is neither an employee, agent nor representative of Tradu and is therefore acting independently. The opinions given are their own, constitute general market commentary, and do not constitute the opinion or advice of Tradu or any form of personal or investment advice. Tradu neither endorses nor guarantees offerings of third-party speakers, nor is Tradu responsible for the content, veracity or opinions of third-party speakers, presenters or participants.
XAUUSD trade ideas
XAUUSD : Clear weakeningWhat about XAU?
Many would be asking.
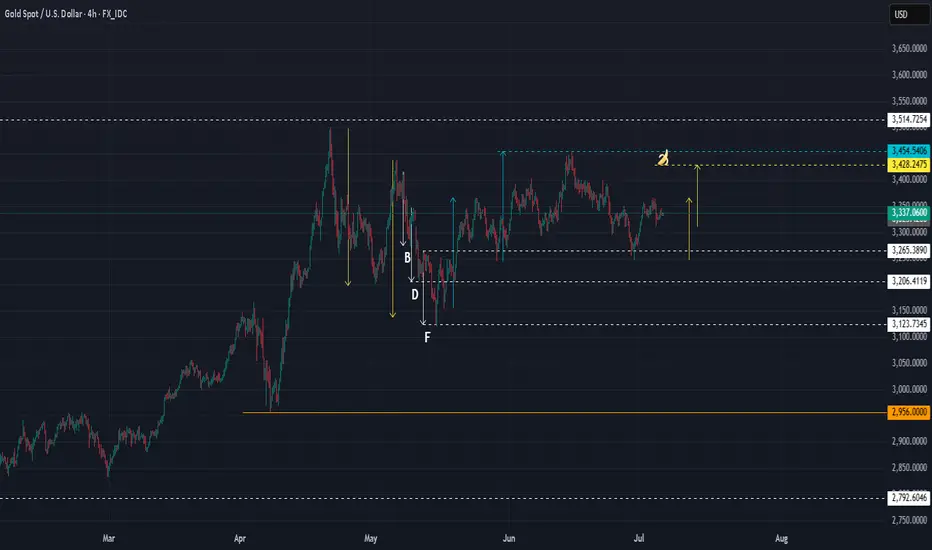
From a harmonic point of view, I can see price is weakening. Even with a push by BUYERS, it would only reach the banana, which is BELOW the previous high at the blue line.
So, the plan is that when it reaches banana, a SELL is possible with SL just above the blue line. In this way, we have a higher probability of success, plus a fantastic R/R.
Looking at the DXY, the $ is also at an inflection point.
Good luck.
XAUUSD to continue bearishingI expect XAUUSD to spike up and reversed to continue bearishing this coming week.
gold is still bearishgold is still bearish
in the higher timeframe gold is still bearish after a strong bull run week gold settled below the weekly neckline.
which is an indication of the bearish is still present. a few support and resistance.
during NFP a strong bearish enter from 3351 to 3312.
3351 is a goo retest area of bear.
bull stop at 3312 now as key level.
break 3312 next destination is 3289 and 3248.
break above 3352 and 3363 next destination is 3400.
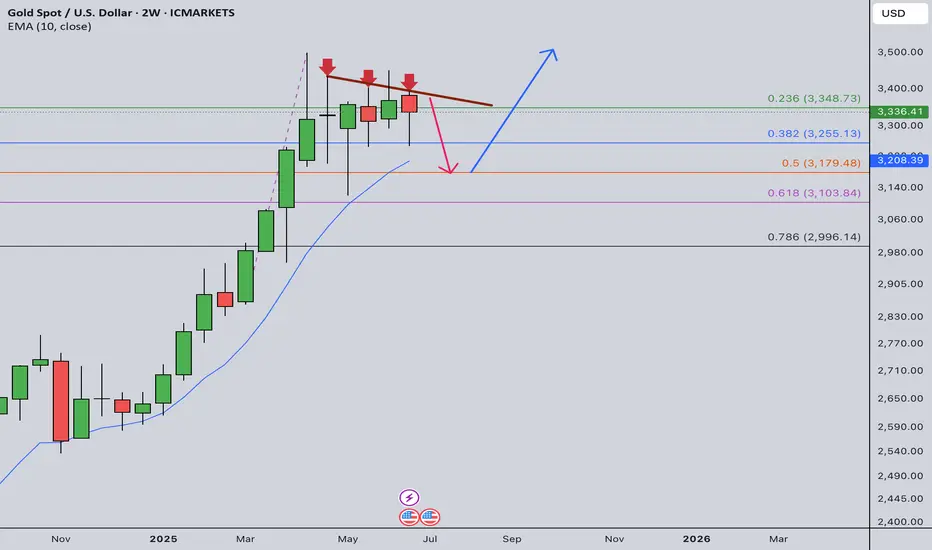
Gold Weekly Summary and Forecast 7/5/2025In my half year review, I expected next half year gold will continue its bullish drive. Overall picture shows a bullish momentum. However, the road is not straight and could be bumpy.
In 2W TF, there is a three drive pattern indicated in the chart with three red arrows. An immediate price drop will follow from this pattern. Therefore, I am expecting the price to drop to 3180 before next take off.
Next week's high is max at 3380 and could drop to 3260. Watch out the daily trading plan for more details next week.
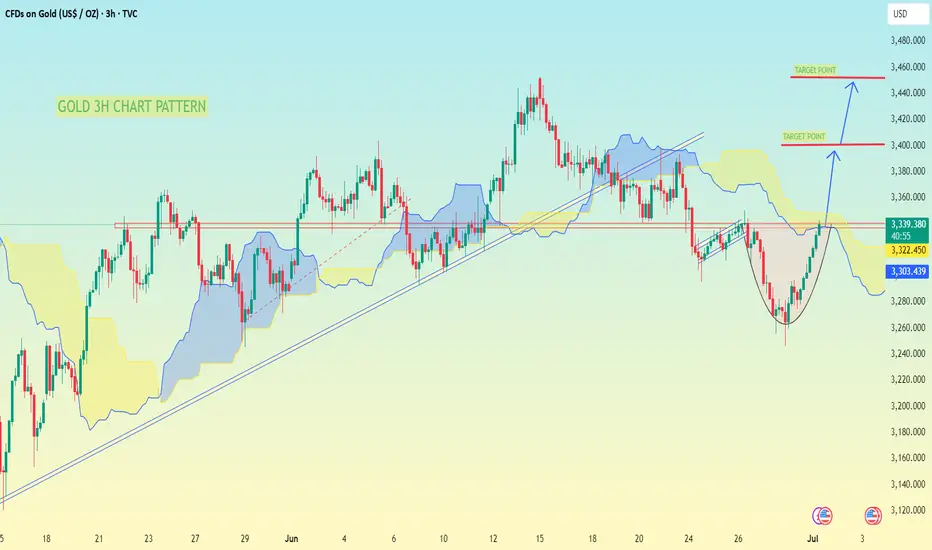
GOLD 3H Chart Pattern, I have marked a cup formationGOLD 3H Chart Pattern, I have marked a cup formation, which often indicates a bullish reversal setup. Based on the chart:
Key Levels:
Current Price Zone: Around 3,323 - 3,330
First Target: Near 3,380 - 3,400
Final Target: Near 3,440 - 3,460
Analysis:
Price is forming a cup pattern with resistance around 3,380 - 3,400
Break above 3,400 could lead towards the final target zone of 3,440 - 3,460
Watch for price reaction near Ichimoku Cloud; clean breakout above the cloud confirms bullish momentum
Suggested Targets:
✅ First Target: 3,380 - 3,400 USD
✅ Second Target: 3,440 - 3,460 USD
Note: Wait for confirmation above 3,330 - 3,340 and bullish momentum to continue.
If you want, I can also give stop-loss and entry suggestions based on this chart. Let me know!
How to accurately grasp gold trading opportunities?Gold rebounded as expected, and fell under pressure at the 3295-3296 line during the European session. This position was the key resistance level for the previous top and bottom conversion, and the range shock pattern continued. In terms of operation, the high-altitude and low-multiple ideas remain unchanged, and we will continue to pay attention to the short opportunities after the rebound.
📉 Operational ideas:
Short orders can be arranged in batches in the 3295-3311 area, and the target is 3280-3270 area;
If the support below 3260-3255 is effective, you can consider taking the opportunity to reverse long orders and participate in short-term.
📌Key position reference:
Upper pressure: 3295, 3311
Lower support: 3278-3275, 3260-3255
Gold strategy idea suggests shorting at 3291-3293, perfectly capturing the rebound high point! Smoothly reached the profit target of 3275, gaining 18pips! If you are not able to flexibly respond to the market in trading, and are not good at adjusting your trading ideas and rhythm in time with the market rhythm, you can pay attention to the bottom notification 🌐 to get more specific operation details and strategy updates. Let us work together to flexibly and steadily pursue more profits in the ever-changing market!

Gold lacks downward momentum.Today, gold is relatively quiet due to the impact of the US Independence Day holiday. Below, we continue to pay attention to the short-term quality layer of 3324. The key pressure above is maintained at yesterday's opening point of 3345-50. At midnight, gold rebounds near 3345-50 and can be shorted. The target is around 3330-33. It closes early at midnight and maintains a range of fluctuations! If your current gold operation is not ideal, I hope I can help you avoid detours in your investment. Welcome to communicate!
From the 4-hour analysis, pay attention to the support of 3324-30 below, focus on the support position of 3316, and pay attention to the short-term resistance of 3345-50 above. At midnight, the overall high-altitude low-multiple cycle participation remains unchanged. In the middle position, watch more and move less, be cautious in chasing orders, and wait patiently for key points to participate.
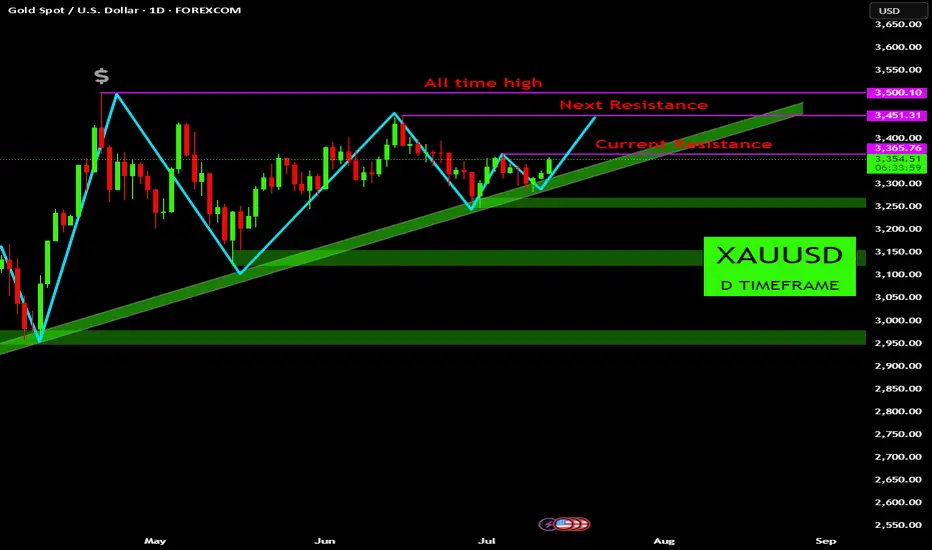
XAUUSD Bullish Structure Intact: Eyes on the All-Time HighGood day, traders. Taking a look at the Gold (XAUUSD) daily chart, we see a very clean and persistent bullish structure that has been developing since the start of the year. The primary driver of this analysis is the well-defined ascending trendline that has served as foundational support for the entire uptrend.
The Bullish Thesis:
Price action has consistently printed higher lows, bouncing cleanly off the ascending trendline multiple times. Each test of this support has been met with strong buying pressure, propelling the price to new highs. This pattern establishes a clear path of least resistance to the upside.
Currently, the price is challenging the immediate resistance zone around the 3,365 level. A decisive daily close above this area would be the first signal that the next leg up is underway.
First Target: A break of current resistance opens the door to test the Next Resistance at approximately 3,450. This level aligns with the previous significant high from early June.
Ultimate Target: The main prize for the bulls is the All-Time High sitting just above at 3,500. This is a major psychological and technical level. A break and hold above this zone would signal a new phase of price discovery.
The Bearish Invalidation:
For this bullish outlook to be invalidated, we would need to see a convincing break and daily close below the primary ascending trendline. Such a move would indicate a significant shift in market structure. Should this occur, key support zones to watch on the downside are:
The horizontal support area around 3,150.
The major structural support zone around 3,000.
Conclusion:
The technical picture for Gold remains firmly bullish. The structure is clear, and the trend is your friend. As long as the price continues to respect the ascending trendline support, the bias is to look for buying opportunities on dips or breakouts. The immediate focus is on clearing the 3,365 resistance to unlock the path towards the 3,450 and 3,500 targets.
Disclaimer:
The information provided in this chart is for educational and informational purposes only and should not be considered as investment advice. Trading and investing involve substantial risk and are not suitable for every investor. You should carefully consider your financial situation and consult with a financial advisor before making any investment decisions. The creator of this chart does not guarantee any specific outcome or profit and is not responsible for any losses incurred as a result of using this information. Past performance is not indicative of future results. Use this information at your own risk. This chart has been created for my own improvement in Trading and Investment Analysis. Please do your own analysis before any investments.
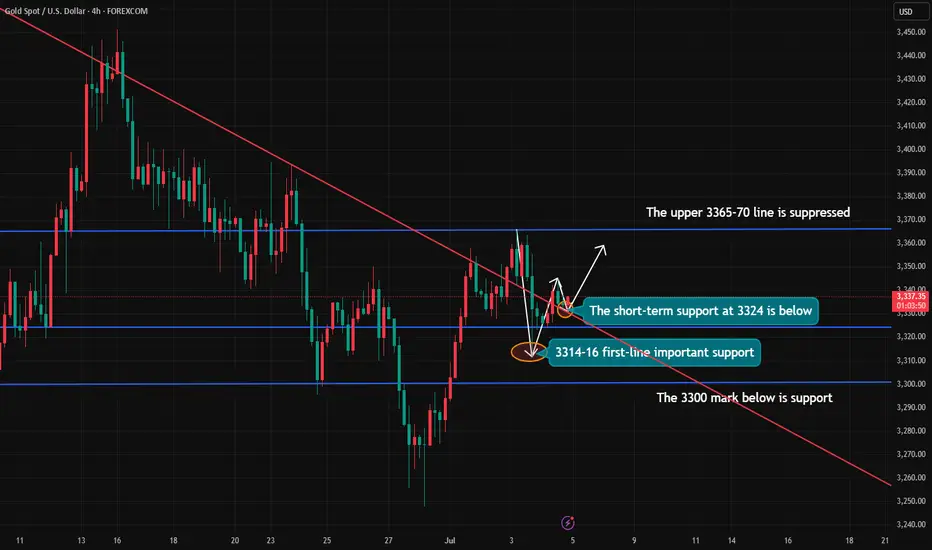
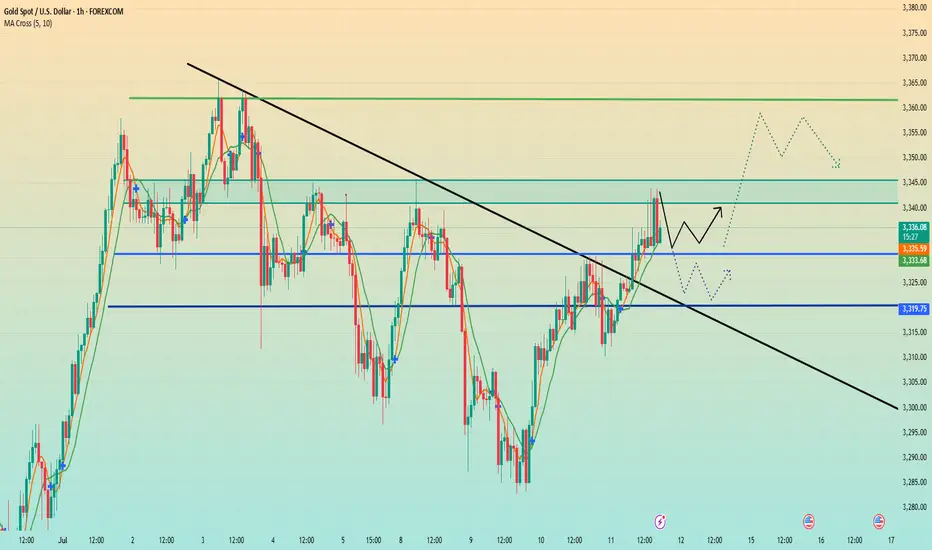
The price fell back. Watch out for a breakthrough.After reaching the resistance position near 3345 predicted by Quaid, the price fell back slightly, and the price fluctuated around 3335 so far.
From the hourly chart, before the price stabilizes at 3345, it is likely to maintain a range of 3330-3345. 3330-3345 is a temporary range. If it stands firm and breaks above 3345 again, the fluctuation range will become 3345-3360.
On the contrary, if it falls below 3330, the range may drop to 3320-3330. However, as long as the downward trend does not fall below 3320, gold will still maintain a bullish trend. If the price breaks down below 3320, today’s trend will be reversed.
As long as it is above 3320, gold will maintain a bullish trend today.
On the last trading day of this week, I wish all traders a good harvest.
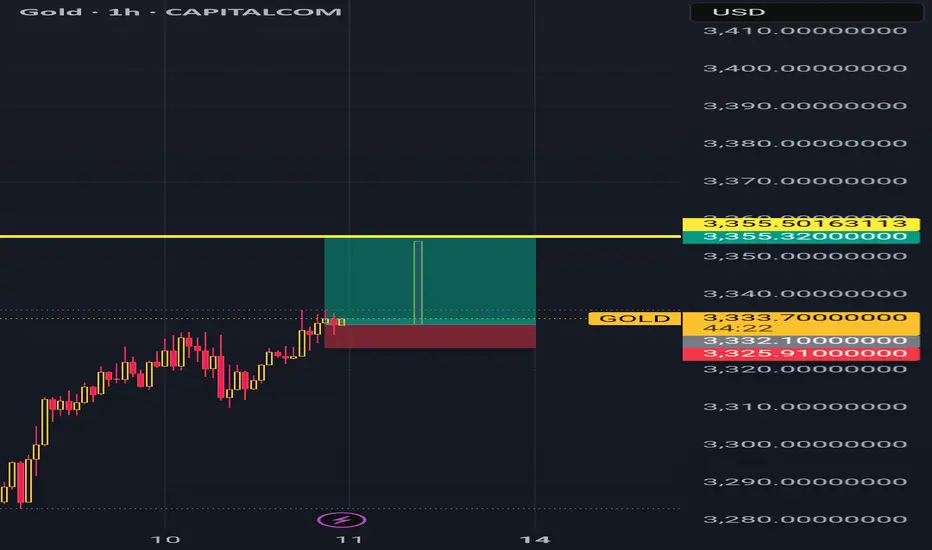
Do you think we are in a long position?According to the chart you can see, I am in a long position up to the $3355 range.
Gold Breaks Free, Ready to Ride the WindGold may ride the wind upward after breaking out of its consolidation structure, opening a path of potential upside.
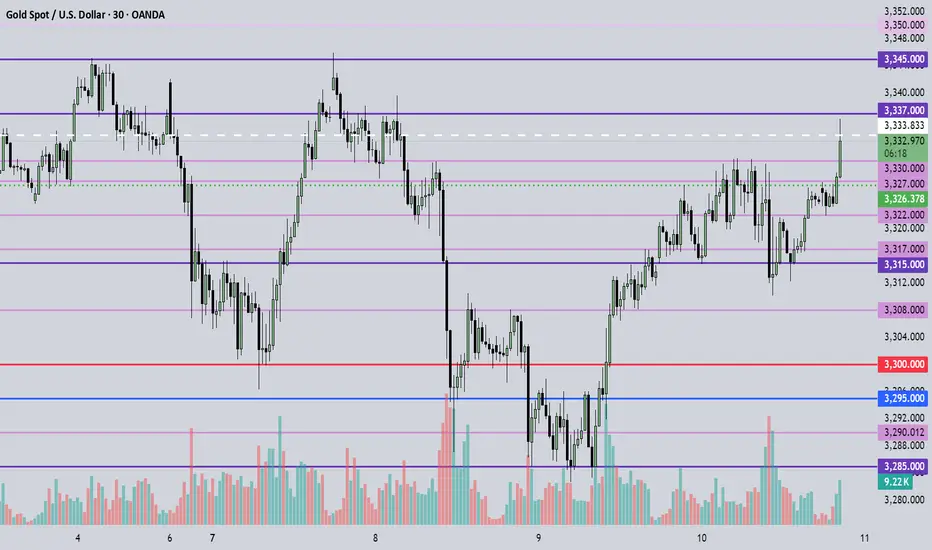
July 11, 2025 - XAUUSD GOLD Analysis and Potential Opportunity📝 Analysis:
Strong bullish momentum continues. During the Asian session, the plan is to buy on pullbacks to support.
Key resistance at 3345 — if it holds, short setups may offer good risk-reward.
🔍 Key Levels to Watch:
• 3375 – Resistance
• 3365 – Resistance
• 3350 – Midpoint resistance
• 3345 – Intraday key resistance
• 3330 – Key support
• 3322 – Support
• 3315 – Support
• 3307 – Intraday key support
• 3300 – Psychological level
📈 Intraday Strategy:
• SELL if price breaks below 3330 → watch 3327, then 3322, 3315, 3308
• BUY if price holds above 3330 → watch 3337, then 3345, 3350, 3355
👉 If you want to know how I time entries and set stop-losses, hit the like button so I know there’s interest — I may publish a detailed post by the weekend if support continues!
Disclaimer: This is my personal opinion, not financial advice. Always trade with caution and manage your risk.
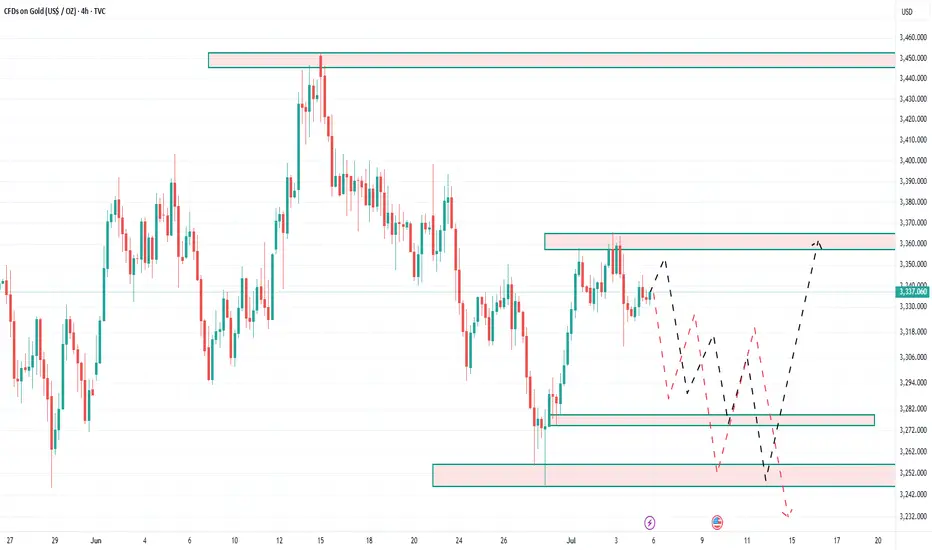
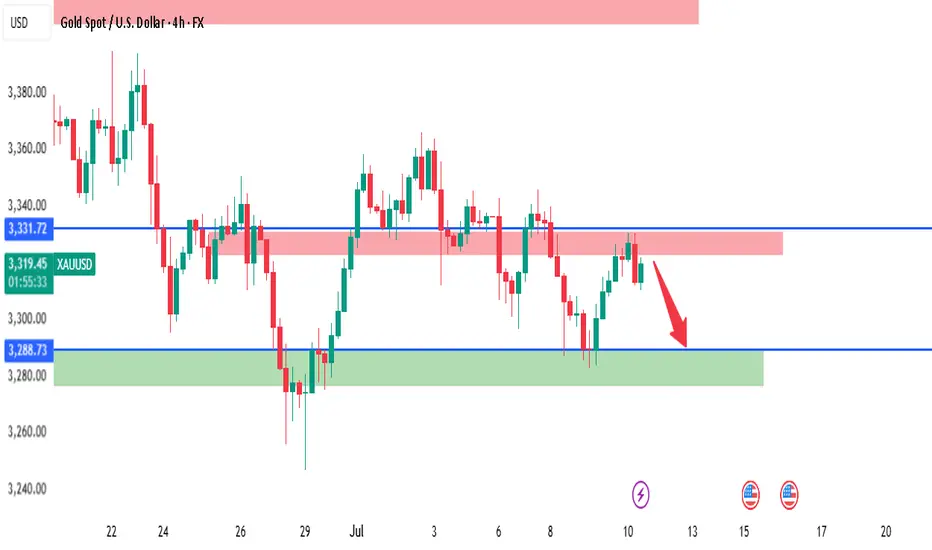
XAUUSD - 4H Bearish Rejection from Supply Zone | SMC AnalysisGold is showing signs of weakness after reacting strongly from a 4H Supply Zone around the 3331.72 level. Price tapped into the red supply zone, failed to break above, and is now forming lower highs — suggesting bearish momentum is building.
🔍 Key SMC Observations:
Supply Zone: Price rejected the 3331.72 level, which acted as a clear supply area based on past liquidity grabs and bearish institutional moves.
Change of Character (CHoCH): We saw a CHoCH around July 5th–6th, indicating a shift from bullish to bearish order flow.
Lower High Formation: Price failed to make a new high after tapping supply, showing signs of distribution.
Imbalance + Target Zone: Clean imbalance exists down to 3288.73 and potentially to the green demand zone around 3260–3270.
📍Trade Setup Idea:
Sell Opportunity: If price continues to reject the supply zone, look for bearish confirmation on the lower timeframes (e.g., 1H) to enter.
Target 1 (TP1): 3288.73 (near-term liquidity level)
Target 2 (TP2): 3260–3270 demand zone
Invalidation: A break and close above 3331.72 would invalidate the short-term bearish bias.
🔴 Watch for reaction around 3288.73 – if it holds, expect a possible bounce. If broken, further downside is likely.
Weekly Analysis of the Dollar Index, BTC, SPX500, NAS100 & GOLDIn this week's video I break down key technical patterns and indicators to discuss the behavior and direction of the Dollar index, Bitcoin, SPX500 and NAS100 Indices and finally GOLD for the coming week. I highlight price trends, support and resistance levels, candlestick formations, and moving averages to identify potential targets. My goal is to interpret market sentiment and forecast possible price movements based on historical data and technical signals. I hope you find value in my analysis to make informed trade and investment decisions. Cheers

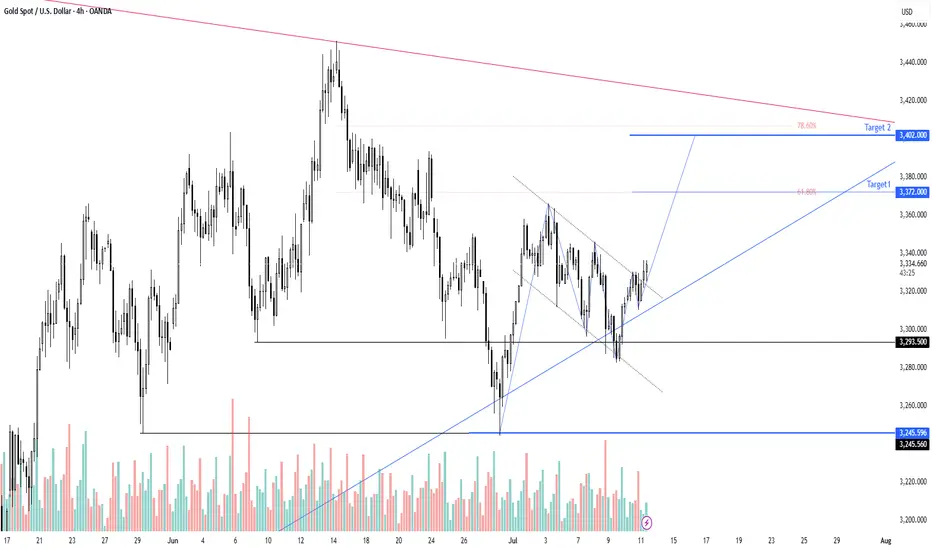
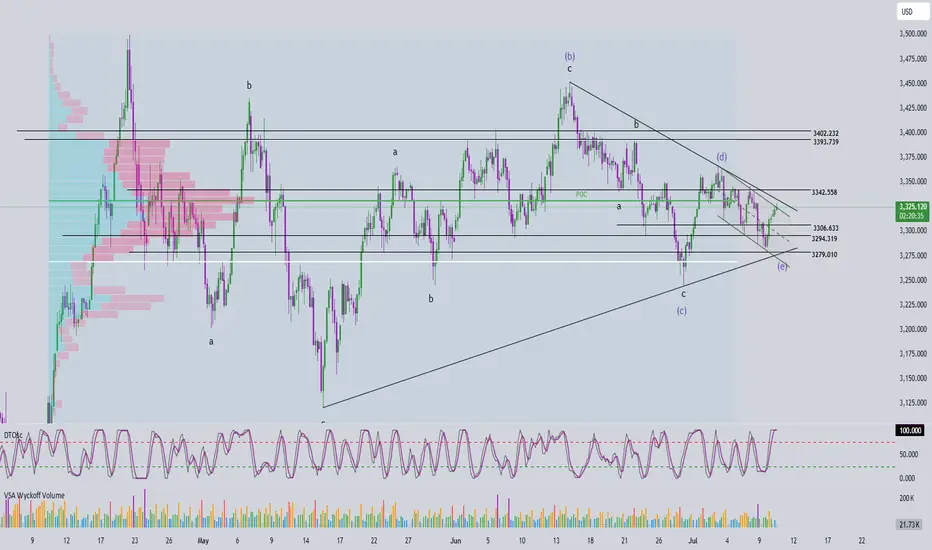
Elliott Wave Analysis – XAUUSD July 10, 2025
🌀 Elliott Wave Structure
On the H4 timeframe, price has returned to test the upper boundary of the converging triangle – currently acting as dynamic resistance. Based on the current wave count, wave e (purple) may have completed at the 3279 low, and price is potentially starting a breakout move.
👉 A confirmed breakout above the triangle would validate the end of the abcde correction and mark the beginning of a new upward trend.
🔋 Momentum Analysis
D1 timeframe: As forecasted yesterday, momentum is entering oversold territory and showing early signs of a reversal. This suggests that an upward trend could dominate over the next 5 days.
H4 timeframe: The two momentum lines are sticking together, indicating a weakening upward drive. A minor pullback may be needed before the next leg up. Key nearby resistance levels to watch are 3330 and 3342.
🎯 Key Price Levels & Validation Zones
The following support zones are crucial for identifying potential entries:
Support Zone 1: 3306 – 3308
Support Zone 2: 3294 – 3297
‼️ Important: A break below 3294 would invalidate the current wave structure, and a new count would be required.
📌 Trade Plan
Scenario 1 – Buy at higher support:
Buy Zone: 3308 – 3306
SL: 3303
TP1: 3342
TP2: 3366
TP3: 3390
Scenario 2 – Buy at deeper support (if stronger correction occurs):
Buy Zone: 3297 – 3294
SL: 3287
TP1: 3342
TP2: 3366
TP3: 3390
Scenario 3 – Safer option (breakout confirmation):
Wait for a breakout above the triangle, then enter on the retest (around 3325–3330)
SL: Based on structure formed during the retest
TP range: 3366 – 3390
📌 Preferred strategy: Wait for H4 to reach oversold or wait for a confirmed breakout and retest to enter safely in alignment with the new uptrend.
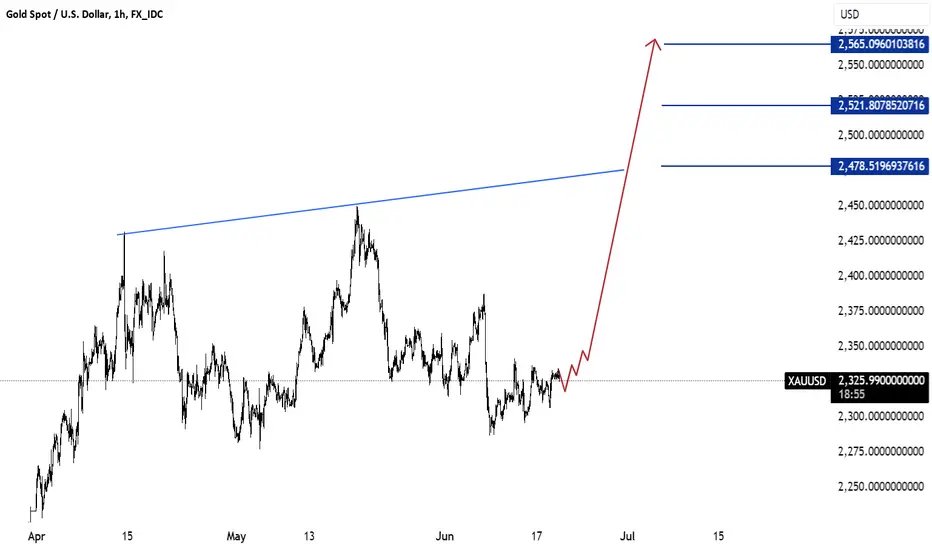
xauusdGold is currently trading at 2325.45 and appears bullish. I suggest considering a buy if it breaks above the range of 2318 to 2325. This recommendation is based on technical indicators showing strength in the current price action.
The potential upside targets are 2370, 2480, 2521, and potentially 2550 levels. These targets are supported by recent price movements indicating momentum towards higher levels.
Live Trade On Gold Im currently holding this position my entry is 3322.14 looking for price to hit 3330.00 or potentially continue to 3340.00 looking for a push London open

July 10, 2025 - XAUUSD GOLD Analysis and Potential Opportunity🔍 Key Levels to Watch:
• 3375 – Resistance
• 3365 – Resistance
• 3350 – Midpoint resistance
• 3345 – Resistance
• 3330 – Key resistance
• 3322 – Intraday key resistance
• 3315 – Support
• 3307 – Intraday key support
• 3300 – Psychological level
• 3295 – Support
• 3285 – Key support
• 3275 – Support
📈 Intraday Strategy:
• SELL if price breaks below 3315 → watch 3310, then 3307, 3300, 3295
• BUY if price holds above 3322 → watch 3330, then 3334, 3337, 3345
👉 If you want to know how I time entries and set stop-losses, hit the like button so I know there’s interest — I may publish a detailed post by the weekend if support continues!
Disclaimer: This is my personal opinion, not financial advice. Always trade with caution and manage your risk.
Gold (XAUUSD) H4 (Classic Analysis) - Update 9/7/2025Gold (XAUUSD) H4 (Classic Analysis) - Update 9/7/2025

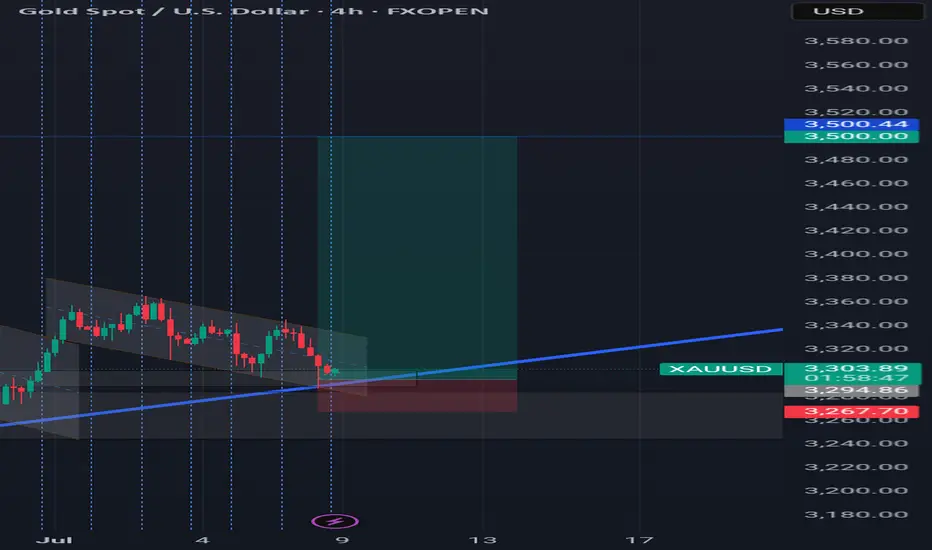
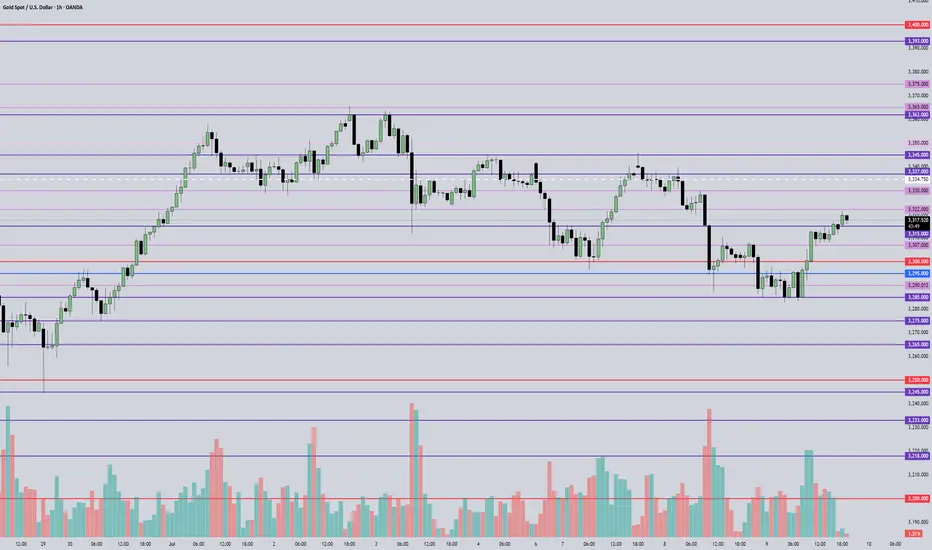
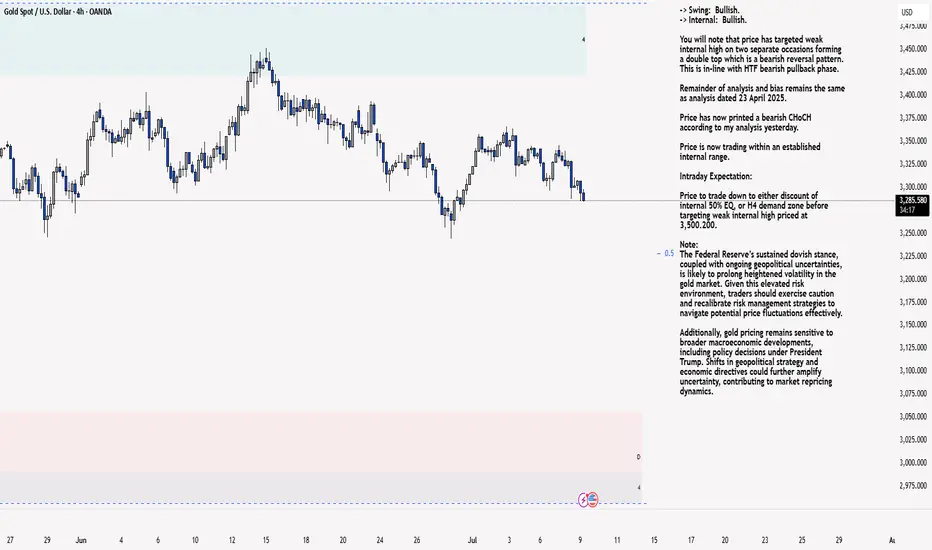
XAU/USD 09 July 2025 Intraday AnalysisH4 Analysis:
-> Swing: Bullish.
-> Internal: Bullish.
You will note that price has targeted weak internal high on two separate occasions forming a double top which is a bearish reversal pattern. This is in-line with HTF bearish pullback phase.
Remainder of analysis and bias remains the same as analysis dated 23 April 2025.
Price has now printed a bearish CHoCH according to my analysis yesterday.
Price is now trading within an established internal range.
Intraday Expectation:
Price to trade down to either discount of internal 50% EQ, or H4 demand zone before targeting weak internal high priced at 3,500.200.
Note:
The Federal Reserve’s sustained dovish stance, coupled with ongoing geopolitical uncertainties, is likely to prolong heightened volatility in the gold market. Given this elevated risk environment, traders should exercise caution and recalibrate risk management strategies to navigate potential price fluctuations effectively.
Additionally, gold pricing remains sensitive to broader macroeconomic developments, including policy decisions under President Trump. Shifts in geopolitical strategy and economic directives could further amplify uncertainty, contributing to market repricing dynamics.
H4 Chart:
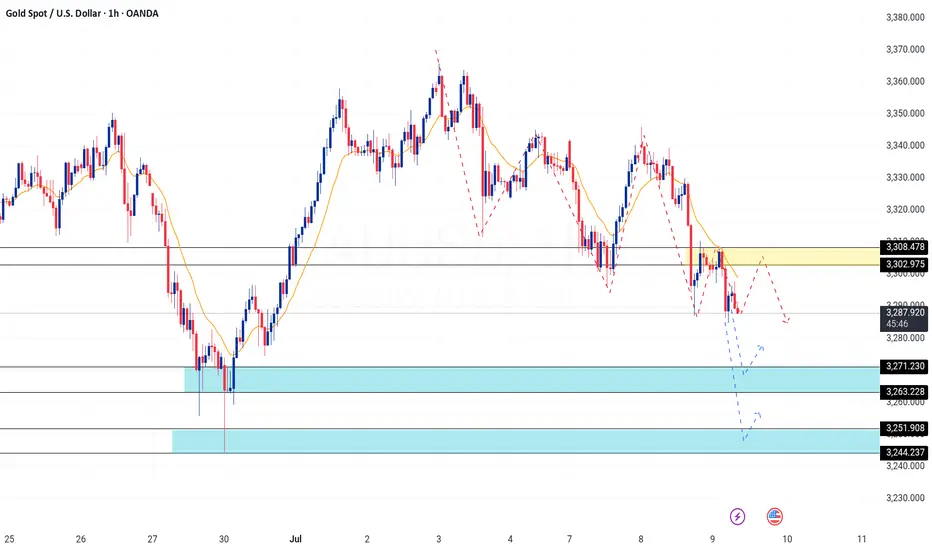
M15 Analysis:
-> Swing: Bullish.
-> Internal: Bullish.
H4 Timeframe - Price has failed to target weak internal high, therefore, it would not be unrealistic if price printed a bearish iBOS.
The remainder of my analysis shall remain the same as analysis dated 13 June 2025, apart from target price.
As per my analysis dated 22 May 2025 whereby I mentioned price can be seen to be reacting at discount of 50% EQ on H4 timeframe, therefore, it is a viable alternative that price could potentially print a bullish iBOS on M15 timeframe despite internal structure being bearish.
Price has printed a bullish iBOS followed by a bearish CHoCH, which indicates, but does not confirm, bearish pullback phase initiation. I will however continue to monitor, with respect to depth of pullback.
Intraday Expectation:
Price to continue bearish, react at either M15 supply zone, or discount of 50% internal EQ before targeting weak internal high priced at 3,451.375.
Note:
Gold remains highly volatile amid the Federal Reserve's continued dovish stance, persistent and escalating geopolitical uncertainties. Traders should implement robust risk management strategies and remain vigilant, as price swings may become more pronounced in this elevated volatility environment.
Additionally, President Trump’s recent tariff announcements are expected to further amplify market turbulence, potentially triggering sharp price fluctuations and whipsaws.
M15 Chart:
Plan for Daytrader 09.07.2025Wait for PA at resistance to sell, and at support to buy.
London session could be 1-2 rr
New York session market could be 2-3rr
*not financial advice - just sharing my thoughts. Make sure you manage your risk on every trad.
xauusd analysiswe are expecting #fomc today and this is my entry plan/idea on xauusd with respect to the zone and the major trend. lets see how will gold playout after London open.