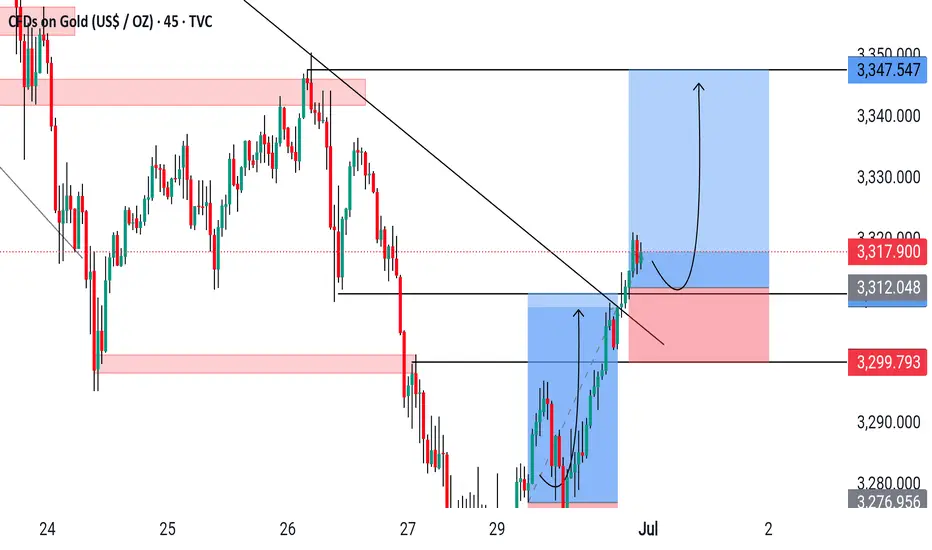
XAUUSD/ GOLD M45 OUTLOOK XAUUSD 45M 🚀
Trendline broken — bulls in control!
Above 3317, aiming for 3349+
SL: 3296 🔒 | TP: 3349 🎯
Stay sharp, lock profits! ⚡️✨
XAUUSD trade ideas
Gold Opens Final June Session with Bullish IntentGold market opens the last day of June exploring a bullish buildup through the 3270's, aiming for a projection toward the 3330's. Momentum aligns with a potential breakout if demand continues to hold. follow for more insights , comment and boost idea
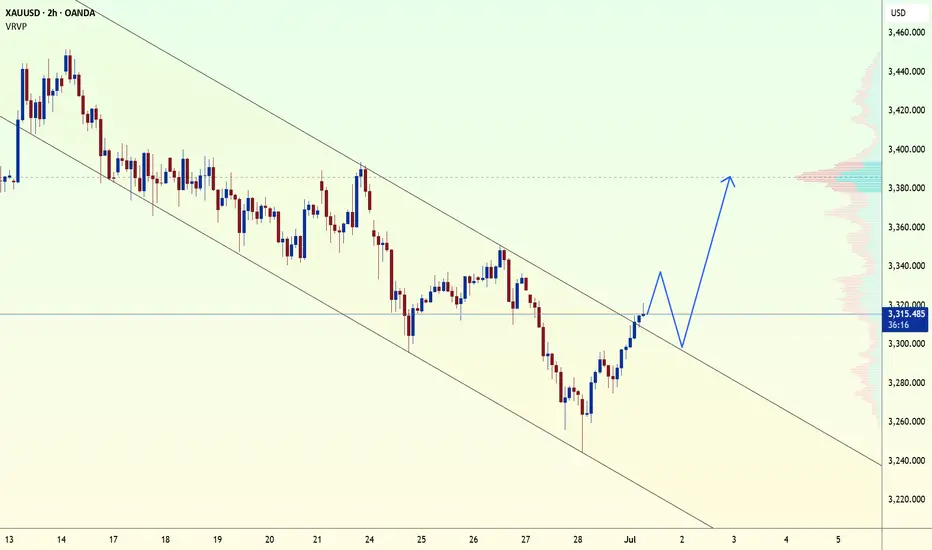
Gold Trading Strategy for 500 Pips !Dear friends!
The exit from the bearish channel has led to an impressive price increase. At the time of writing, the financial market is trading above the $3,300 mark. The uptrend is very strong as it consolidates at high levels with stable trading activity on the 2-hour time frame.
Therefore, the upcoming reports on US employment and manufacturing are highly anticipated. This has contributed to the market being hotter than ever. The price increase is expected to reach $3,385, if the Fed signals monetary policy easing. What do you think about this? Do you agree with me?
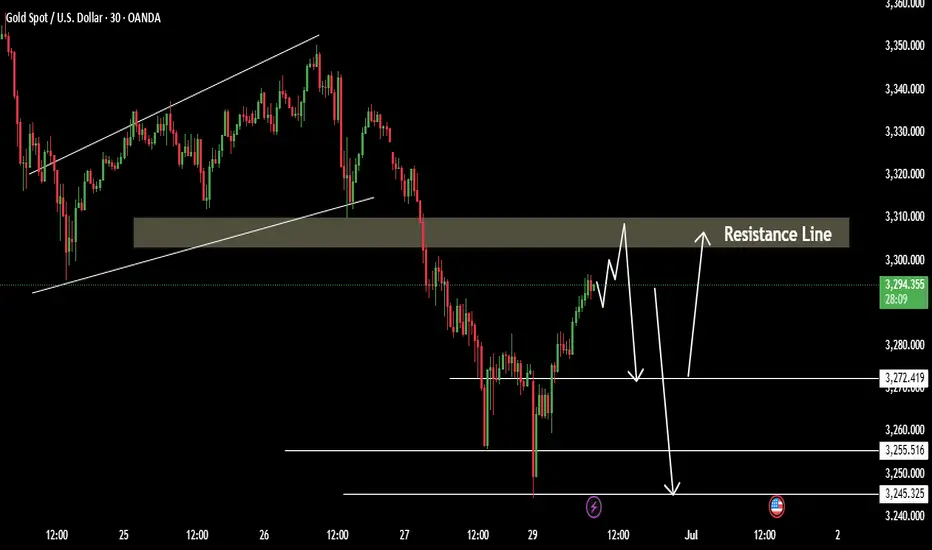
Gold has shown signs of recovery DowntrendXAUUSD Gold Technical Outlook – June 30
Gold has shown signs of recovery at the start of the session, largely supported by a weaker U.S. dollar. However, the upside remains uncertain as long as the price stays below key resistance zones.
Gold is still in a downtrend Price action suggests a potential correction phase Key resistance area lies between 3294 – 3312 Failure to break this zone keeps the bearish pressure intact.
If the price fails to hold above 3272, further downside targets are
Key Levels:
Resistance: 3294 / 3305 / 3312
Support: 3272 / 3255 / 3245
You may find more details in the chart Ps Support with like and comments for better analysis share with you.
GOLD Short From Resistance! Sell!
Hello,Traders!
GOLD made a bullish
Rebound from the support
Below just as we predicted in
Our previous analysis but
Gold is still trading in the
Downtrend as the lower lows
And higher highs are intact
And the structure is healthy
So after the price retested the
Horizontal resistance above
Around 3,310$ we are
Likely to see a further
Bearish move down
Sell!
Comment and subscribe to help us grow!
Check out other forecasts below too!
Disclosure: I am part of Trade Nation's Influencer program and receive a monthly fee for using their TradingView charts in my analysis.
Gold Bull Markets: Long-Term Overview & Current Market UpdateGold Bull Markets: Long-Term Overview & Current Market Update (2024–2025)
________________________________________
🏆 Historic Gold Bull Markets: Timeline & Stats
1️⃣ 1968–1980 “Super Bull”
• Start/End: 1968 ($35) → 1980 ($850)
• Total Gain: ~2,330%
• Key Drivers:
o End of the gold standard (Bretton Woods collapse)
o Double-digit inflation, oil shocks
o Political/economic turmoil (Vietnam, stagflation)
• Correction:
o Nearly –45% drop (1974–1976)
• Recovery:
o Took years; massive rebounds afterward
2️⃣ 1999–2012 Bull Market
• Start/End: 1999 ($252) → 2012 ($1,920)
• Total Gain: ~650%
• Key Drivers:
o Commodities supercycle
o Emerging market demand
o US dollar weakness, financial crisis fears
• Correction:
o ~–30% during 2008 crisis, but fast recovery
• Recovery:
o Rebounded quickly after 2008, then peaked in 2011–12
3️⃣ 2016/2018–2027 (Current Cycle)
• Start/End: 2016/2018 ($1,050–$1,200) → ongoing ($3,500+)
• Key Drivers:
o Record central bank buying
o Persistent inflation & low real rates
o Geopolitical instability (Russia/Ukraine, China/US, etc.)
• Correction:
o Only –20% drawdown in 2022; quick recovery
o Broke 13-year technical “cup-and-handle” base in 2024
________________________________________
📊 Current Bull Market Stats (2025) – At a Glance
Metric 1968–80 Super Bull 1999–2012 Bull 2018–2025 Current Bull
🚀 Total Gain ~2,330% ~650% ~200% so far
⏲️ Duration 12 years 13 years 7–9 years so far
💔 Max Drawdown –45% (1974–76) –30% (2008) –20% (2022)
🏦 Central Bank Role Moderate Emerging Dominant
📉 Correction Recovery Years 4 years Months
🏛️ Technical Pattern Secular breakout Multiple peaks 13-yr base breakout
________________________________________
📈 Top 10 Stats of the Current Gold Bull Market (2025):
1. Gold Price:
o ~$3,338–$3,364/oz; ATH > $3,500 in April 2025
2. Year-to-Date Gain:
o +29% YTD (2025); +30% in 2024
3. Central Bank Demand:
o 1,000 tonnes bought for 4th straight year; reserves near records
4. Inflation Hedge:
o Strong negative correlation with real yields; safe-haven demand up
5. Gold vs S&P 500:
o Gold +27% YTD; S&P 500 up only ~2%
6. Jewelry Demand:
o Down –9% in 2024, projected –16% in 2025 (high prices suppress demand)
7. Gold-Silver Ratio:
o Now ~94 (down from 105); silver catching up
8. Record Closes:
o Over 40 daily record closes in 2025; price consolidating near highs
9. Technical Breakout:
o 13-year “cup-and-handle” breakout (March 2024)
10. 2025 Forecasts:
• Range: $3,600–$4,000 by Q2 2026; some see $4,500+ if risks persist
________________________________________
🔄 How This Bull Market Stands Out
• Dominance of Central Banks:
Central banks are setting the pace—record demand, making gold a reserve anchor again.
• Faster Recovery:
Corrections are less severe, recoveries are quick (months, not years).
• Synchronized Rally with Equities:
Rare for gold and stocks to hit highs together—shows systemic confidence in gold.
• Technical Breakout:
13-year base break signals powerful, long-term momentum.
• Future Outlook:
Targets as high as $7,500/oz (650% from cycle lows) possible by 2026/27, if historical analogs play out.
________________________________________
⭐️ Recommended Strategy (2025 and Beyond)
• BUY/HOLD/ACCUMULATE on Dips:
Favor physical gold, gold ETFs (GLD), and miners (GDX).
• Physical Over Paper:
Preference for allocated, physical bullion amid rising counterparty risks.
• Diversify with Miners/Silver:
Gold-silver ratio suggests silver may offer leverage; quality miners benefit in the latter stage of bull runs.
• Long-Term Perspective:
Anticipate volatility, but higher highs are likely if macro themes persist.
________________________________________
🧭 Summary Table: Historic vs Current Bull Markets
Feature 1968–80 1999–2012 2016/18–2027
Total Gain 2,330% 650% 200%+ (so far)
Duration 12 yrs 13 yrs 7–9 yrs (so far)
Correction –45% –30% –20%
Main Buyer Retail Funds Central Banks
Pattern Parabolic Cyclical Cup & Handle
Key Risks Inflation USD/credit Inflation, war, geopolitics
________________________________________
Key Takeaways
• Gold’s current bull market is distinguished by relentless central bank demand, robust technical momentum, and swift recoveries from corrections.
• The macro backdrop—persistent inflation, global uncertainty, and sovereign de-dollarization—supports an extended cycle.
• Expectations for $4,000+ gold in the next 12–24 months are widely held, with even higher targets in a true global crisis.

Gold's rally has not reversed yet? The consolidation pattern hasTechnicals:
Short-term risks remain skewed to the downside as the momentum of the relative strength index (RSI) and the moving average convergence divergence indicator (MACD) weakens. The RSI hit a new low below the neutral 50 mark. If short pressure intensifies in the next few trading days, gold prices may retest the upper track of the previous falling channel at 3215, followed by the rising support line from October 2024 at 3150. If it falls below this level, the decline may accelerate towards the psychological level of 3000, or even lower to 2970.
On the upside, if a strong catalyst pushes gold to rebound above the 20-day and 50-day moving averages (currently 3320-3350), the next resistance level may appear in the 3400-3435 range. A decisive close above this boundary may pave the way for gold prices to move towards 3500, or test resistance near 3530, and then may target the 3600 level.
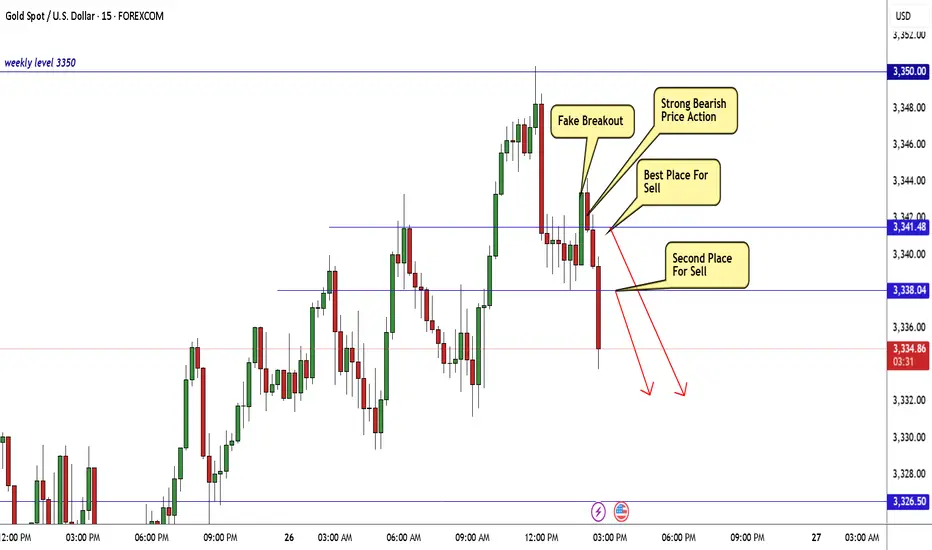
Overall, despite the weakening technical indicators, gold has not completely lost its bullish reversal potential. As long as the price remains within the sideways structure above 3150, the downward pressure may still give rise to a "buy on dips" strategy.
Gold Breakout Done New Short Entry Valid To Get 200 Pips !Here is my opinion on gold at he moment , in 15 mins T.F wr have a fake breakout but 3343.00 forced the price to go down which is a great res for this pair and we have avery good bearish price action and good closure below my res level 3341.00 so it`s my num 1 place to enter a sell trade if the price go back to retest it , and if not , 3383.00 will be my best place to sell it .
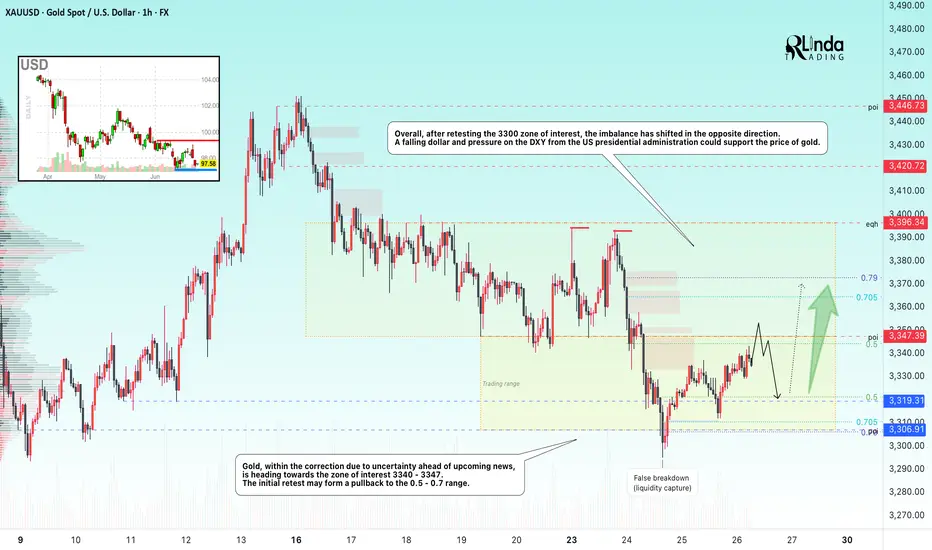
GOLD → Within range. Retest resistance at 3347FX:XAUUSD continues to correct after a false breakdown of support at 3300. Due to uncertainty, the price may remain in the range of 3300-3340 for some time.
Gold is fluctuating amid a weak dollar and uncertainty over Fed rates. Gold is struggling to hold on after rebounding from weekly lows, despite the US dollar falling to multi-year lows. Pressure on the dollar has intensified due to Trump's criticism of the Fed and rumors of a possible replacement for Powell. However, gold is limited in its growth due to a pause in geopolitical tensions and hawkish signals from the Fed chair. Investors are awaiting key macro data from the US (e 12:30 GMT Durable goods orders, GDP, Initial Jobless Claims) and especially the PCE inflation report on Friday.
Technically, the focus is on key areas of interest: 3300, 3306, 3340, 3347. Until strong news emerges, an intraday trading strategy should be considered.
Resistance levels: 3347, 3357
Support levels: 3320, 3307, 3300
Technically, a false breakout of resistance at 3347 and a retest of the local liquidity zone at 3320-3307 are possible before growth continues for the reasons mentioned above. Targets could be 3347, 3364, 3372, and 3396.
Best regards, R. Linda!
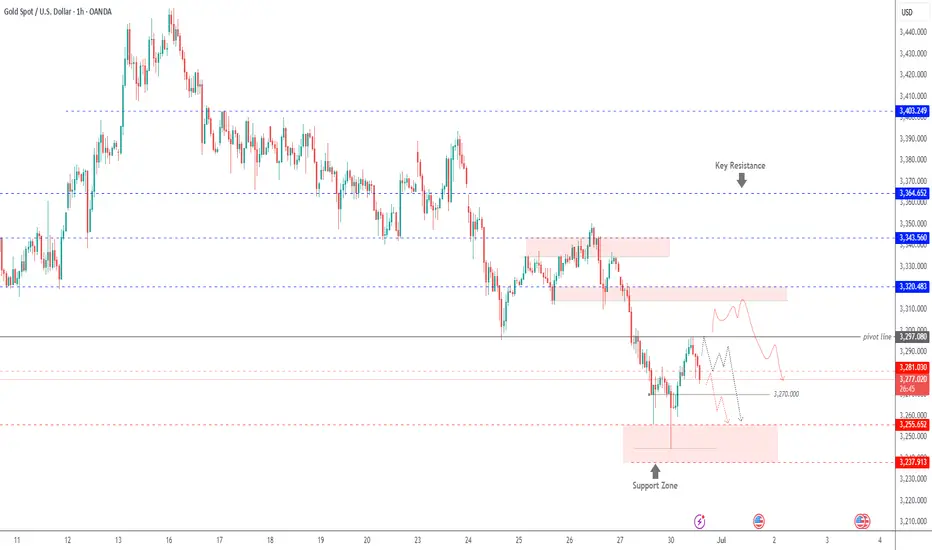
GOLD | Pressure Below Pivot – Eyes on 3255 and 3238GOLD | Market Outlook
The overall momentum remains bearish as long as the price trades below the pivot line at 3297.
Currently, the price is attempting to stabilize below 3281, suggesting a potential continuation of the downtrend toward 3270 and 3255.
A confirmed 1H close below 3255 would further strengthen the bearish scenario, opening the way toward 3238.
Sell Setup:
Valid if 1H candle closes below 3281→ Targets: 3270 and 3255
Buy Setup:
Valid if 1H candle closes above 3297→ Targets: 3314
Key Levels:
• Pivot: 3281
• Support: 3255 / 3238
• Resistance: 3297 / 3314
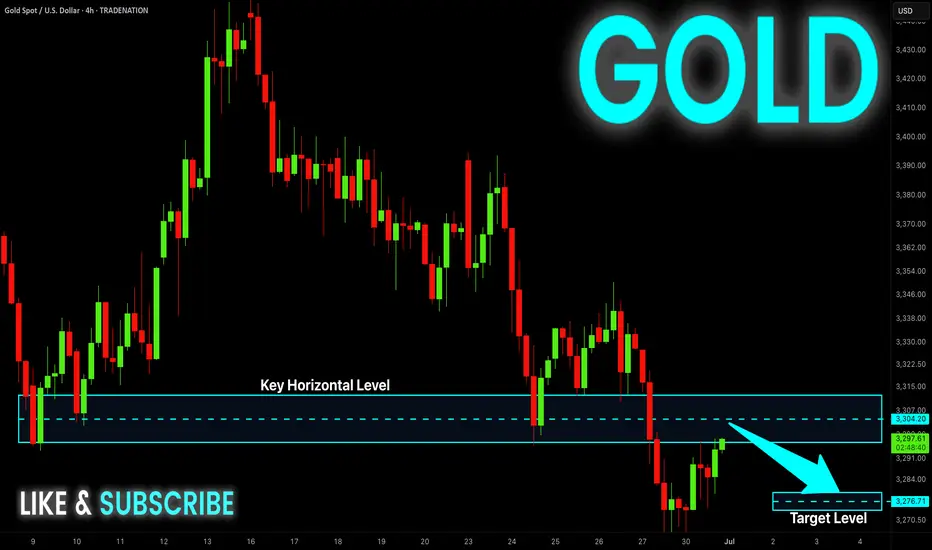
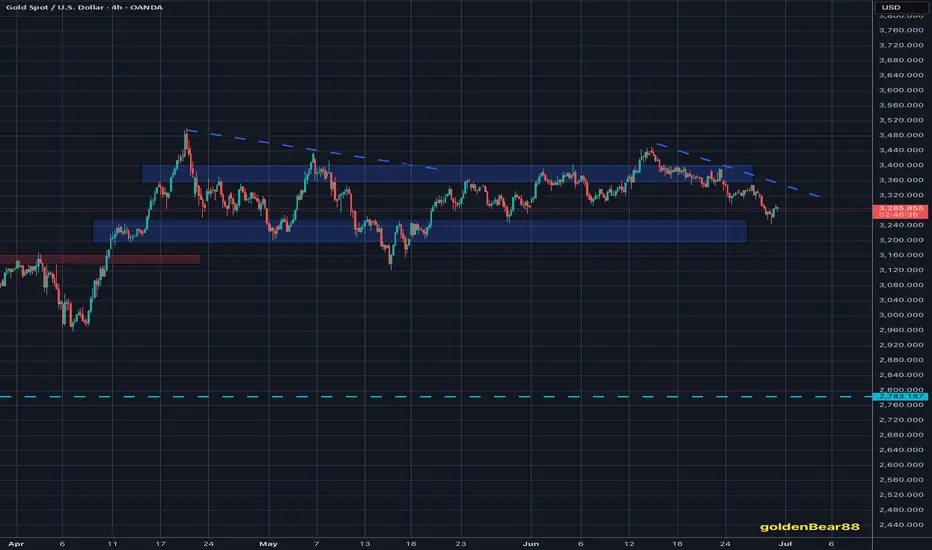
XAUUSD Under Pressure: What the Market Is Telling UsGold (XAUUSD) is currently trading with a clear bearish bias, showing sustained downside momentum on the 4H timeframe 🕒. Price has been gradually stepping lower, and the structure continues to favor the sellers.
As expected for early in the week, there’s been a bit of choppy movement ⚖️, but the overall sentiment remains weak. Unless we see a strong shift or catalyst, I’ll be maintaining a bearish outlook.
🧭 I’m watching for price to revisit key resistance levels, and if we get a clean break and retest 🔄, I’ll be looking for potential short setups from areas of previous demand that flip into resistance.
🌐 Keep an eye on broader risk sentiment — if NASDAQ starts pulling back or DXY strengthens, it could fuel further downside in gold.
As always, this is not financial advice, but the detailed breakdown is available in the latest video 🎥.

Excellent start of E.U. sessionAs discussed throughout my yesterday's session commentary: "My position: I am Highly satisfied with my Profit and will take early weekend break, not catching a Falling knife."
I have monitored the Price-action from sidelines throughout Friday's session as explained above however mid E.U. session I have engaged two #100 Lot Buying orders on #3,278.80 few moments ago and closed both of my Scalps on #3,285.80 with excellent Profit.
Quick update: No Swing orders today, only aggressive Scalps similar to Scalp orders I mentioned above from my key re-Buy points. If #3,300.80 is recovered, newly formed Bullish structure will push for #3,313.80 and #3,327.80 test. If #3,300.80 benchmark is preserved, I will still keep Buying (Scalp only however). I will have Gold's major move revealed after today's session.
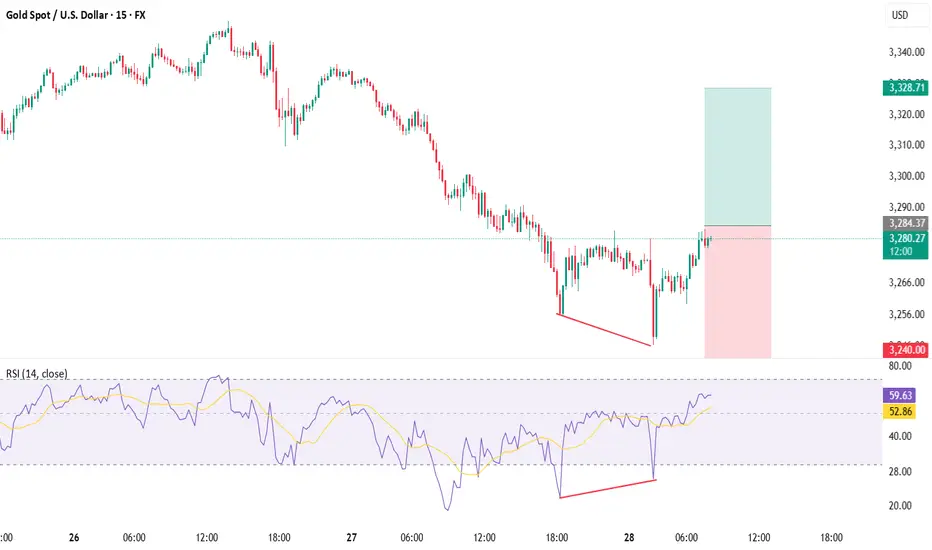
XAUUSD📉 The Setup: Bullish Divergence on XAUUSD (15m/30m)
Buy only on Breakout
🔍 Observation:
On the 30-minute timeframe, price made a lower low while the RSI indicator printed a higher low — classic sign of bullish divergence 🔄.
💡 Translation: Bears are losing steam! Bulls may be preparing to charge in! 🐂⚡
📊 Trade Plan – Long Entry
DeGRAM | GOLD under the resistance area📊 Technical Analysis
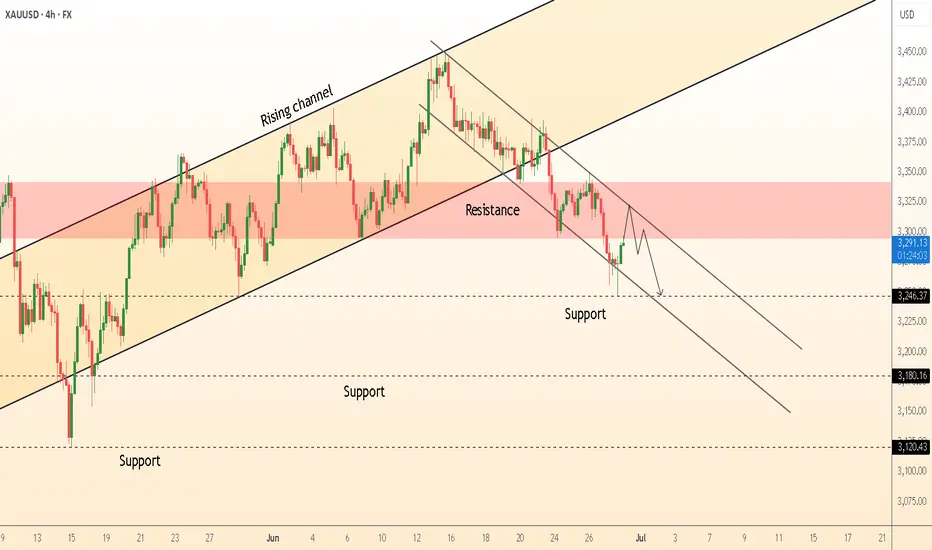
● Price broke the long-standing rising-channel floor, then formed a clean bear flag inside a fresh down-sloping channel; the flag’s ceiling coincides with the 3 300-3 310 supply band.
● Lower-high sequence and confluence of flag top with former support turned resistance favour continuation toward the mid-channel / fib pivot at 3 246, next 3 180.
💡 Fundamental Analysis
● Friday’s hotter US core-PCE and Fed governor Bowman’s “no cuts in 2025” comment lifted 2-yr yields above 4.80 %, firming the DXY and draining flows from non-yielding gold.
✨ Summary
Sell 3 290-3 305; hold below 3 310 targets 3 246 → 3 180. Short bias void on an H4 close above 3 310.
-------------------
Share your opinion in the comments and support the idea with a like. Thanks for your support!
MULTIPLE TIME FRAME ANALYSIS, gather data to make good decisionsAll the information you need to find a high probability trade are in front of you on the charts so build your trading decisions on 'the facts' of the chart NOT what you think or what you want to happen or even what you heard will happen. If you have enough facts telling you to trade in a certain direction and therefore enough confluence to take a trade, then this is how you will gain consistency in you trading and build confidence. Check out my trade idea!!
tradingview.sweetlogin.com

Gold in a Shifting Macro Landscape Fundamentals First: Why is Gold Falling While DXY is Too?
Normally, gold and the U.S. dollar share an inverse relationship (which means, when DXY weakens, gold rises). But recently, this correlation has broken down, and that divergence is a loud macro signal.
What’s Happening:
Trade Deal Optimism:
Headlines suggest the U.S. is nearing a resolution with China and other partners. With reduced geopolitical tension, investors are reallocating from safe-haven assets like gold into risk-on trades like equities and crypto.
Iran-Israel Ceasefire:
The temporary cooling of conflict has revived risk appetite. Traders are rotating out of war hedges (like gold and oil) and into tech, growth, and EM plays.
Real Yields Still Elevated:
Despite a softening Fed narrative, U.S. real yields remain positive, keeping pressure on non-yielding assets like gold. The fact that gold couldn't rally even as the 10-year note softened post-Moody's downgrade could be telling.
My Perspective:
This is the first clear signal in months that geopolitical hedging may have peaked. When gold decouples from its safe-haven narrative despite macro uncertainty, that often precedes a structural rotation phase, especially if institutional flows favor equities.
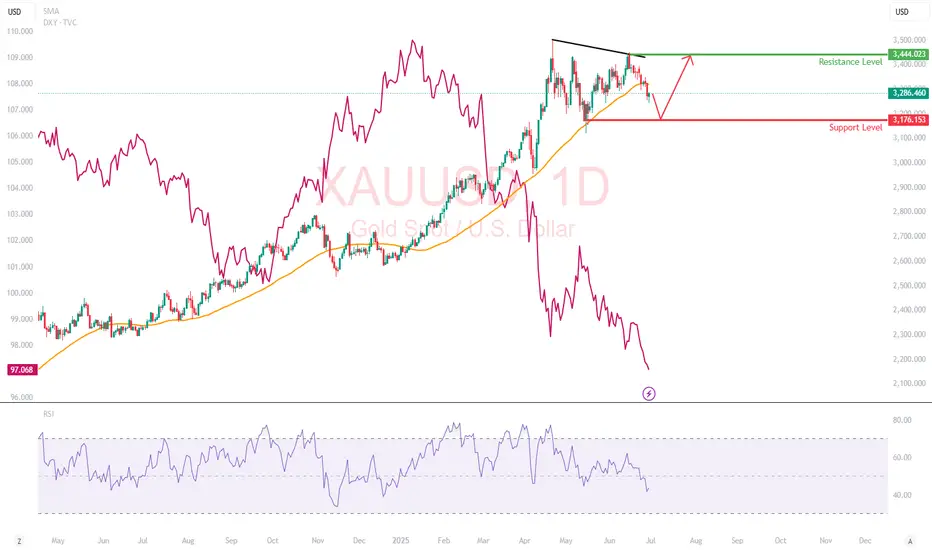
Technical Breakdown
Gold has broken below its 50-day SMA at $3,322 and is trading in the lower third of its 3-month range. While the daily candles show increasing selling pressure, especially on lower highs (a sign of weakening bullish momentum)
RSI : Falling toward 40, with no bullish divergence yet.
Support Level : $3,176: Previous swing low
Resistance Level : $3,444: previous swing high
What This Move Might Be Telling Us
When gold sells off on dollar weakness and geopolitical calm, the market isn’t just relaxing. It is rotating. The de-grossing of gold-heavy hedges: Some hedge funds may be taking profit on gold-heavy exposure from Q1’s rally.
Rise of risk appetite despite cracks: Markets are forward-pricing trade peace and earnings resilience, possibly too early. Gold might not be in trouble, but it’s on the bench. Unless something reignites fear (e.g., Fed policy mistake, Middle East flashpoint, or economic shock), capital may stay elsewhere.
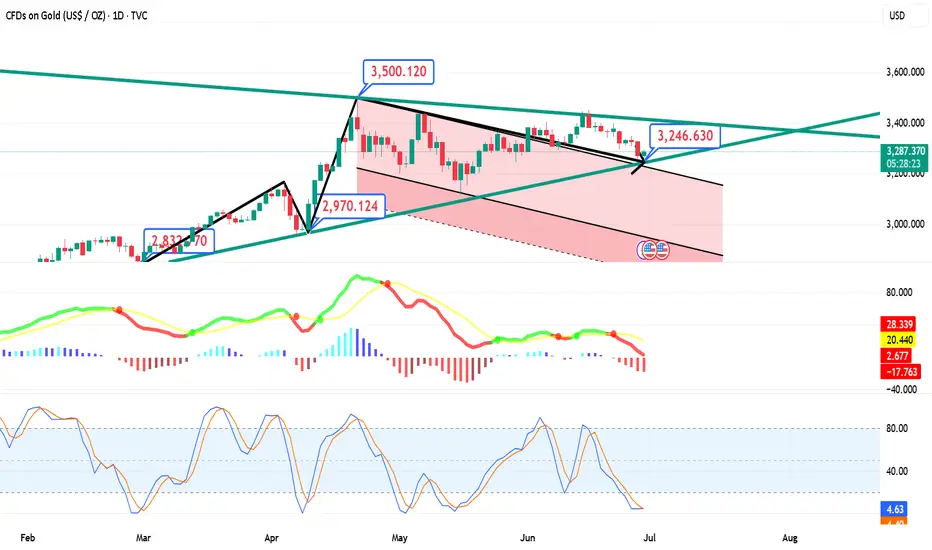
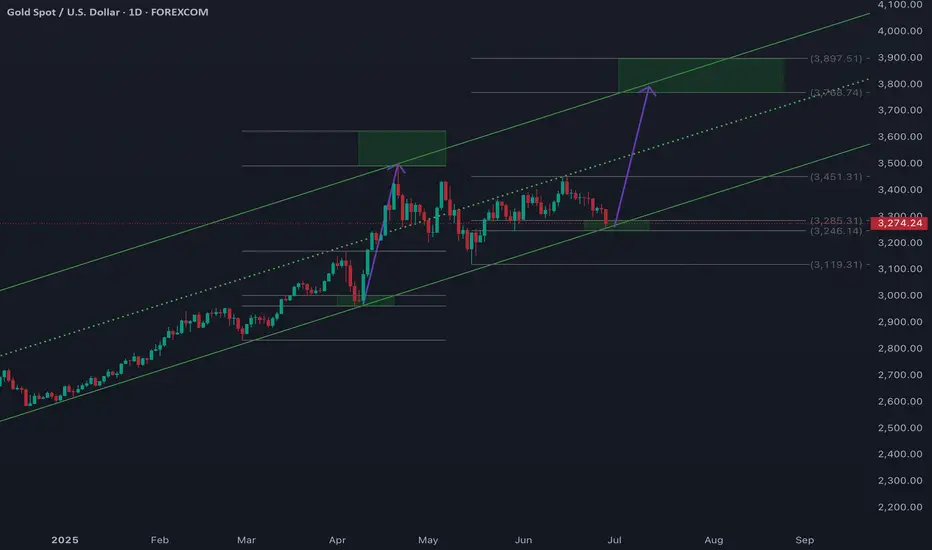
XAUUSD/ 1D LONGCombining the channel pattern analysis and Sk System, will we see such a move in GOLD? Will the history repeat itself?
Good Luck
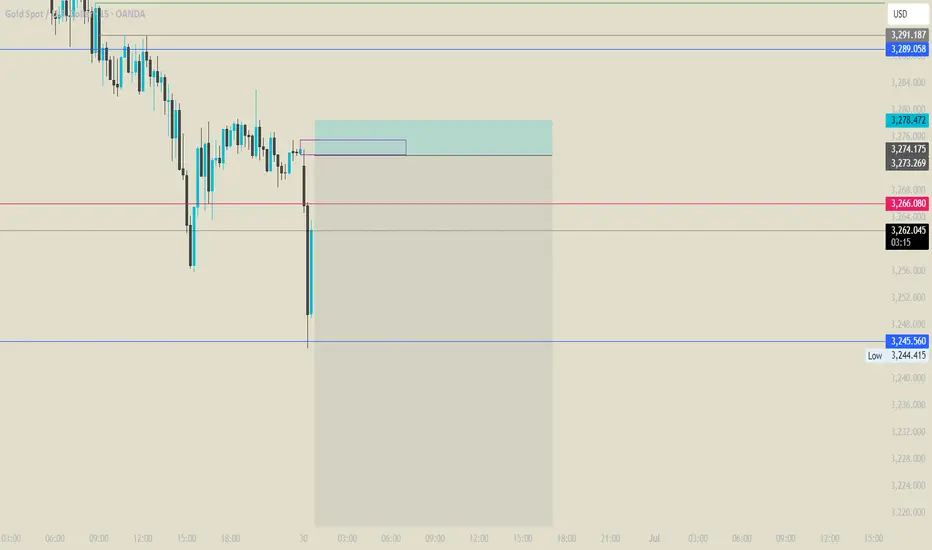
Gold short from ltf3270 is a nice area for a short.
A very nice setup with a great risk reward ratio.
Let us see what this week brings on.
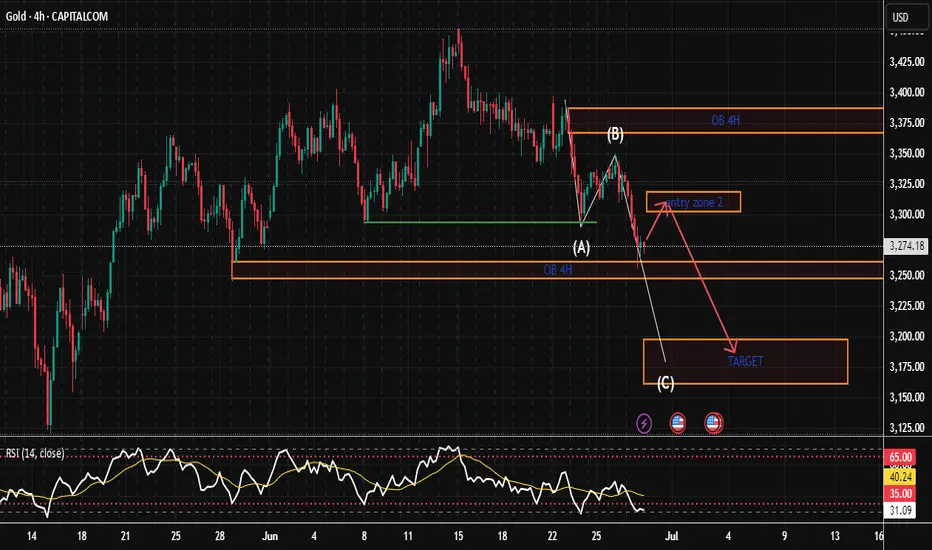
GOLD (XAU/USD) Breakdown Imminent: SK System Signals Further DowThe 4-hour chart for GOLD (XAU/USD) shows the price is currently testing a critical support zone around $3,224.18, which aligns with previous swing lows and a confluence of technical factors. The SK System, which combines price action, support/resistance levels, and momentum indicators, highlights the following key observations:
Support Zone: The price has reached a strong historical support level near $3,224.18, where buyers have previously stepped in. This zone is further reinforced by the nearby psychological level of $3,200.00.
Prediction:
Bearish Scenario: A decisive close below $3,224.18 with increasing volume may extend the downtrend toward $3,150.00 or lower.
Weekly Outlook | XAUUSD June 30 – July 4, 2025Welcome to a new trading week. Let’s break down the gold chart from a clean, high-timeframe perspective. No setups, no noise – just structure, momentum, and zones that matter.
🌐 Macro Overview
This week concentrates all key USD events into one tight window:
Tuesday: ISM Manufacturing + Fed Chair Powell speech
Wednesday: ADP Employment
Thursday: NFP, Unemployment Rate, ISM Services PMI
Friday: US holiday – markets closed
📌 This means liquidity and momentum will peak by Thursday, then fade into the weekend.
Expect gold to stay in range until macro data breaks direction.
🧠 Weekly Structure & Momentum
Gold remains in a bullish macro structure, but price is hesitating below 3300.
Last two weekly candles printed long upper wicks with no body follow-through – clear sign of distribution, not continuation.
We’re still trading above the 21EMA Weekly, which maintains the uptrend’s integrity.
RSI (14): sitting at ~59 → no real momentum breakout, just consolidation.
📌 The chart is not reversing, but it’s also not trending anymore. We’re in a decision zone.
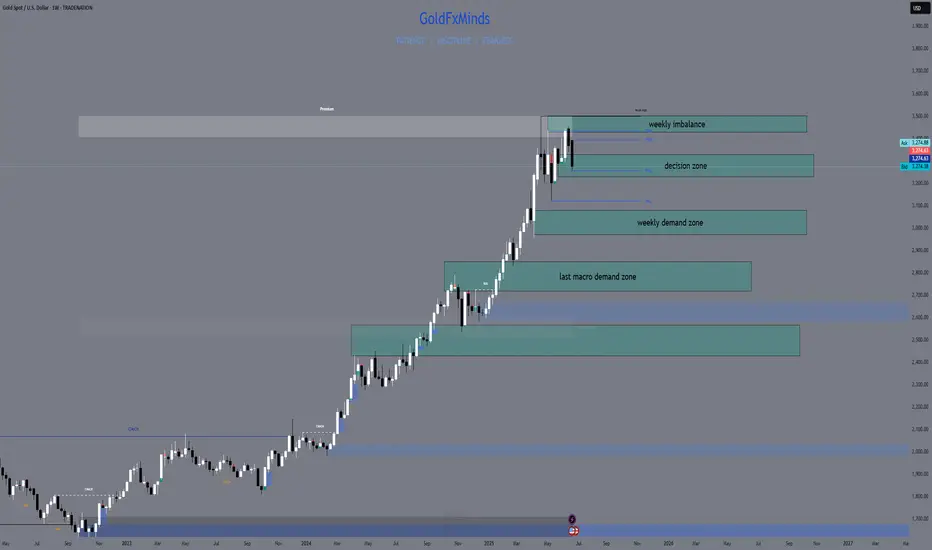
📍 Key Weekly Areas of Interest
3430 – 3500 → W1 Imbalance + March High Sweep
This is a wide weekly imbalance left unfilled since March, paired with the prior 2024 swing high. 3500 is also a psychological round number. If price pushes into this area, it becomes a liquidity target, not an entry – unless a clear rejection forms.
3330 – 3230 → Weekly Decision Block
This is the current consolidation range. It includes multiple W1 candle bodies, wick highs/lows, and volume cluster.
– Weekly close above 3330 = likely bullish continuation toward 3430+
– Weekly close below 3230 = confirms weakness and opens path to the next major support
3080 – 2970 → Weekly Demand + Fib 38%
Clean block of accumulation from April–May, aligned with the 38.2% retracement of the 2024 rally. This is where we’d expect institutional buying interest on a deeper pullback.
A weekly candle with a long wick into this zone + strong close would reset bullish structure.
2850 – 2720 → Last Macro Demand Zone
This zone includes the 50EMA weekly, a weekly FVG from late 2023, and unmitigated demand before the full 2024 breakout. If price ever gets here, we’re no longer in a healthy uptrend – we’re correcting structurally. But this zone will matter if that happens.
🧭 Summary & Expectations
Gold is still inside a large weekly range.
Until we break above 3330 or below 3230, it’s just consolidation on the HTF.
Thursday’s data will decide the candle.
Don’t predict direction — let the W1 close speak.
📌 Final Notes:
Above 3330 = room toward 3430–3500
Below 3230 = risk opens toward 3080–2970
Inside = no directional edge — stay reactive, not biased
🔥 If you enjoy this clean breakdown: hit that 🚀, follow & drop your thoughts below!
Stay sharp traders — we execute with precision.
— GoldFxMinds
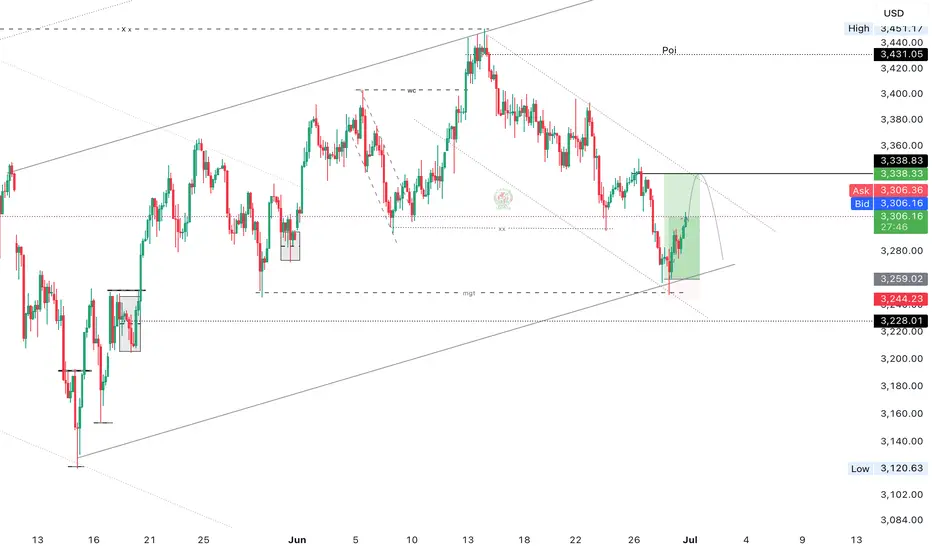
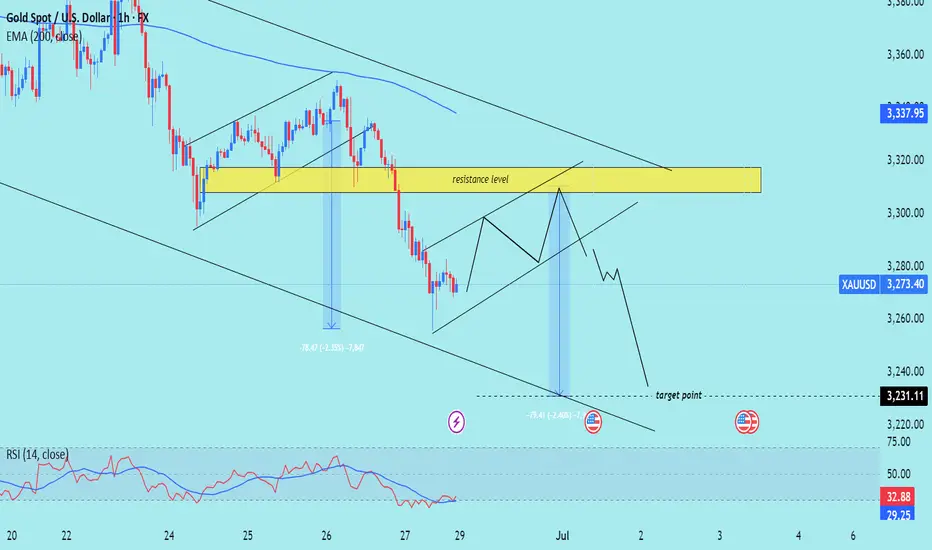
XAU/USD) bearish Trand analysis Read The captionSMC trading point update
Technical analysis of (XAU/USD) on a short-term timeframe, incorporating several key tools and concepts:
---
Overview of the Analysis
Price Level (Current): Around $3,273.40
EMA 200 (Blue Line): Around $3,337.95 (signaling broader trend)
Resistance Zone (Yellow Box): Between approximately $3,300–$3,320
Support/Target Zone: Around $3,231.11
RSI (Relative Strength Index): At 32.88, which is near oversold territory (below 30)
---
Interpretation of Chart Structure
1. Descending Channel:
Price is moving within a downward-sloping channel.
Suggests a bearish trend is in play.
2. Resistance Level (Yellow Box):
Price is expected to retest this area and face resistance.
Confluence of a supply zone and upper trendline, reinforcing its strength.
3. Projected Price Action:
Price may climb back up into the resistance zone.
A rejection is anticipated, leading to another leg down.
The target is around $3,231.11, which matches previous measured moves.
4. Measured Moves (Blue Arrows):
Highlights historical price drops of ~79 points.
Repeating this pattern suggests symmetry and continuation.
5. RSI Indicator:
Currently at 32.88: nearing oversold, but not quite.
No clear bullish divergence, so price could drop further.
---
Trade Idea Summary
Bias: Bearish
Entry Zone: Near $3,300–$3,320 (resistance)
Target: Around $3,231.11
Invalidation: If price breaks and holds above $3,337–$3,340 (EMA 200 and channel breakout)
Mr SMC Trading point
---
Caution/Considerations
Watch for false breakouts above the resistance zone.
Monitor RSI for potential bullish divergence that could invalidate the downside.
Be cautious around the U.S. economic news event icon, which might cause volatility.
plesse support boost 🚀 this analysis)
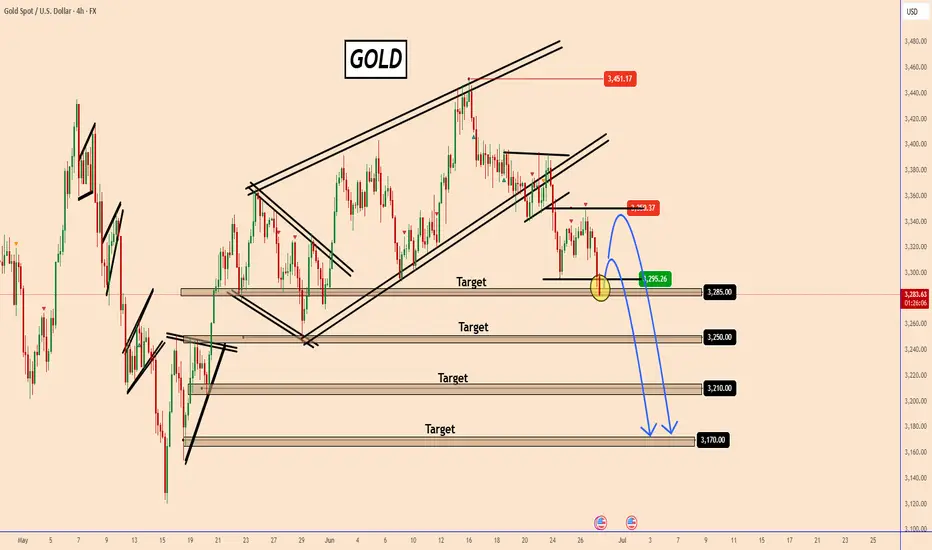
Gold Slides Further as Market Risk Eases and Inflation LoomsGold Slides Further as Market Risk Eases and Inflation Looms
Gold continues to extend its downward momentum for the second consecutive week, sliding from 3451 to 3283—a decline of nearly 4.85% in just 10 days.
Today, all eyes are on the U.S. inflation data. While the broader market reaction remains uncertain, gold appears particularly vulnerable to further downside pressure.
The temporary ceasefire between Israel and Iran, coupled with advances in the U.S.-China trade talks, has eased geopolitical tensions, diminishing the immediate appeal of safe-haven assets like gold.
Even if prices rebound toward 3300 or even 3350 in a deeper pullback, the overall trend remains bearish.
PS: This analysis assumes normal market conditions and excludes the influence of potential manipulation.
You may find more details in the chart!
Thank you and Good Luck!
PS: Please support with a like or comment if you find this analysis useful for your trading day
Previous analysis:
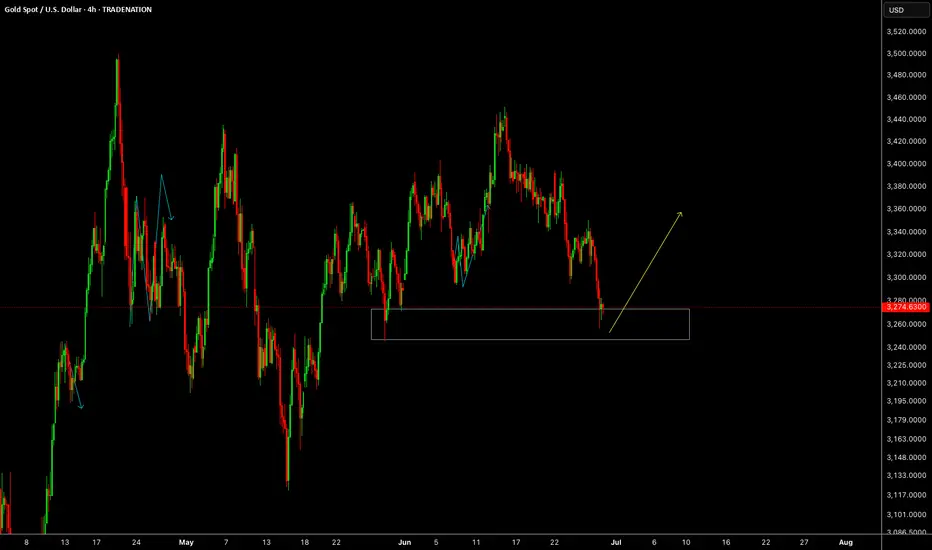
GOLDGOLD is about to get ready for a push up, keep an eye from the reaction zone for buy setups.
Disclosure: We are part of Trade Nation's Influencer program and receive a monthly fee for using their TradingView charts in our analysis.