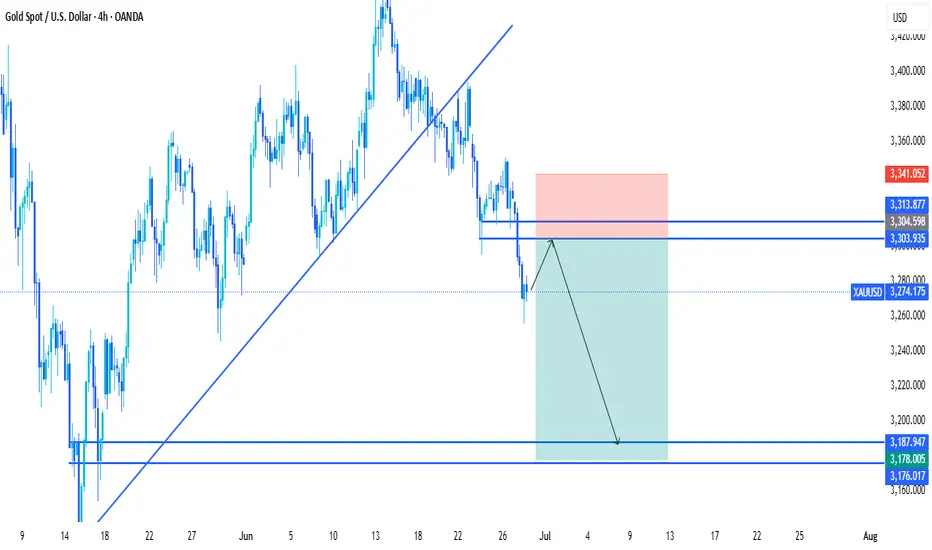
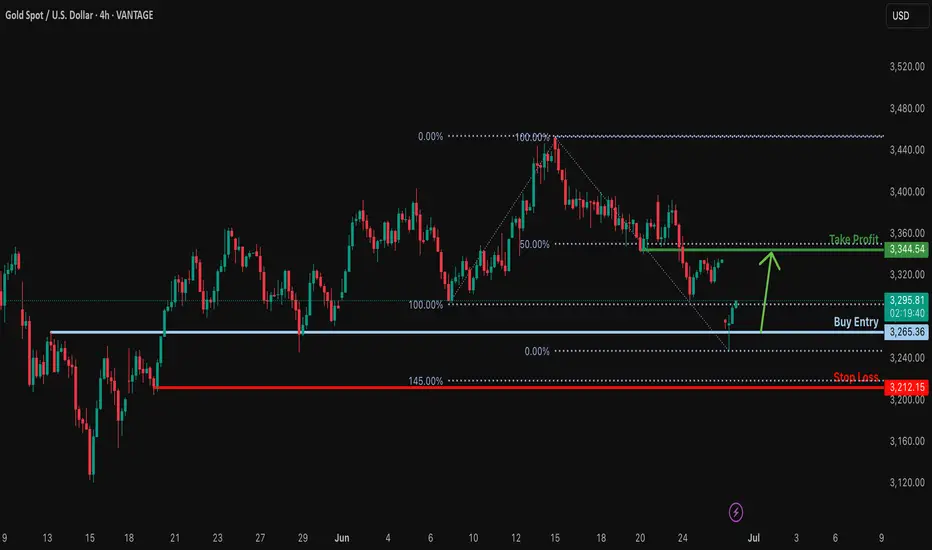
Bullish bounce off major support?XAU/USD has bounced off the support level which is an overlap support and could rise from this level to our take profit.
Entry: 3,265.39
Why we like it:
There is an overlap support level.
Stop loss: 3,121.15
Why we like it:
There is a pullback support level that aligns with the 145% Fibonacci extension.
Take profit: 3,344.54
Why we like it:
There is a pullback resistance that lines up with the 50% Fibonacci retracement.
Enjoying your TradingView experience? Review us!
Please be advised that the information presented on TradingView is provided to Vantage (‘Vantage Global Limited’, ‘we’) by a third-party provider (‘Everest Fortune Group’). Please be reminded that you are solely responsible for the trading decisions on your account. There is a very high degree of risk involved in trading. Any information and/or content is intended entirely for research, educational and informational purposes only and does not constitute investment or consultation advice or investment strategy. The information is not tailored to the investment needs of any specific person and therefore does not involve a consideration of any of the investment objectives, financial situation or needs of any viewer that may receive it. Kindly also note that past performance is not a reliable indicator of future results. Actual results may differ materially from those anticipated in forward-looking or past performance statements. We assume no liability as to the accuracy or completeness of any of the information and/or content provided herein and the Company cannot be held responsible for any omission, mistake nor for any loss or damage including without limitation to any loss of profit which may arise from reliance on any information supplied by Everest Fortune Group.
XAUUSD trade ideas
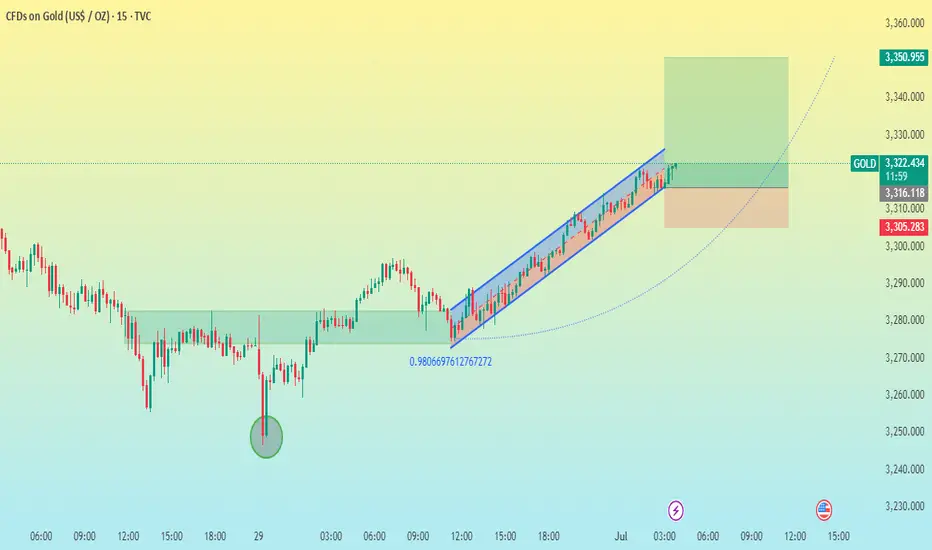
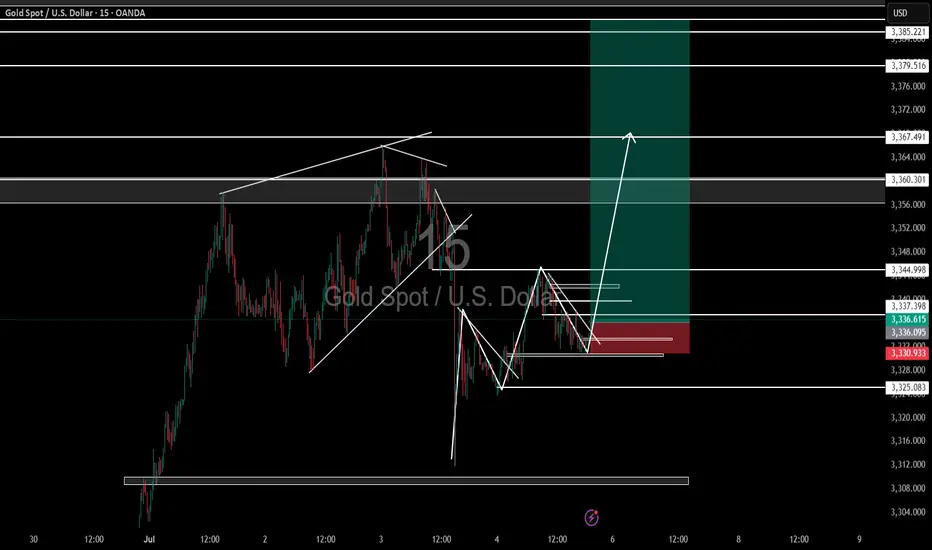
XAU/USD 15M CHART PATTERNHere's a breakdown of your XAUUSD (Gold vs USD) Buy trade setup:
---
🟢 Trade Type: Buy (Long)
Entry Price: 3321
---
🎯 Take Profit Levels:
1. TP1: 3330 (9 pips gain)
2. TP2: 3340 (19 pips gain)
3. TP3: 3350 (29 pips gain)
---
🔴 Stop Loss:
SL: 3305 (16 pips risk)
---
📊 Risk-Reward Ratios:
TP1: ~1:0.56
TP2: ~1:1.19
TP3: ~1:1.81
---
✅ Analysis:
The setup shows a moderate risk with potential for compounding gains.
Ensure there's enough momentum or support confirmation at or around 3321.
Your stop loss is fairly tight (16 pips) — consider volatility during news hours (like NFP or Fed announcements).
---
Would you like a chart analysis, help with position sizing, or automating this setup (e.g., for MetaTrader/TradingView)?
X1: GOLD/XAUUSD Long Trades Risking 1% to make 1.8%X1:
#XAUUSD/#GOLD Long Trades
GOLD/XAUUSD Long for day trade, with my back testing of this strategy, it hits multiple possible take profits, manage your position accordingly.
Risking 1% to make 1.8%
Note: Manage your risk yourself, its risky trade, see how much your can risk yourself on this trade.
Use proper risk management
Looks like good trade.
Lets monitor.
Use proper risk management.
Disclaimer: only idea, not advice
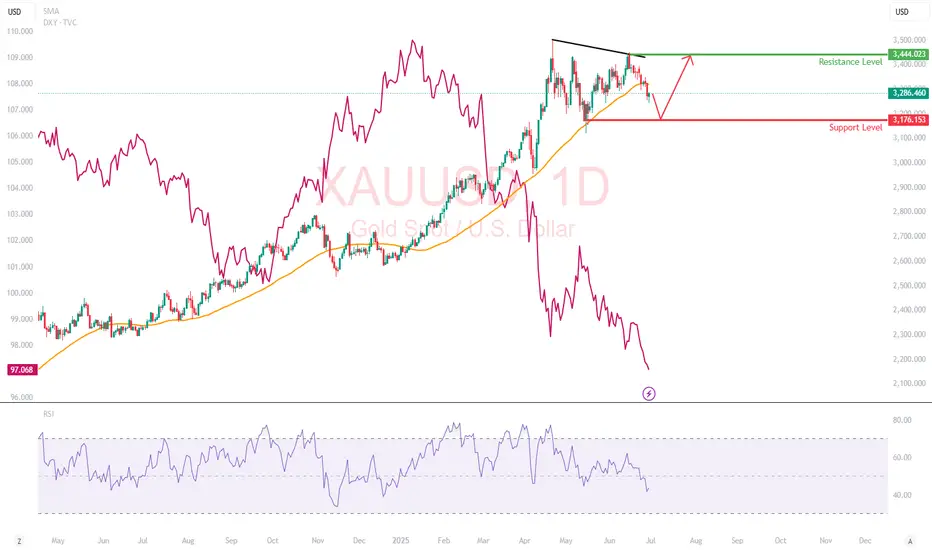
Gold in a Shifting Macro Landscape Fundamentals First: Why is Gold Falling While DXY is Too?
Normally, gold and the U.S. dollar share an inverse relationship (which means, when DXY weakens, gold rises). But recently, this correlation has broken down, and that divergence is a loud macro signal.
What’s Happening:
Trade Deal Optimism:
Headlines suggest the U.S. is nearing a resolution with China and other partners. With reduced geopolitical tension, investors are reallocating from safe-haven assets like gold into risk-on trades like equities and crypto.
Iran-Israel Ceasefire:
The temporary cooling of conflict has revived risk appetite. Traders are rotating out of war hedges (like gold and oil) and into tech, growth, and EM plays.
Real Yields Still Elevated:
Despite a softening Fed narrative, U.S. real yields remain positive, keeping pressure on non-yielding assets like gold. The fact that gold couldn't rally even as the 10-year note softened post-Moody's downgrade could be telling.
My Perspective:
This is the first clear signal in months that geopolitical hedging may have peaked. When gold decouples from its safe-haven narrative despite macro uncertainty, that often precedes a structural rotation phase, especially if institutional flows favor equities.
Technical Breakdown
Gold has broken below its 50-day SMA at $3,322 and is trading in the lower third of its 3-month range. While the daily candles show increasing selling pressure, especially on lower highs (a sign of weakening bullish momentum)
RSI : Falling toward 40, with no bullish divergence yet.
Support Level : $3,176: Previous swing low
Resistance Level : $3,444: previous swing high
What This Move Might Be Telling Us
When gold sells off on dollar weakness and geopolitical calm, the market isn’t just relaxing. It is rotating. The de-grossing of gold-heavy hedges: Some hedge funds may be taking profit on gold-heavy exposure from Q1’s rally.
Rise of risk appetite despite cracks: Markets are forward-pricing trade peace and earnings resilience, possibly too early. Gold might not be in trouble, but it’s on the bench. Unless something reignites fear (e.g., Fed policy mistake, Middle East flashpoint, or economic shock), capital may stay elsewhere.
Maintain range fluctuations during the day?Gold has maintained a volatile pattern recently. As the US market is closed today for Independence Day, the market volatility is expected to be limited, but the volatile market will continue, but the volatility range may change. Yesterday's gold price fell mainly due to the news, and this decline usually does not last too long. From a technical point of view, gold prices are supported near 3310-3300, which is the key support level today. It is worth noting that on Wednesday, gold prices were under pressure in the 3340-3350 area, and on Thursday, prices formed support in this range, indicating that the area is forming a top-bottom conversion. Therefore, 3340-3350 has become an important pressure level today. It is expected to fluctuate in the 3300-3340/3350 range during the day. The impact of news on gold prices is usually short-term. When the fundamentals and technical directions are consistent, price fluctuations will be more obvious. When the two are inconsistent, price fluctuations will weaken, but will not change the technical trend. The rebound pattern established at the beginning of the week is still valid. After a short-term shock, gold prices are expected to re-stand above 3345 and continue to maintain the rebound trend.
Gold sell off at premiumGold is at a premium price range.
Market instability and Iran war causing panic, buyers looking for discounted prices to go long.
The rule is to sell at premium and buy at discounts, last discount was seen at 3000 zone.
Gold trend remains bullishThe investment market will not simply move in the expected direction. The road to success is tortuous. Once it goes in the opposite direction, it will lose direction and enter a cycle. The same is true for the market. The trend is certain, but it will never simply move in the predetermined direction. There will be twists and turns during the period that will shake people's hearts. At this time, you need a good attitude to face it and not be affected by the short-term trend. This is why we have been firmly laying out the bands in the early stage, and the reason for successful profits. Only by keeping the original intention can we succeed. The investment market requires concentration and perseverance, and then to reap profits!
At present, the overall rise of gold remains stable. Although the fluctuation has narrowed compared with yesterday, it has not fallen sharply after touching the previous pressure level, indicating that the support below is still effective. Although affected by the ADP data, the technical pattern still maintains a bullish idea. For prudent operations, it is recommended to maintain a low-long strategy and pay attention to the short-term support area near 3333-3328 below. After retreating to this position and stabilizing, you can continue to arrange long orders, and focus on the support area near 3325-3315. If the daily level stabilizes above this position, continue to maintain the bullish rhythm of retreating low and long and following the trend. The upward target looks at the 3355-3360 area. If this area continues to be blocked, consider light positions to arrange short orders, and the target is bearish adjustment. If the market breaks through strongly and stabilizes, it is expected to test the 3370-3380 area. The specific strategy adjustment will be prompted dynamically during the intraday according to the real-time market, and steadily follow the bullish trend to grasp the benefits.
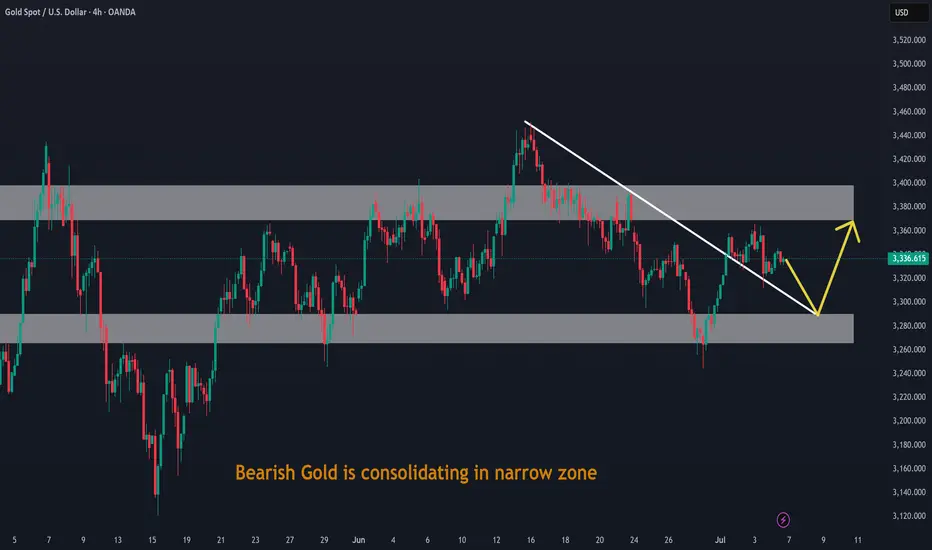
Bearish Gold is consolidating in narrow zoneBearish Gold is consolidating in narrow zone. Also it has broken Down trendline after retracing from demand zone.
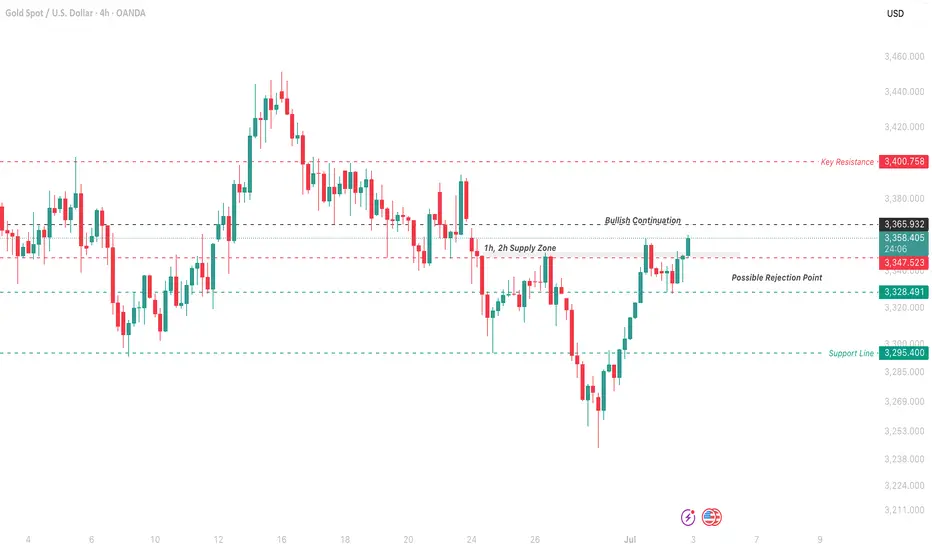
XAU/USD Struggles Below 3366, Bearish Pressure Remains ActiveXAU/USD Tests Supply Zone – Watching 3365 for Bullish Continuation
Gold is climbing amid global uncertainty and U.S. tariff concerns ahead of the July 9 deadline. But strong resistance is still in play.
The price is now testing the 1H–2H supply zone and has pushed past the pivot (3347–3352). A clear 4H close above 3365 will confirm bullish continuation.
Until then, upside remains capped. If price fails to sustain above 3365, a drop back toward 3328 and 3295 is likely.
Key Levels:
Resistance: 3352 – 3365 – 3400
Support: 3328 – 3295 – 3285
Pivot Zone: 3347–3352
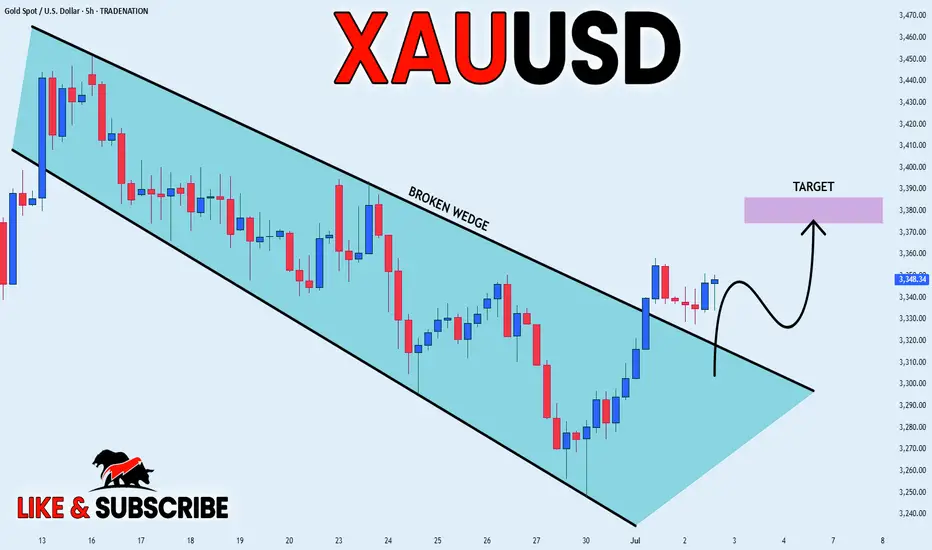
GOLD BROKEN WEDGE|LONG|
✅GOLD was trading in an
Opening wedge pattern and
Now we are seeing a bullish
Breakout so we are bullish
Biased and we will be expecting
A further bullish move up
LONG🚀
✅Like and subscribe to never miss a new idea!✅
Disclosure: I am part of Trade Nation's Influencer program and receive a monthly fee for using their TradingView charts in my analysis.
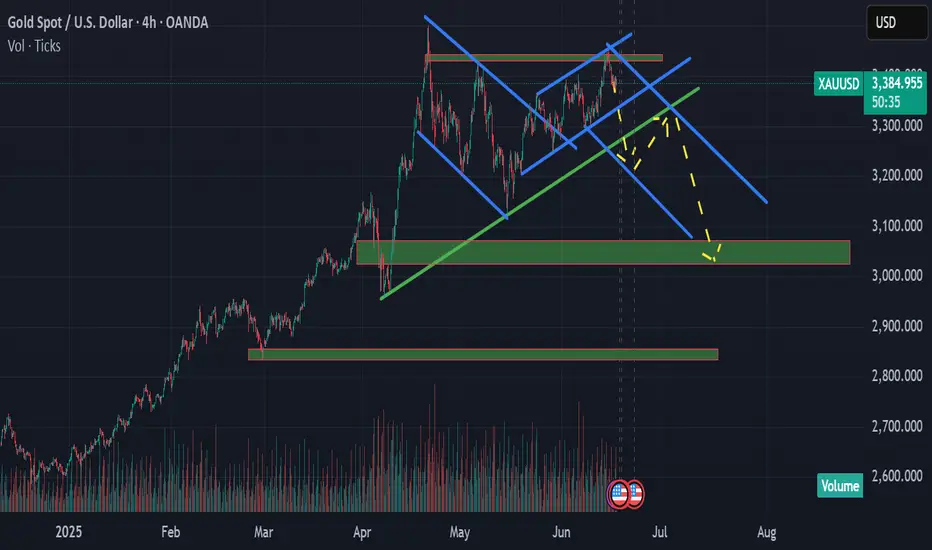
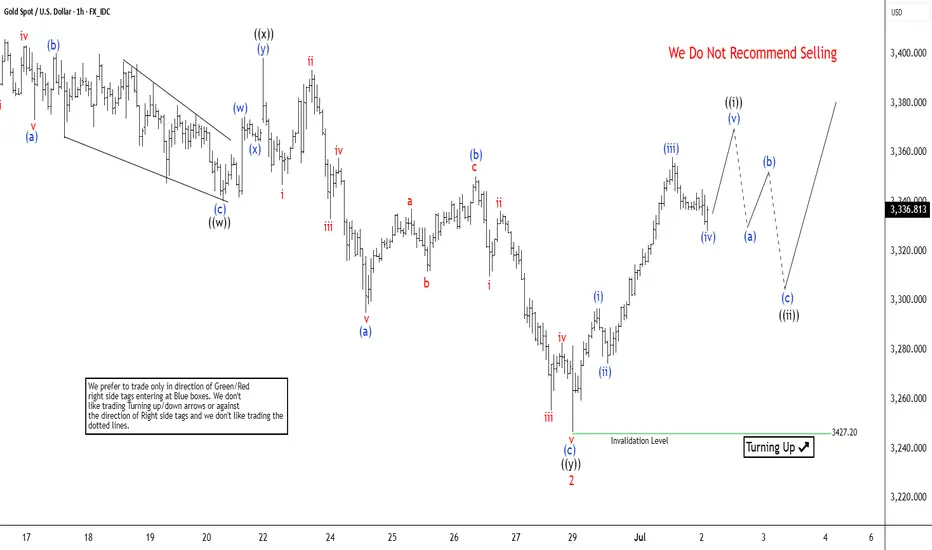
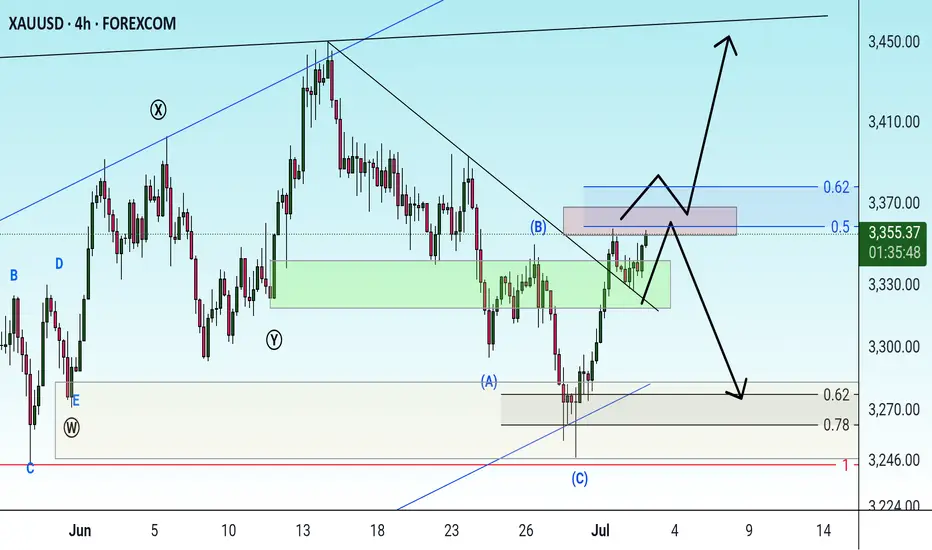
Gold (XAUUSD) Signals Bullish Trend ResumptionGold (XAUUSD) has exhibited a robust rally since its low on May 15, 2025. The metal formed a five-swing motive sequence that culminated in wave 1 at 3452.50 on June 16, 2025. This five-swing structure, characteristic of an impulsive Elliott Wave pattern, signals potential for further upside. The subsequent pullback in wave 2 appears to have completed at 3246.15, as illustrated in the accompanying 1-hour chart. The internal structure of wave 2 unfolded as a double-three Elliott Wave corrective pattern. Specifically, from the wave 1 peak, wave ((w)) declined to 3340.18. A corrective rally in wave ((x)) followed to 3398.35. The final leg, wave ((y)), concluded at 3246.15, marking the completion of wave 2 in the higher-degree structure.
Gold has since resumed its upward trajectory in wave 3. However, to confirm the bullish outlook and eliminate the possibility of a double correction, the price must decisively break above the wave 1 high at 3452.50. From the wave 2 low, wave (i) advanced to 3296.85. A shallow pullback in wave (ii) followed to 3274.41. Wave (iii) then propelled the metal to 3358.02. Based on the current structure, gold is expected to rally further in wave (v) to complete wave ((i)). Subsequently, a corrective pullback in wave ((ii)), likely unfolding in a 3, 7, or 11-swing structure, is anticipated from the June 30 low before the metal resumes its upward trend. In the near term, as long as the pivot low at 3246.15 remains intact, gold is poised to extend higher, supported by the impulsive momentum of the ongoing wave 3.
XAUUSD – Clear Sideways Movement in a Narrow Price ChannelXAUUSD is moving within a parallel price channel, fluctuating between the 3,320–3,345 zone. Both the EMA 34 and EMA 89 are running flat and close together, indicating a balanced market with no strong momentum in either direction.
Recent highs and lows have formed within a narrow range, reflecting indecision from both buyers and sellers. The latest bounce also stalled at the channel resistance, lacking the strength to break out.
As long as price remains below 3,345 and above 3,320, the sideways trend is likely to continue. During this phase, a range-trading strategy is preferred – selling near the top, buying near the bottom – while waiting for a clear breakout to determine the next directional move.
I win when I don't postLets see how it goes.
The consolidation that occurred because of the U.S holiday has led to giving buyers more power.
If not, I have a Stop Loss in place. We either win or we lose.
5th wave analysis + Market Structure support zone + Heads & shoulder(4H Timeframe) - we are currently in the right shoulder.
Risk what you can afford to lose
Check the trend Given the price behavior within the current resistance range, possible scenarios have been identified. It is expected that after some fluctuation within the current resistance range, a trend change will take place and we will witness the beginning of a downtrend. With consolidation above the resistance range, an uptrend will be likely.
XAUUSD/ 1D LONGCombining the channel pattern analysis and Sk System, will we see such a move in GOLD? Will the history repeat itself?
Good Luck
Gold accumulates and moves above 3350⭐️GOLDEN INFORMATION:
Gold prices declined by 0.80% on Thursday after a robust US Nonfarm Payrolls (NFP) report boosted the US Dollar, dampening expectations for a Federal Reserve rate cut at the upcoming July meeting. At the time of writing, XAU/USD is trading at $3,332, after reaching an intraday high of $3,365.
June’s employment data significantly outperformed forecasts and even surpassed May’s figures, reinforcing the resilience of the US labor market. Notably, the Unemployment Rate edged closer to the 4% mark, underscoring continued labor market strength. The upbeat report casts doubt on Wednesday’s softer ADP private-sector jobs data, which had shown a 33,000 drop in hiring.
⭐️Personal comments NOVA:
Gold price accumulates and recovers around 3350. Friday has no important news and bank holiday in US session, short-term recovery
⭐️SET UP GOLD PRICE:
🔥SELL GOLD zone: 3365- 3367 SL 3372
TP1: $3355
TP2: $3342
TP3: $3330
🔥BUY GOLD zone: $3311-$3313 SL $3306
TP1: $3325
TP2: $3338
TP3: $3350
⭐️Technical analysis:
Based on technical indicators EMA 34, EMA89 and support resistance areas to set up a reasonable BUY order.
⭐️NOTE:
Note: Nova wishes traders to manage their capital well
- take the number of lots that match your capital
- Takeprofit equal to 4-6% of capital account
- Stoplose equal to 2-3% of capital account
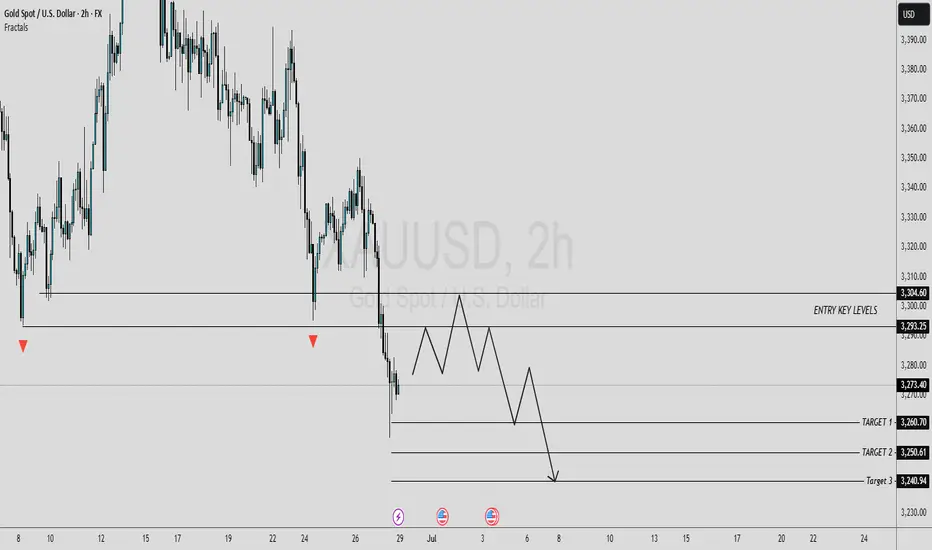
#XAU/USD SELL TRADE SETUP [SHORT]In this analysis we're focusing on 2H timeframe. As we know, Gold is moving in a strong bearish trend. The best selling zone is 3295 - 3305 key levels area. If gold encounters rejection from this zone, we can anticipate a potential decline in price towards its targeted levels.
Target 1:3260
Target 2:3250
Target 3:3240
Wait for a retracement to sell with strong confirmation and proper risk management.
#GOLD 2H Technical Analysis Expected Move.
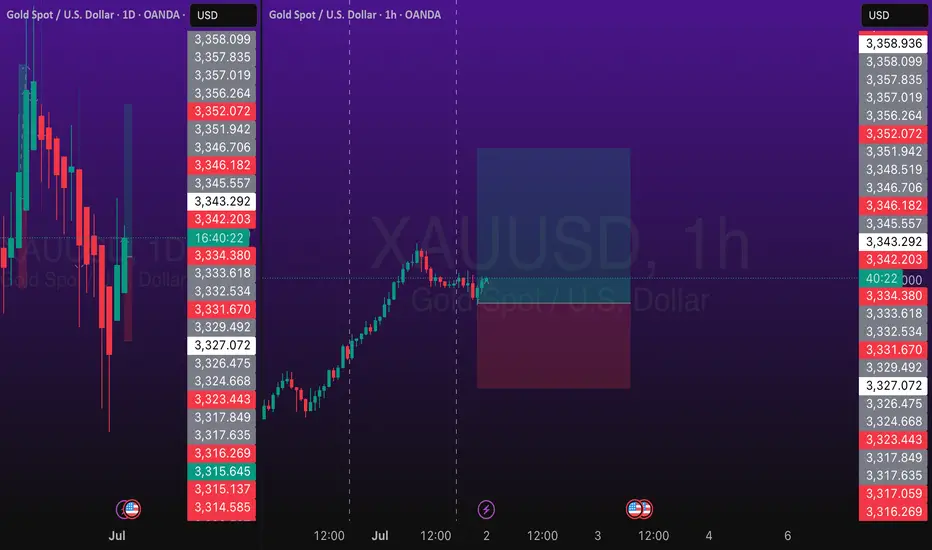
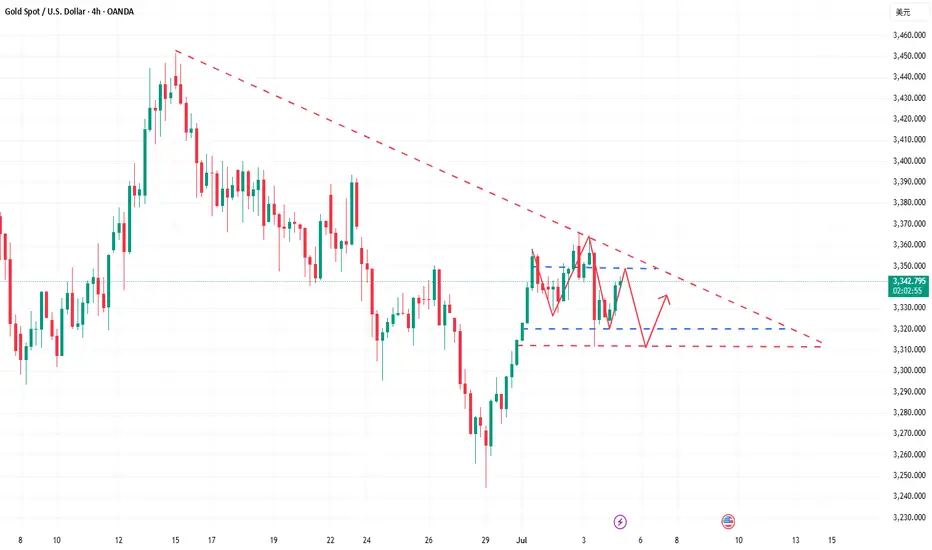
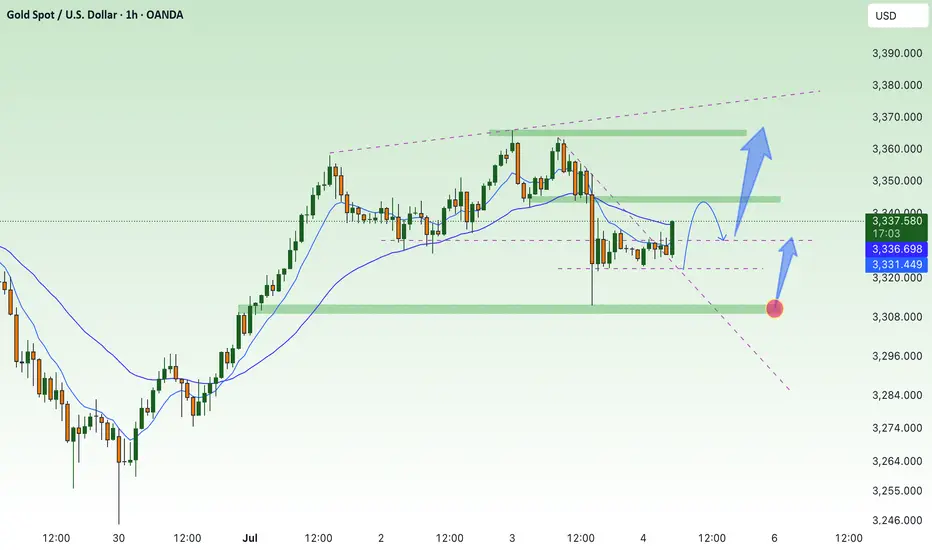
7/4: Trade Within the 3313–3346 RangeGood morning, everyone!
Yesterday’s intraday trades delivered solid profits. Since the U.S. market will be closed today, news-driven volatility is expected to be limited. Therefore, today’s trading focus will primarily revolve around technical setups.
Current structure:
Key support: 3321–3316
Immediate resistance: 3337–3342, followed by 3360
If support holds and resistance breaks, a potential inverse head-and-shoulders pattern may form on the 4H chart, with the next target near 3380
If support breaks, focus shifts to the 3303–3289 support zone
Given the likelihood of range-bound price action today, the suggested intraday range is 3313–3346, with a preference for selling near resistance and buying near support.
If an upside breakout occurs, consider using the MA20 on the 30-minute chart as a guide for pullback entries.
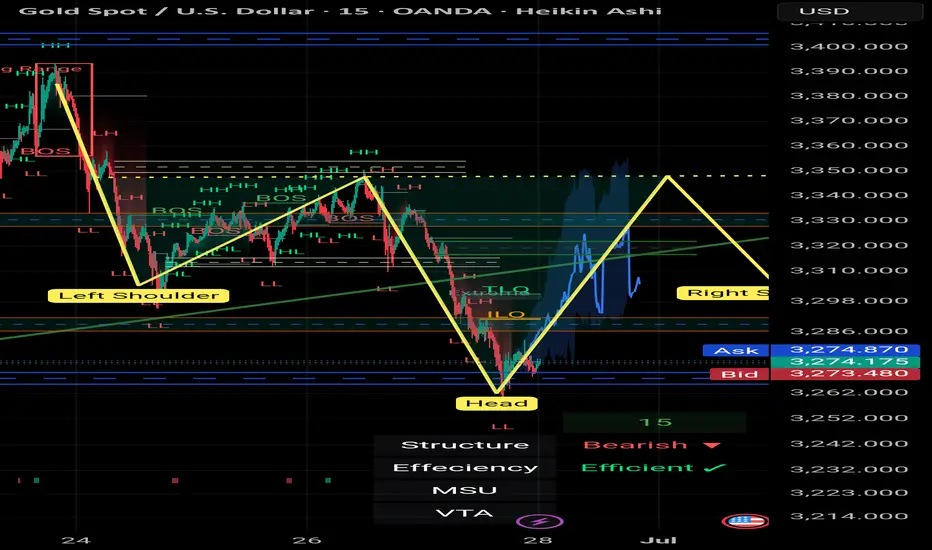
Reverse Head & Shoulders Setup | Gold Spot | 15min | by Mohsen M
🔸 **Chart:** Gold Spot / USD (XAU/USD)
🔸 **Timeframe:** 15min
🔸 **Method:** Smart Money Concepts (SMC) + Pattern Recognition
🔸 **Focus:** Reverse H&S, Order Blocks, TLQ, BOS
---
## 🔍 Market Context:
- **Market Structure:** Bearish on higher TF
- **Short-Term Trend:** MSU (Market Structure Up)
- **Efficiency:** ✅ Confirmed — clean price delivery
- **Key Pattern:** Bullish **Inverse Head & Shoulders**
---
## 🧠 Technical Breakdown:
1. **Left Shoulder – Head – Right Shoulder** perfectly forming within a high-value demand zone
2. Price reacted strongly from **Order Block (OB)** + TLQ marked at the bottom wick (Head zone)
3. BOS confirms bullish attempt to shift structure
4. Anticipating neckline break at ~3345 level for further upside
5. Potential resistance and liquidity resting above 3400 (HH region)
---
## 📌 Trading Plan (Pre-London Open / Monday 1:30 AM UTC+3:30):
- **Entry Idea:**
Watch for bullish confirmation after price stabilizes above Right Shoulder zone (~3300–3320)
Or re-entry on a retest of neckline after breakout
- **Stop Loss:**
Below "Head" and OB zone (~3260)
- **Take Profits:**
- TP1: Neckline break zone (~3345)
- TP2: 3400 – Liquidity pool
- TP3: Final HH sweep (~3420+)
---
## ⚠️ Alternate Bearish Case:
> If price breaks below the "Head" zone and OB fails to hold,
> → Expect bearish continuation to the next liquidity zone near **VTA @ 3200**
---
## ✅ Summary:
This is a clean **bullish reversal setup** using SMC logic and a classic H&S pattern:
**OB + TLQ + BOS + Efficient Market + Clear Pattern ➝ High-Probability Setup**
Structure: 🟥 Bearish (macro)
Trend: 🔼 MSU (micro)
Efficiency: ✅ Efficient
Pattern: 🟩 Inverse Head & Shoulders
---
📊 Prepared by: **Mohsen Mozafari Nejad**
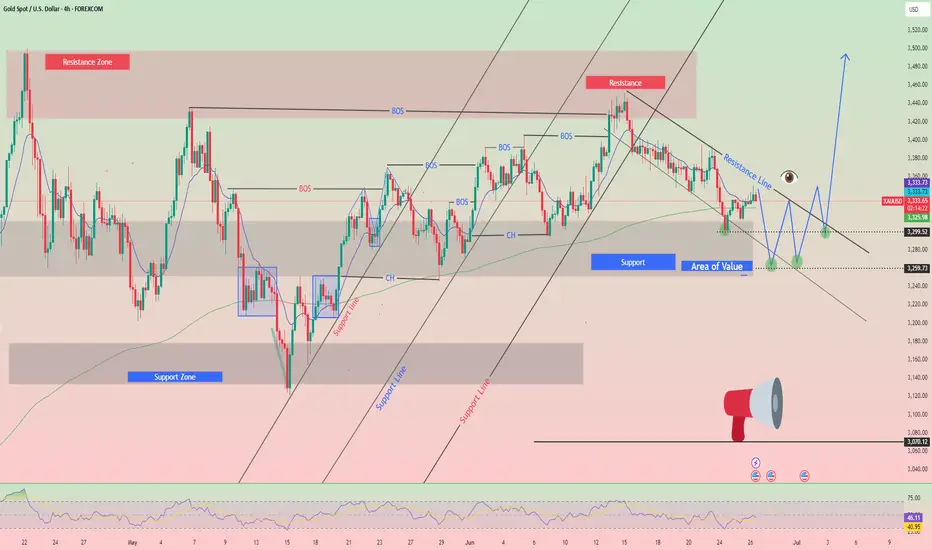
XAUUSD - Trading Plan 4-Hour Analysis and ProjectionThis 4-hour candlestick chart of Gold against the US Dollar highlights key Wyckoff market phases and technical levels that frame the current market structure. The analysis identifies significant points including the Buying Climax (BC), Upthrust (UT), Second Test (ST), and Automatic Reaction (AR), which mark essential phases of accumulation and distribution.
Multiple Dow swing counts (Dow-1, Dow-2, Dow-3) are annotated with various colors, illustrating the market’s internal structure and momentum shifts. The chart shows a failed upthrust after distribution, signaling a likely bearish pressure following the attempt to push prices higher.
The current price action indicates a potential retracement to the support zone near the Automatic Reaction level, followed by possible continuation up to recent highs. The plan suggests watching for a minor pullback around area A, after which a bullish move is expected to resume, targeting higher resistance levels as indicated by the projected price movement arrows.
This trading plan emphasizes careful observation of price reactions around key support and resistance levels derived from Wyckoff methodology phases, aiming to capture potential bullish continuation or prepare for bearish scenarios if support fails.
==============
Dow Theory & Wyckoff

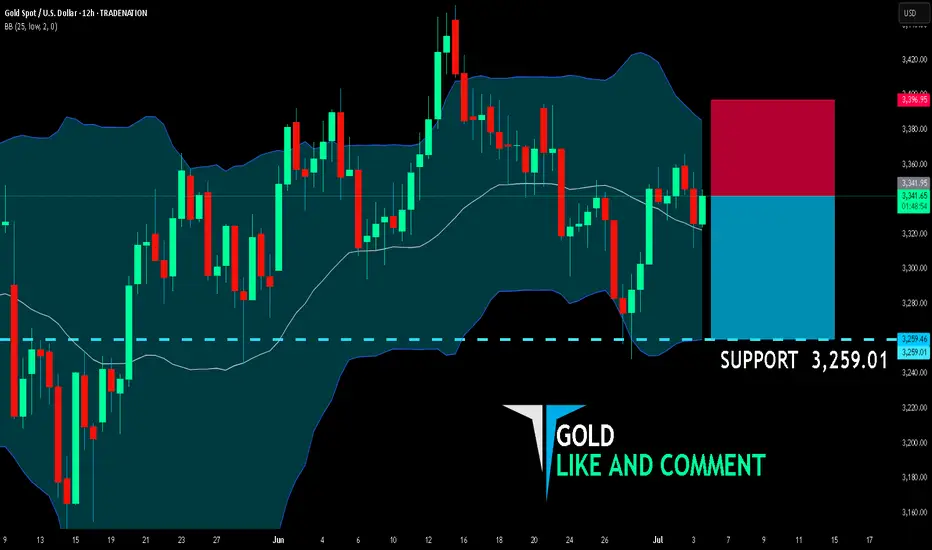
GOLD BEARS ARE STRONG HERE|SHORT
GOLD SIGNAL
Trade Direction: short
Entry Level: 3,341.95
Target Level: 3,259.01
Stop Loss: 3,396.95
RISK PROFILE
Risk level: medium
Suggested risk: 1%
Timeframe: 12h
Disclosure: I am part of Trade Nation's Influencer program and receive a monthly fee for using their TradingView charts in my analysis.
✅LIKE AND COMMENT MY IDEAS✅
GOLD. Why is Gold Rising Again?The yellow metal is one again receiving support driven by two main factors. The first is the continued risk of failure in the negotiations between Tehran and Tel Aviv. The second is related to the chronic weakness of the U.S. dollar amid the American economy slipping into a recession, which may persist for a prolonged period, and the uncertainty surrounding the future global impact of Donald Trump's customs tariff policy.
From a technical perspective, gold prices continue to be in a long-term upward trend. The bullish momentum, driven by the aforementioned reasons, may continue after breaking and consolidating above the 3340 level.
Technical Outlook and Trading Idea:
The price is trading above the middle line of the Bollinger Bands, as well as above the 5-and 14-period SMAs , which have crossed and are giving a buy signal. The RSI is crossing the 50% mark, also indicating a buy. the Stochastic Oscillator is above 50% and continues to rise.
In this situation, I believe gold should be bought, with a potential rise toward 3384. A likely entry point for a buy position could be considered around 3347.
XAUUSD TRADE SETUPWait for retest the entry level and bearish momentum then take a trade for Sell otherwise skip this setup