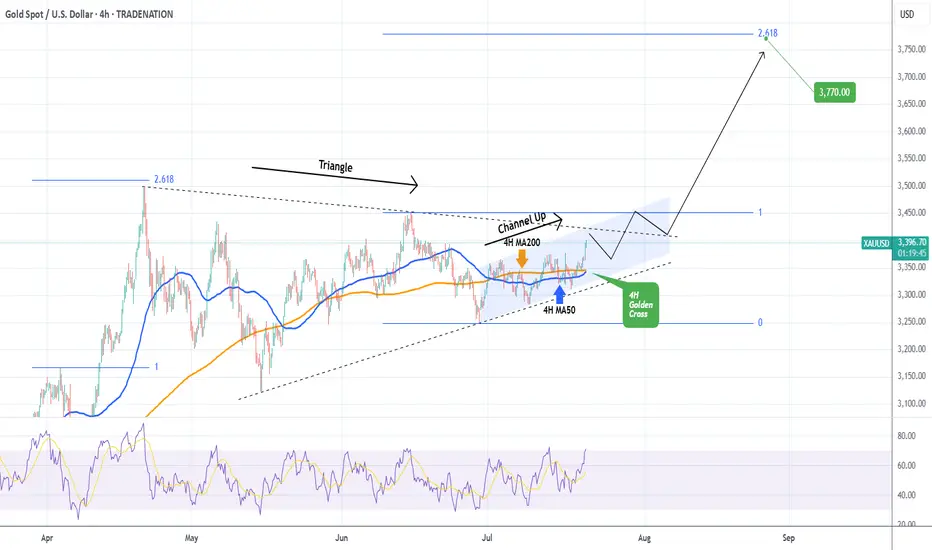
XAUUSD 4H Golden Cross preparing a massive break-out.Gold (XAUUSD) has been trading on a 3-week Channel Up, which is approaching its top but at the same time, it's been trading within a 3-month Triangle, which is also approaching its top.
The key here is the formation today of a Golden Cross on the 4H time-frame, the first since May 28. Being at the end of the long-term Triangle pattern is technically translated to the structure's tendency to look for a decisive break-out above its top that attracts volume (buyers).
It is possible to see an initial rejection followed by a break-out that will re-test the top of the Triangle as Support and then follow the long-term trend dynamics. Those are technically bullish and previous break-out in April targeted the 2.618 Fibonacci extension. Our Target remains a little below it at $3770.
-------------------------------------------------------------------------------
** Please LIKE 👍, FOLLOW ✅, SHARE 🙌 and COMMENT ✍ if you enjoy this idea! Also share your ideas and charts in the comments section below! This is best way to keep it relevant, support us, keep the content here free and allow the idea to reach as many people as possible. **
-------------------------------------------------------------------------------
Disclosure: I am part of Trade Nation's Influencer program and receive a monthly fee for using their TradingView charts in my analysis.
💸💸💸💸💸💸
👇 👇 👇 👇 👇 👇
XAUUSD trade ideas
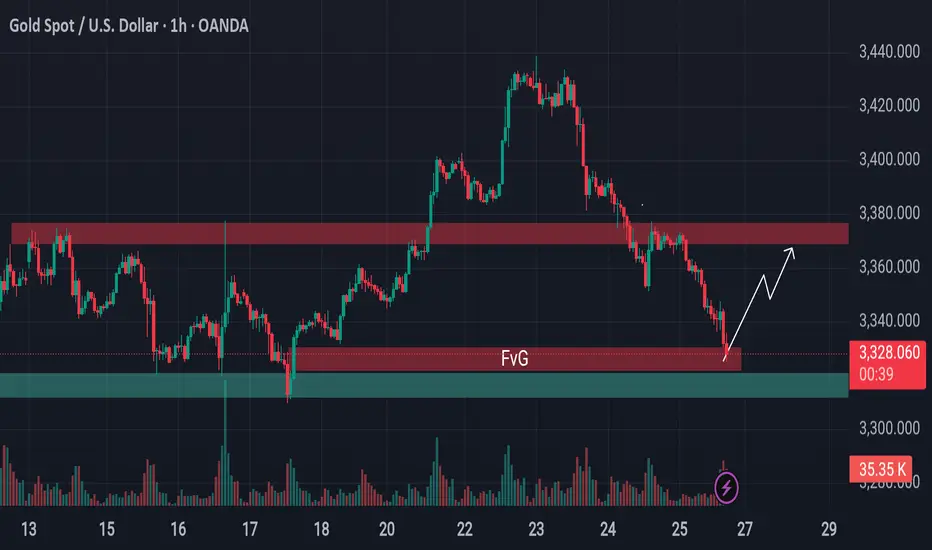
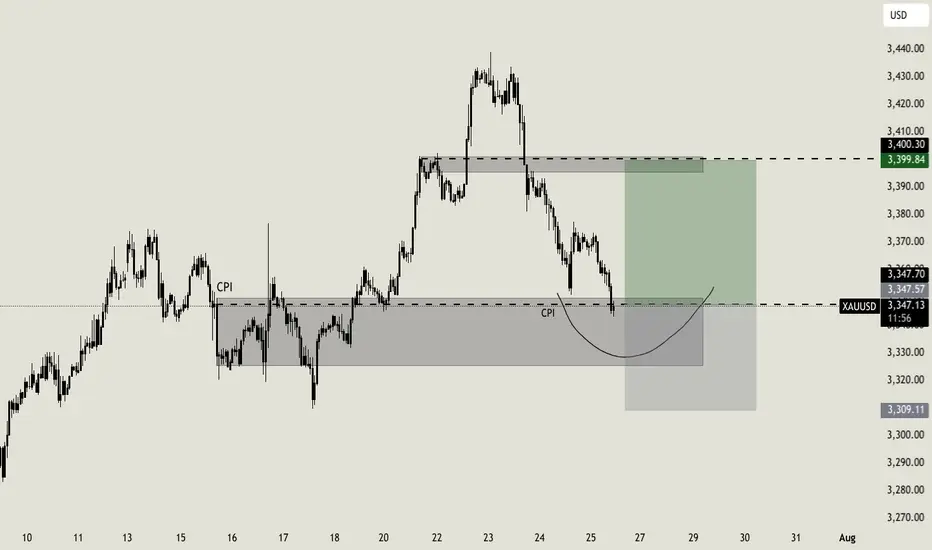
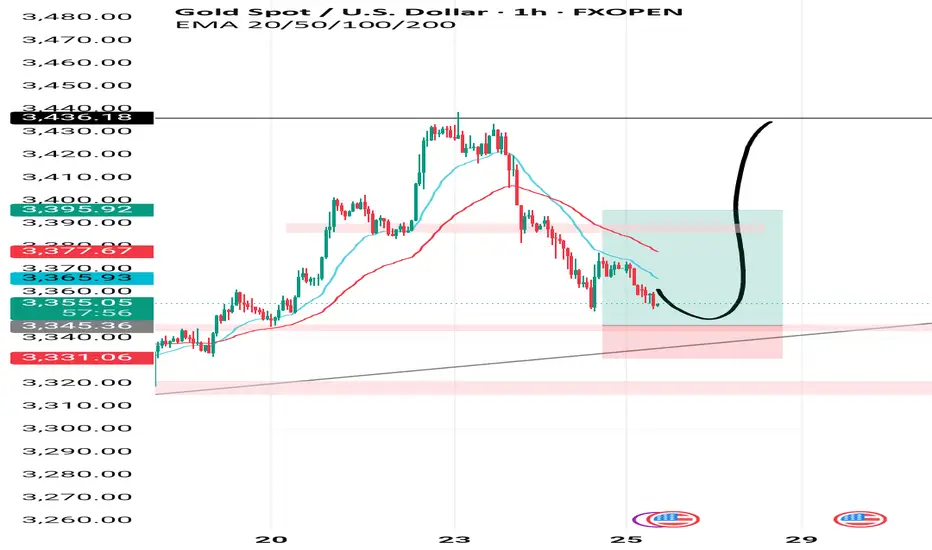
From Breakdown to Breakout? Gold Eyes Support Based Reversal!Gold is approaching a critical support area.
Previously, the price was holding above a key support level, but that zone has now been breached and is likely to act as resistance going forward. However, just beneath the current price, there's a well-established support level still intact—reinforced further by the presence of a bullish Fair Value Gap (FVG).
This setup hints at a possible reversal or a short-term surge from this zone. If market conditions align, gold may stage a pump from here. Keep this level on your radar—it could turn into a decisive point for price direction.
🛡 Always conduct your own analysis before taking any trades. DYOR.
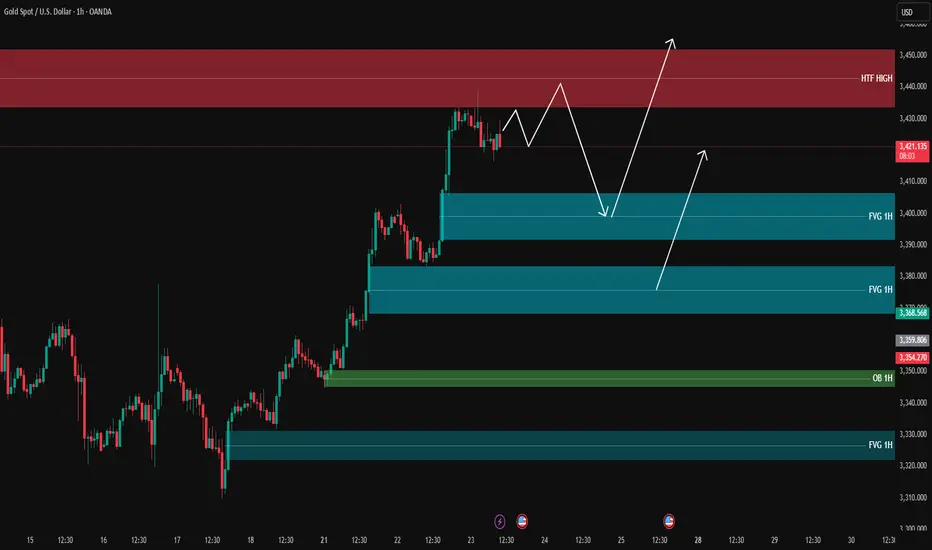
XAUUSD analysis - 1H FVG and OB setupsOn the 1H timeframe, price is reacting as it approaches the HTF high zone (3430-3450) and is currently pulling back.
The 1H FVG zones at:
🔹 3400
🔹 3368
and the 1H OB around 3350 are key areas we are watching for potential long entries.
📌 Plan:
We will wait for price to pull back into one of these 1H FVG/OB zones and look for entry confirmations on the 5M or 3M timeframe to go long.
🎯 Targets: 3430 – 3440 – 3450
❌ No sell setup for now unless a clear structure break happens.
"Gold at a Crossroads: 4H Close Below $3358 Could Trigger Major Technical Analysis
Key Levels:
Resistance Zones:
$3,451.42 – Major resistance.
~$3,410 – Mid-range resistance zone.
Support Zones:
$3,358 – Key support zone (critical level).
$3,330.50 – Secondary support.
$3,283.22 and $3,253.35 – Deeper support levels.
Current Price Action:
Price is currently trading at $3,366.47, pulling back after hitting a local top.
The yellow zone marks a decision area: Price may either bounce up or break down.
Two Scenarios Outlined:
🔼 Bullish Scenario: If price holds above $3,358 and breaks above the yellow zone, it may aim for $3,410 or even $3,451.
🔽 Bearish Scenario: A 4H candle close below $3,358 could signal continuation down toward $3,330, $3,283, and possibly $3,253.

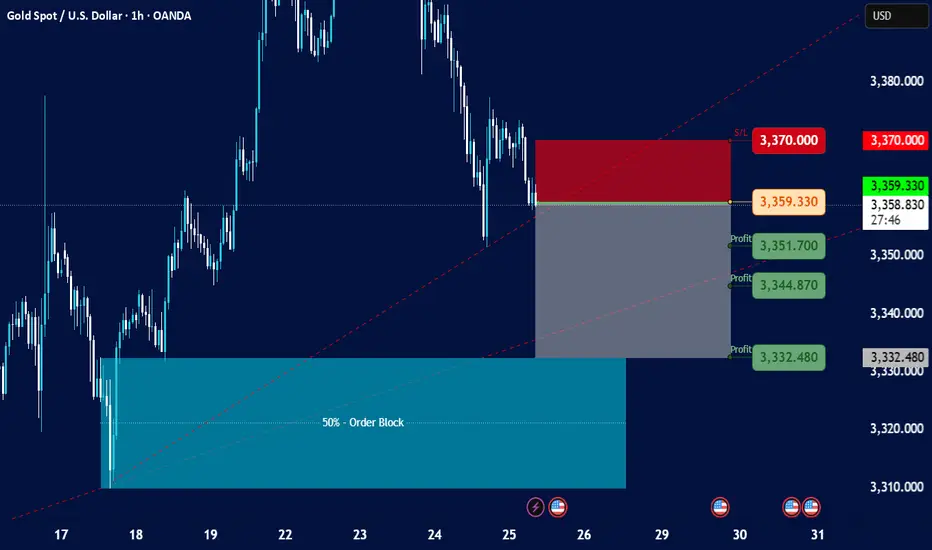
Gold Spot / U.S. Dollar - 1h on TradingView, dated July 25, 202Current Price and Trend:
The current price is shown as 3,359.330, and the last traded price is 3,359.005.
The chart indicates a downtrend in recent sessions, with the price having fallen significantly from higher levels around 3,380.000 to 3,390.000 down to the current levels.
There's a dashed red line (possibly a trendline or resistance) indicating a downward slope.
Key Zones and Levels Identified:
Resistance/Stop Loss Zone (Red Rectangle):
This zone is marked from approximately 3,365.000 up to 3,370.000.
A "S/L" (Stop Loss) level is explicitly marked at 3,370.000. This suggests that a short position (selling) is being considered, with a stop loss placed above this resistance.
Entry Point (Grey Line):
An entry point for a trade is indicated by a grey horizontal line at 3,359.330. This is very close to the current price, suggesting a potential entry for a short trade.
Profit Target Zones (Grey Rectangle with Green Labels):
Three "Profit" levels are identified below the entry point:
3,351.700
3,344.870
3,332.480
These levels suggest potential targets for taking profit on a short position. The grey shaded rectangle represents the area where these profit targets lie, extending downwards from the entry point.
50% - Order Block (Teal Rectangle):
At the bottom left of the chart, there's a large teal-colored rectangle labeled "50% - Order Block."
This typically represents an area where significant institutional buying interest (or an accumulation of orders) is expected, potentially acting as strong support. The price has previously bounced off this area.
Possible Trading Strategy Implied:
The setup suggests a potential short-selling strategy for Gold Spot / USD, likely based on a continuation of the downtrend or a retest of previous resistance levels.
Entry: Around 3,359.330 (current price level).
Stop Loss: At or above 3,370.000, to limit potential losses if the price moves against the short position.
Take Profit: Phased profit-taking at 3,351.700, 3,344.870, and 3,332.480.
Target Support: The ultimate target appears to be within the "50% - Order Block" zone, suggesting the expectation of the price reaching or testing this strong support area.
Considerations and Further Analysis Needed:
Confirmation: The chart doesn't show any specific indicators (e.g., RSI, MACD) that might confirm the downtrend or potential entry.
Volume: Volume analysis would be beneficial to assess the strength of price movements.
News/Fundamentals: Any upcoming economic data or geopolitical events could significantly impact gold prices.
Risk-Reward Ratio: A calculation of the risk-reward for each profit target would be useful to determine the attractiveness of the trade.
Market Structure: A deeper analysis of the market structure (higher highs/lows, lower highs/lows) could provide more context.
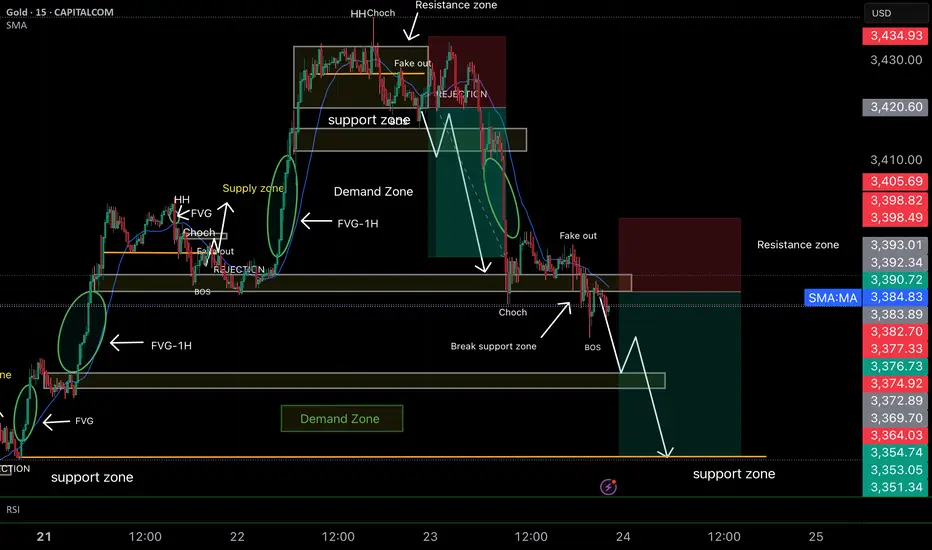
CONFLUENCE We might see GOLD using this confluence to go up. Gold is currently trending upwards, therefore we might see it continuing with that trend

SMC Strengths of the Analysis
• ✔️ Clear bearish structure (ChoCH + BOS + fake out)
• ✔️ Mitigation target (1H FVG not yet closed)
• ✔️ SL well protected outside the manipulation zone
• ✔️ Logical entry right where the imbalance begins
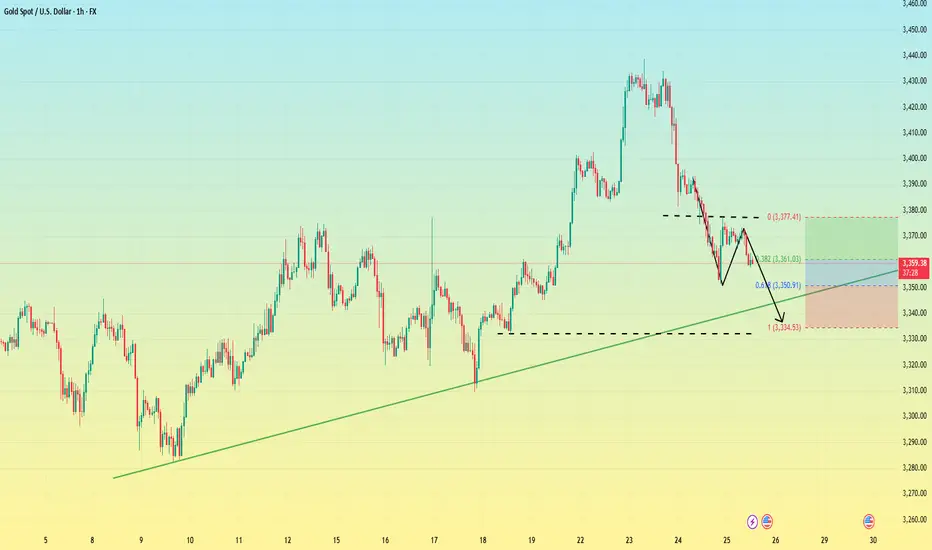
Gold on the magic level, pullback?Gold reached a key level i was waiting for more than a week. The area from 3325 till 3350 is the real support zone that could lead the price to pullback. In H1 and M15 timeframe i can see a reversal pattern, that let me join this trade with a small risk (due to the RR ratio). I will increase my size if NY will give us a better scalp opportunity
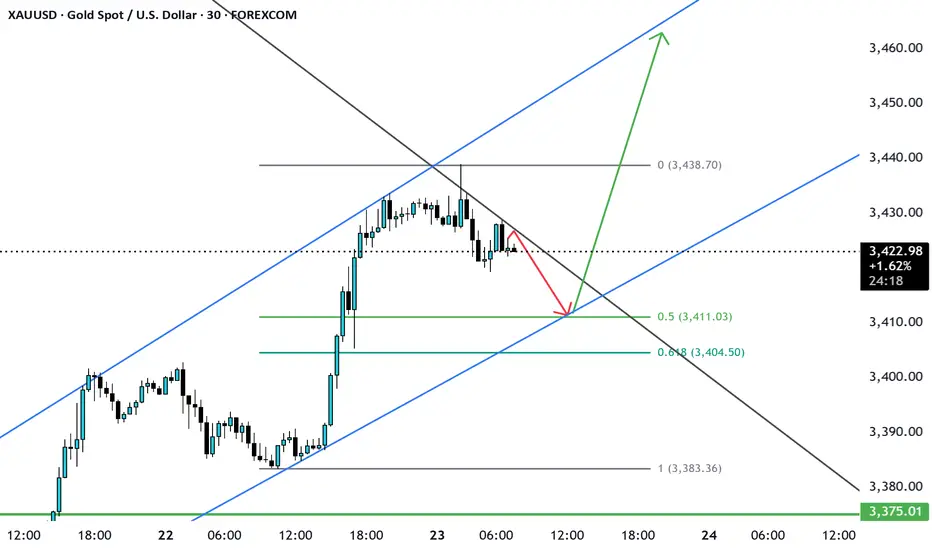
XAUUSD correction in progress Next target 3460-3470XAUUSD was trading in a up trend and currently consolidating, At the fib 0.5 and support channel support trendline both overlap at 3410-3415 area from where the price may resume again up the target can be 3460. let us see.
gold bearishgold has not respected any support ony to H4 3351.
will it make its way up from here. only candle stick reaction to tell us.
however the safest trade for today to end the week is shorts.

Gold is weak. Beware of lows.On Thursday, the dollar index ended a four-day losing streak thanks to the progress of the fund between the United States and its trading partners.
As signs of easing global trade tensions curbed demand for safe-haven assets, gold fell for the second consecutive trading day, and yesterday it hit the 3350 bottom support level.
From the 4-hour chart
although it rebounded to the 3370-3380 range after hitting 3350. But it can be found that the current rebound is actually weak, and it is still maintained at 3360-70 for rectification. At present, the bottom of the 4-hour bottom is absolutely supported at 3340-3335. The rebound high is around 3375. As of now, gold has not rebounded above 3375, and gold is actually in a weak position.
Secondly, from the hourly chart, the weakness is even more obvious. The high point on Thursday was around 3395. Today's current high point is around 3375. It can be seen that if the bottom falls below the 618 position 3350 again, it will directly touch around 3335. It coincides with the target position of 3340-3335 in the previous 4-hour chart.
Therefore, it is not possible to buy the bottom and go long today. Be alert to the possibility of further touching 3340-3335.
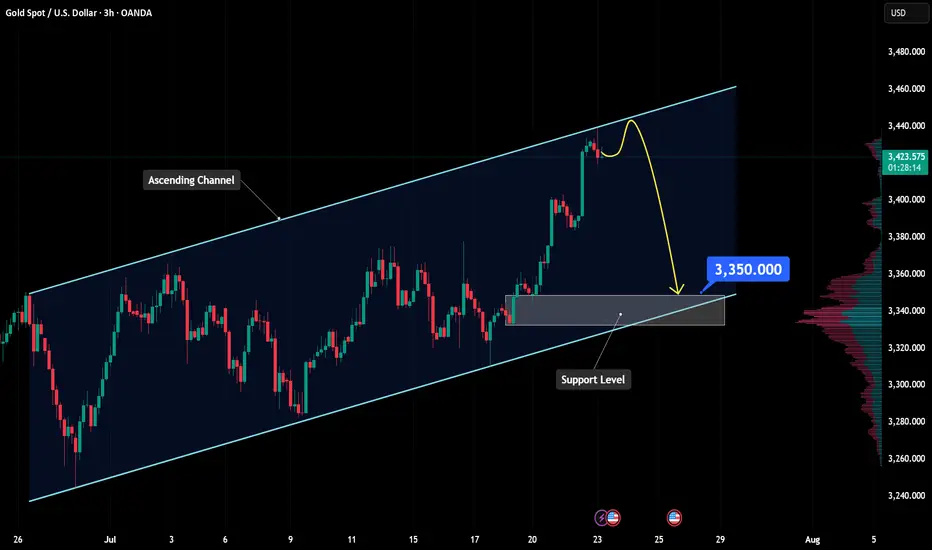
Gold technical outlook – Signs of exhaustion at channel topOANDA:XAUUSD is climbing within a well-defined ascending channel, and price is now brushing up against the upper boundary, a dynamic resistance zone that has historically triggered pullbacks. If price gets rejected here, we may see a healthy correction toward the key support at 3,350, offering a potential reload point for bulls.
Should buyers step in and defend this level, the bullish structure remains intact, setting the stage for a renewed push higher. On the other hand, a clean break below 3,350 could open the door for a deeper retracement toward the lower edge of the channel, where more significant demand may lie.
All eyes should be on price action and volume in this regio, watch for reversal patterns like bullish pin bars or engulfing candles to confirm entries. As always, risk management comes first. Don't trade assumptions, trade confirmations.
What’s your take on this setup? Drop your thoughts below and let’s discuss!
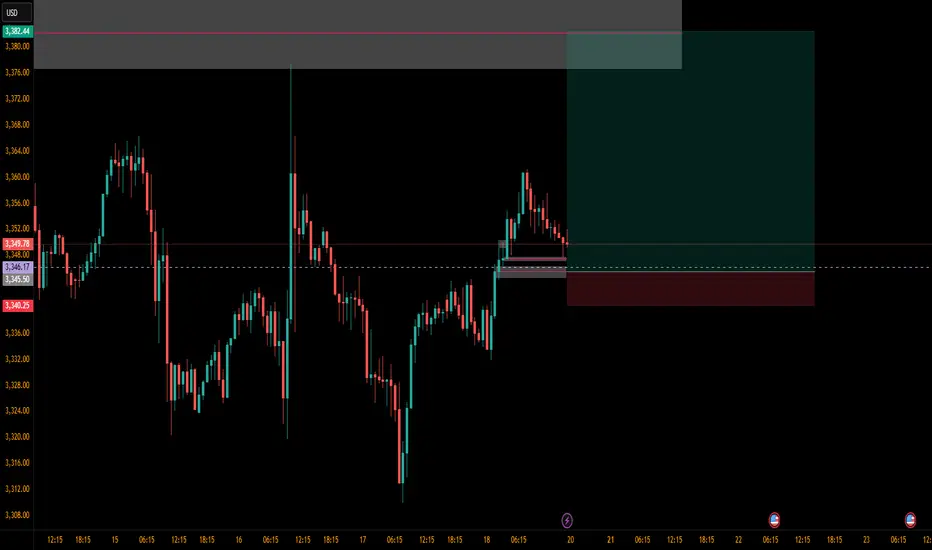
Buy at the ICT Flip StageThe price is approaching a high probability zone for purchases, follow up, the price must break all the highs
XAUUSD Technical Analysis – Triangle Breakout Ahead?Gold is currently consolidating in a symmetrical triangle pattern around $3,389. If it breaks above $3,402, we can expect a bullish continuation toward $3,420 and beyond. Key support lies at $3,367; a breakdown below this level would turn the trend bearish. The overall trend is still bullish, but a breakout is needed for confirmation.
📈 Potential Scenarios:
✅ Bullish Breakout Scenario:
- Break above $3,392–$3,402 zone.
- Targets: $3,420 > $3,450 > $3,480
- Supported by strong upward BOS (Break of Structure) and higher lows.
❌ Bearish Breakdown Scenario:
- Breakdown below $3,373–$3,367 zone.
- Targets: $3,355 > $3,345
- Would invalidate current bullish structure and form a lower low.
🔮 Trend Bias:
Bullish Bias remains intact as long as price stays above $3,367 and maintains higher lows. However, consolidation suggests waiting for breakout confirmation from the triangle before entering new trades.
🧭 Trend Outlook:
Gold is currently consolidating in a symmetrical triangle pattern, which typically precedes a breakout — either upward or downward. The price is holding above the key Fibonacci support levels and the overall market structure is bullish, suggesting an upward continuation is more likely if buyers maintain momentum.
Note
Please risk management in trading is a Key so use your money accordingly. If you like the idea then please like and boost. Thank you and Good Luck!

Accurate prediction, continue to buy after retracement to 3353📰 News information:
1. The Trump administration puts pressure on the Federal Reserve to cut interest rates
2. The continued impact of tariffs and the responses of various countries
📈 Technical Analysis:
Gold is currently rising rapidly, reaching a high near 3368, and the overall bullish trend has not changed yet. It is not recommended to continue chasing the highs at present. Those who are long at 3345 can consider exiting the market with profits. The technical indicators are close to the overbought area and there is a certain risk of a correction. Be patient and wait for the pullback to provide an opportunity. At the same time, 3353 has become the position with relatively large trading volume at present, and the top and bottom conversion in the short term provides certain support for gold longs. If it retreats to 3355-3345, you can consider going long again, with the target at 3375-3385. If it falls below 3345, look to 3333, a second trading opportunity within the day. If it falls below again, it means that the market has changed, and you can no longer easily chase long positions.
🎯 Trading Points:
BUY 3355-3345
TP 3375-3385
In addition to investment, life also includes poetry, distant places, and Allen. Facing the market is actually facing yourself, correcting your shortcomings, facing your mistakes, and exercising strict self-discipline. I share free trading strategies and analysis ideas every day for reference by brothers. I hope my analysis can help you.
FXOPEN:XAUUSD OANDA:XAUUSD FX:XAUUSD FOREXCOM:XAUUSD PEPPERSTONE:XAUUSD TVC:GOLD

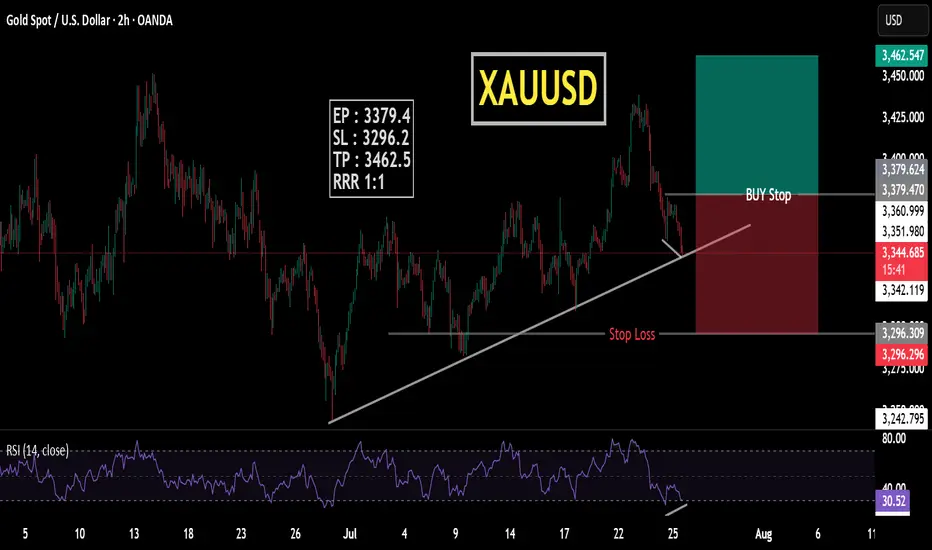
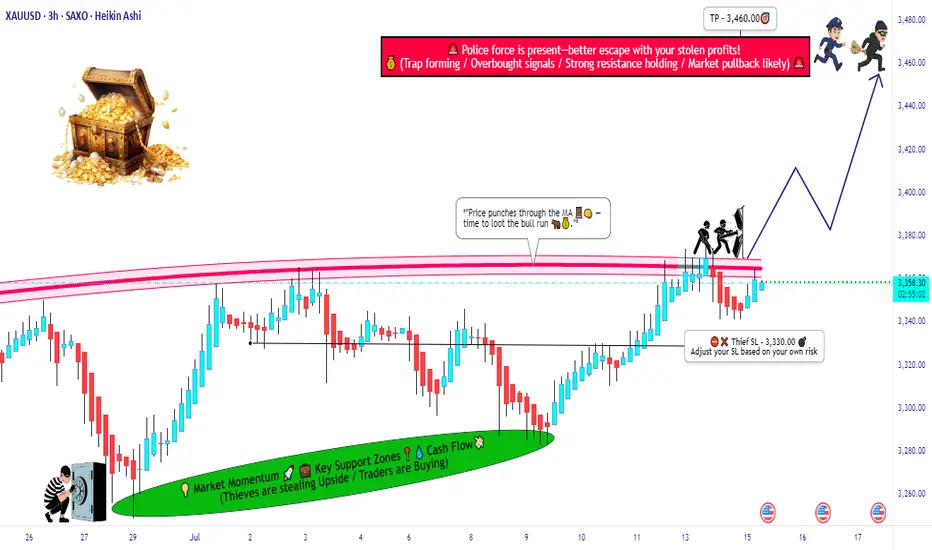
GOLD (XAU/USD) MA Breakout – High-Probability Long Setup!💰🚨 GOLD HEIST ALERT! XAU/USD MASTER PLAN (Thief Trading Style) 🎯
🔥 Steal Pips Like a Pro – High-Probability Gold Breakout Strategy! 🔥
🎯 Thief Trading’s GOLD Heist Strategy (Swing/Day Trade) �💸
👋 Hey there, Market Pirates & Profit Snatchers! 🌍✨
Based on our 🔥Thief Trading Style🔥 analysis, we’re plotting a major heist on XAU/USD (GOLD). The plan? Buy the breakout, escape before the cops (resistance) arrive! 🚔💨
📈 ENTRY ZONE: The Heist Begins!
🚀 "Wait for the MA Breakout (3400) – Then Strike!"
Bullish Confirmation: Enter on a 15M/30M pullback after MA breakout.
Thief’s Trick: Use Buy Stop above MA or Buy Limit near swing lows for best risk-reward.
DCA/Layering Strategy: Deploy multiple limit orders to maximize gains.
🔔 Set an ALERT! Don’t miss the breakout – thieves move fast! ⏳
🛑 STOP LOSS: Protect Your Loot!
📍 Thief’s SL Placement: 3330.00 (4H Swing Low) – Adjust based on your risk & lot size.
⚠️ WARNING: If using Buy Stop, DO NOT set SL until after breakout – unless you love unnecessary losses! 🔥
🎯 TARGET: Escape with the Gold!
🏴☠️ Take Profit Zone: 3460.00 (or Exit Early if Bears Show Up!)
Scalpers: Only trade LONG side – use trailing SL to lock in profits.
Swing Traders: Ride the wave but watch for resistance traps!
📰 MARKET CONTEXT: Why This Heist?
Neutral Trend (But Bullish Potential! 🐂)
Key Factors: Geopolitics, COT Data, Macro Trends, Sentiment Shift
🚨 News Alert: Avoid new trades during high-impact news – trailing SL saves profits!
💥 BOOST THIS HEIST! (Like & Share for More Pips!)
💖 Hit the 👍 Boost Button to strengthen our Thief Trading Crew!
🚀 More Heist Plans Coming Soon – Stay Tuned!
⚠️ DISCLAIMER (Stay Safe, Thieves!)
This is NOT financial advice. Do your own analysis & manage risk.
Markets change fast! Adapt or get caught.
🎯 Happy Trading, Pirates! Let’s Steal Some Gold! 🏴☠️💛
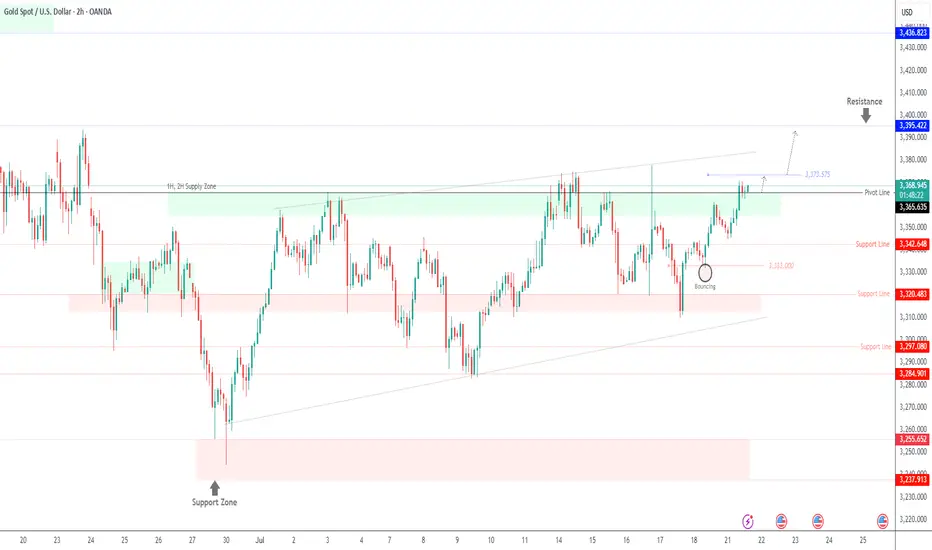
GOLD | Bullish Bias Amid Fed & Trade Policy UncertaintyGOLD | Bullish Bias Amid Fed & Trade Policy Uncertainty
Gold prices edge higher as markets weigh conflicting signals from the Federal Reserve and renewed trade policy uncertainty. Diverging opinions among Fed officials regarding the inflationary impact of President Trump's proposed tariffs have fueled demand for safe-haven assets.
While some members like Waller and Bowman appear open to rate cuts, others remain cautious about lingering inflation risks, adding to market volatility.
Technical Outlook:
Gold maintains bullish momentum above 3365. A break and hold above this pivot supports continuation toward 3375, and if momentum builds, toward 3385 and 3395.
However, any sustained move below 3365 may trigger a bearish correction toward the support zone between 3355 and 3342.
Pivot Line: 3365
Resistance Levels: 3375 · 3385 · 3395
Support Levels: 3355 · 3342
Bias: Bullish above 3365
GOLD BEARS ARE STRONG HERE|SHORT
GOLD SIGNAL
Trade Direction: short
Entry Level: 3,383.09
Target Level: 3,336.50
Stop Loss: 3,413.51
RISK PROFILE
Risk level: medium
Suggested risk: 1%
Timeframe: 12h
Disclosure: I am part of Trade Nation's Influencer program and receive a monthly fee for using their TradingView charts in my analysis.
✅LIKE AND COMMENT MY IDEAS✅

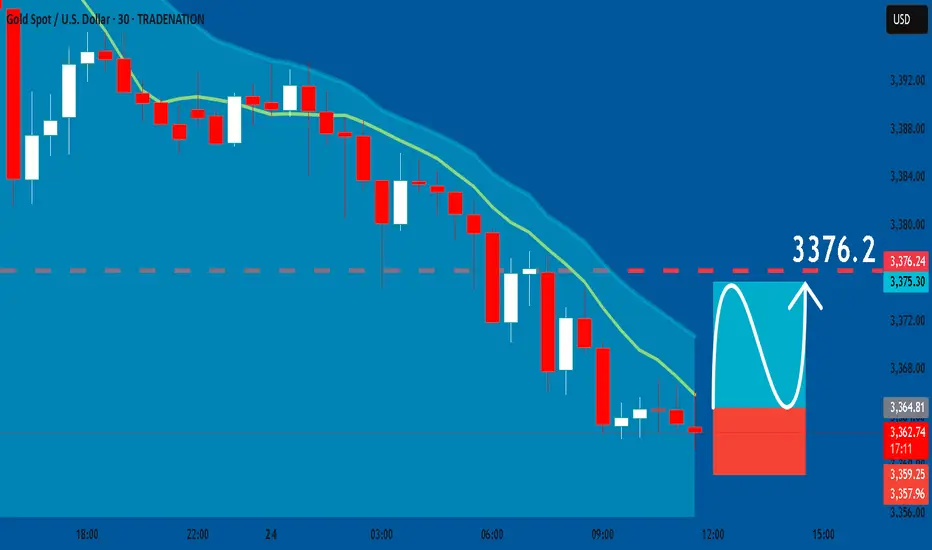
GOLD: Bullish Continuation & Long Signal
GOLD
- Classic bullish formation
- Our team expects growth
SUGGESTED TRADE:
Swing Trade
Buy GOLD
Entry Level - 3364.8
Sl - 3359.2
Tp - 3376.2
Our Risk - 1%
Start protection of your profits from lower levels
Disclosure: I am part of Trade Nation's Influencer program and receive a monthly fee for using their TradingView charts in my analysis.
❤️ Please, support our work with like & comment! ❤️
XAUUSD on swing Gold is currently holding rising channel along with the Range of 3340-3375
What's possible scanarios we have?
▪️I'm looking for Buying trade 1st we have 3342-3345 support area for potential buying spot.
Other then we have pending liquidity below 3340-3335 which I'm expecting the perfect buyying opportunity keep buy set targets at 3370 then 3400.
•Also we have buyying option If h4 closed above 3380 I will buy and target will be 3400.
▪️ keep in mind below 3330 we have sellers gap and our targets will 3305 then 3290
#XAUUSD

Buy level GoldStrong buy expected from our marked level strong buy trend line and fresh bullish engulfing level
Wait LTF confirmation then buy
