XAUUSD:Today's trading strategy
On Tuesday, the news that Trump announced a ceasefire between Iran and Israel dampened the risk aversion sentiment. Subsequently, the news that expectations of interest rate cuts had slowed down led to a further decline in gold prices. During the trading session, it once fell below the 3,300 mark. After the impact of the news weakened, it eventually rebounded to around 3,323, approaching the position where we first entered the market yesterday. Currently, there is no logic in the market. From a technical perspective, The resistance level above is at 3340-45, and the support level below is at 3305-10. We can conduct transactions around this range
Trading strategy:
SELL@3340-45
TP:3310-04
BUY@3305-10
TP:3335-40
More detailed strategies and trading will be notified here ↗↗↗
Keep updated, come to "get" ↗↗↗
XAUUSD trade ideas
GOLD: The Market Is Looking Down! Short!
My dear friends,
Today we will analyse GOLD together☺️
The in-trend continuation seems likely as the current long-term trend appears to be strong, and price is holding below a key level of 3,295.36 So a bearish continuation seems plausible, targeting the next low. We should enter on confirmation, and place a stop-loss beyond the recent swing level.
❤️Sending you lots of Love and Hugs❤️
GOLD - SHORT TO $2,800 (UPDATE)We've seen s sharp move back up overnight which is no surprise considering we are at the start of a new month & quarter. Markets will be spiking to both sides for monthly liquidity, before moving in the direction of the trend.
We're still holding below our yellow support zone & below 'Minor Wave 2'. If this continues to hold, then it'll be a good sign for sellers.
stable tariffs, gold price impact reduction✍️ NOVA hello everyone, Let's comment on gold price next week from 06/30/2025 - 07/04/2025
⭐️GOLDEN INFORMATION:
Gold prices plunged over 1.5% on Friday as risk appetite strengthened, fueled by a combination of positive geopolitical and economic developments. Easing tensions between Israel and Iran, the formal trade agreement between the United States and China, and continued efforts by Washington to strike new commercial deals with global partners lifted market sentiment—dampening demand for safe-haven assets like bullion.
At the time of writing, XAU/USD is trading at $3,274, having pulled back from an earlier high of $3,328. On Thursday, the White House confirmed the signing of a long-awaited trade pact with China, marking an official end to the protracted trade war. US Commerce Secretary Howard Lutnick also indicated that additional agreements may be finalized ahead of the July 9 deadline
⭐️Personal comments NOVA:
Information on tariff negotiations is gradually becoming stable and favorable. Information on inflation showing signs of increasing, dxy increase is also a temporary pressure causing gold price to return to the 3200 mark.
🔥 Technically:
Based on the resistance and support areas of the gold price according to the H4 frame, NOVA identifies the important key areas as follows:
Resistance: $3307, $3348, $3390
Support: $3248, $3202
🔥 NOTE:
Note: Nova wishes traders to manage their capital well
- take the number of lots that match your capital
- Takeprofit equal to 4-6% of capital account
- Stoplose equal to 2-3% of capital account
- The winner is the one who sticks with the market the longest
Gold continues to rise slowly
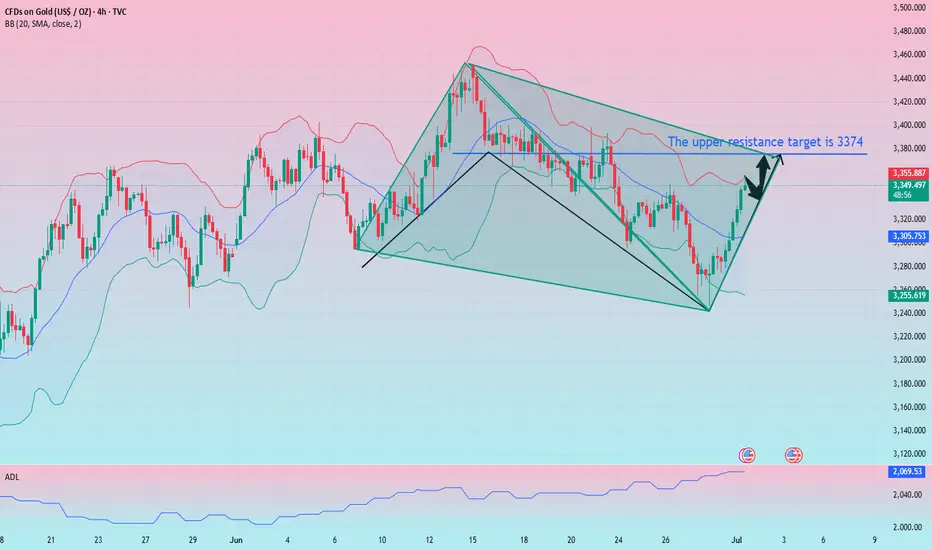
Gold weekly and monthly level: For the monthly level, many people think that the bull market is over when they see the continuous long upper shadow cross K, and they don’t think that it can’t even effectively lose the 5-day moving average, and it is still in a strong stage in the strong stage, and it is also running on the upper track of the upward channel, indicating that the bull market has yet to continue. If it directly pulls up and engulfs the high point of last month this month, a group of bearish people will be wiped out. It has always been emphasized that you should not underestimate the trend of the past two years, and don’t guess the top. This top will reach a height that everyone can’t imagine. Following the bull trend is the right choice. Holding on to the low-level bullish band bottom position in your hand is the happiest moment in the past two years and the most witnessing moment of strength; and the weekly level, as mentioned at the weekend, don’t look at the big negative last week and lose the lower track of the channel. It is also completely possible to directly come back with a big positive this week.
Gold daily level, there has been a continuous positive breakthrough during the day. Once the closing confirms that the breakthrough is effective, it will continue to rise tomorrow and directly approach the lower track of the previous yellow channel. 340 0 line; then going forward, we have to fight for the last key pressure point, the 3500-3452 previous high trend connection line, which roughly corresponds to 3440. Once it breaks through here directly, 3500 will inevitably be unstoppable and move towards 3700; however, there is no need to be too anxious at the moment, be down-to-earth, and overcome the resistance level step by step, but you must try to look far ahead to see more clearly
Gold hourly line level: From the opening to now, it has been rising slowly all the way, with a small negative in the middle, all positive, this kind of pull-up pattern must not be tested for shorts, and during the European session, it also broke through the upper rail resistance level of the 3335 downward channel, and there was a second pull-up in the US session; it just couldn't step back, and even the 10-day moving average didn't give a chance. If you want to step back and follow the long position, there is no chance for the time being, and going long directly seems more radical; you can wait patiently, be bullish, and don't go short; if you can confirm that it is above 3335 today, you can try to follow the bullish trend, and the upper resistance target is 3374
Gold (XAU/USD) Long Setup Gold (XAU/USD) Long Setup – Strong Support Bounce & Potential Reversal
Timeframe: 4H
Gold recently bounced off a well-defined strong support zone near $3,263, forming a potential double bottom structure. The price is now showing early signs of reversal with bullish momentum building.
Key Levels:
Entry: ~ $3,294
Stop Loss: Below $3,263 (support zone)
Target 1: $3,349 (minor resistance)
Target 2: $3,413 (major resistance)
Technical Confluence:
Price respected historical support (highlighted by multiple bounces)
Bullish price action with a recovery structure
Opportunity for upside retracement toward previous supply zones
Fundamental Outlook:
Gold may see bullish pressure amid geopolitical uncertainty and potential central bank dovish pivot
Market awaiting key macroeconomic data – watch for volatility spikes
Bias: Bullish (Short-to-Medium Term)
A solid buy setup for traders looking to capitalize on price recovery from a strong support zone with clearly defined risk
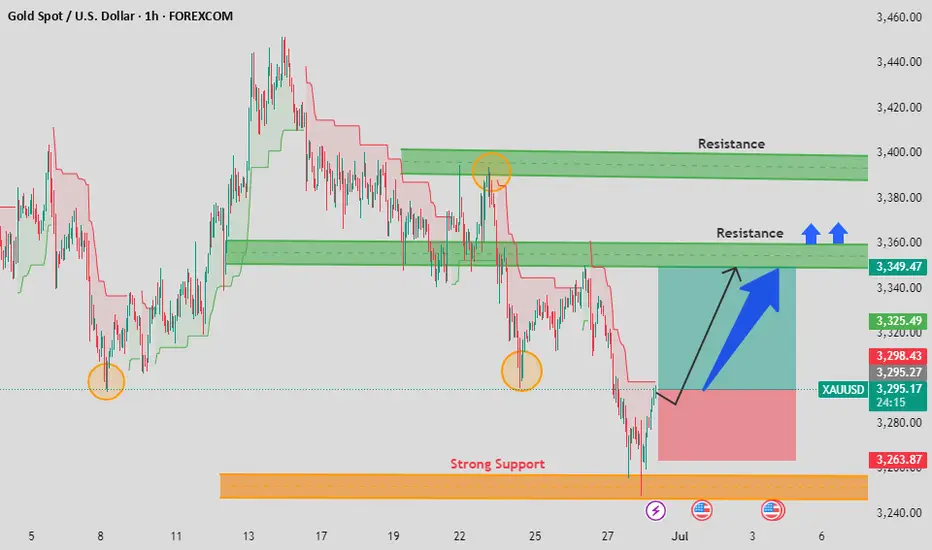
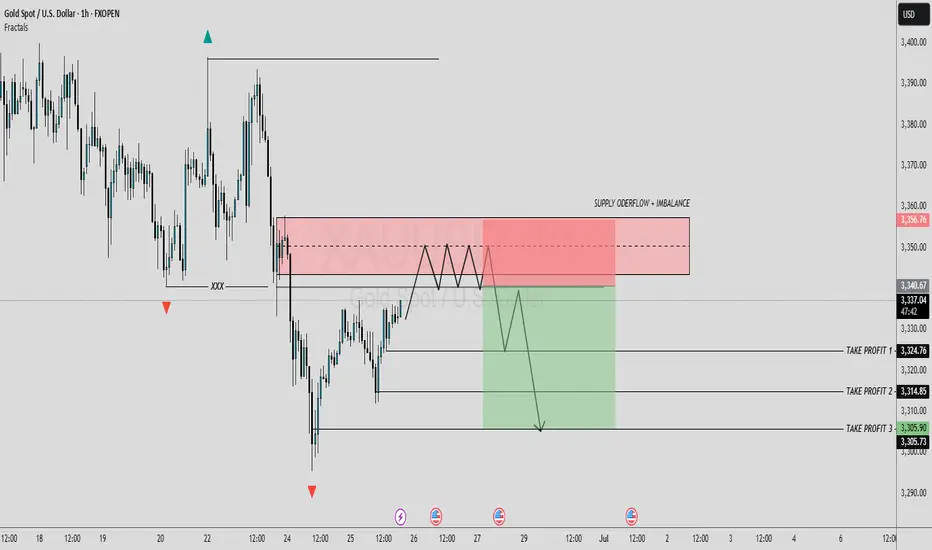
Gold (XAUUSD) short trade idea based on 1H chart 🪙 GOLD (XAUUSD) SHORT SETUP – Liquidity Grab Play 📉🔥
Here’s a potential short setup forming on Gold (1H timeframe):
🔹 Liquidity Sweep:
Price just tapped into a key supply zone after an aggressive bullish move, grabbing liquidity above recent highs (marked $$$). This is a classic setup for a potential reversal or retracement.
🔹 Premium Zone Entry:
The short position is taken right after price tapped the supply zone between 3340–3354, showing early signs of exhaustion.
🔹 Trade Setup:
Entry: Near 3341.30
SL: Just above supply at ~3354.13
TP: Down near the recent demand/imbalance at 3263.42
RRR: High reward potential with minimal risk.
🔹 Confluence Factors:
Price filled imbalance with strong momentum.
Reversal likely if no continuation above supply.
Key psychological levels and liquidity engineered below price.
📊 Execution Plan:
Watch lower timeframe confirmations (M15/M5 rejection or engulfing).
Manage stop based on how price behaves around 3350.
⚠️ As always, risk smart. Let the market confirm your bias before committing fully.
Note: wait for confirmation
Geopolitical Spike Fades Fast – Gold Eyes 3300As highlighted in Friday’s analysis, the daily and short-term charts remain messy, but the weekly chart is leaning clearly bearish – with a potential Dark Cloud Cover candlestick formation now confirmed.
🌍 Geopolitical Gap Up... and Quick Rejection
Monday’s Asian open brought a gap up, triggered by renewed tensions in the Middle East. But price failed to break above 3400 and quickly reversed – a textbook sign of weakness, not strength.
🧭 Technical View:
- The weekly candle closed as a Dark Cloud Cover, a strong bearish reversal signal
- The lack of follow-through after the gap up further confirms sellers are still in control
- Price remains below the key 3400 level, showing no bullish momentum behind recent spikes
📌 Trading Plan:
I continue to sell rallies, with an initial target near 3300. If bearish momentum builds, lower levels are in play.
Let the chart lead – don’t get distracted by the noise.
Disclosure: I am part of TradeNation's Influencer program and receive a monthly fee for using their TradingView charts in my analyses and educational articles.
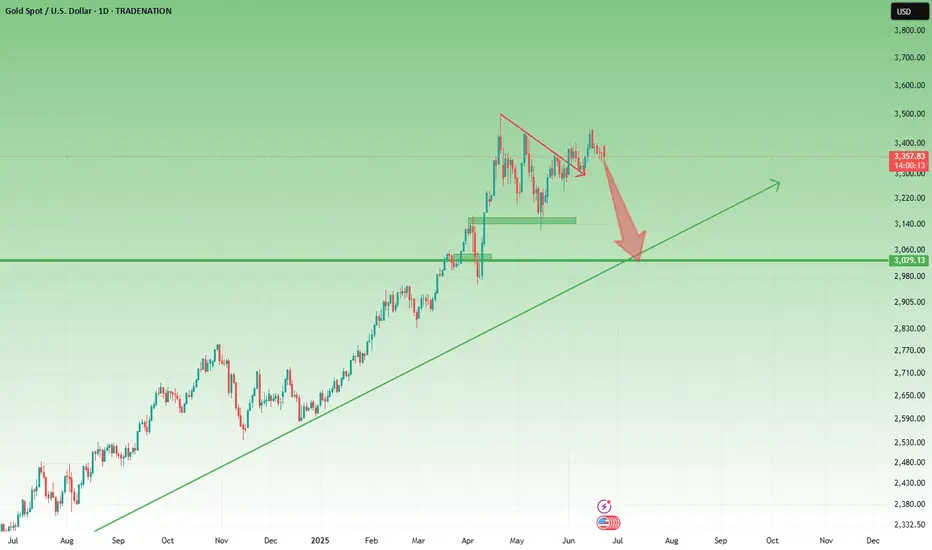
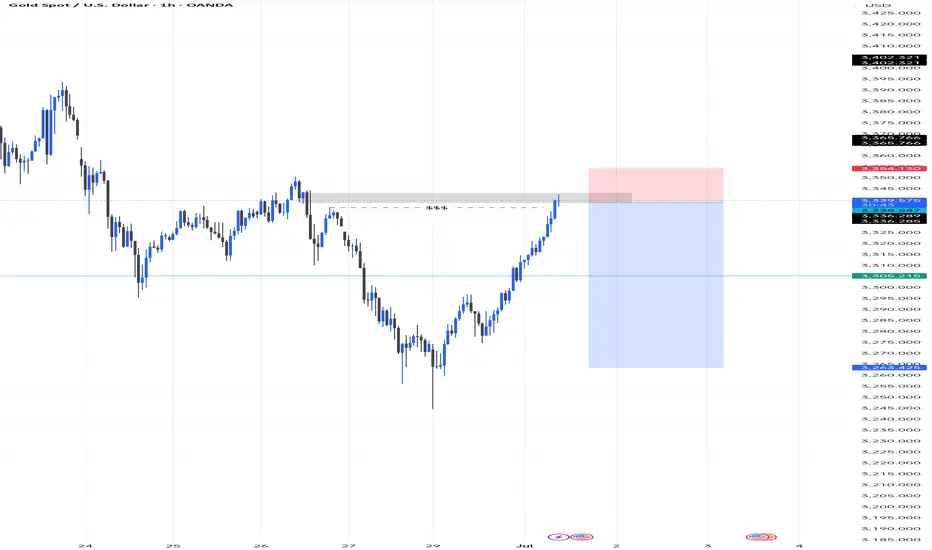
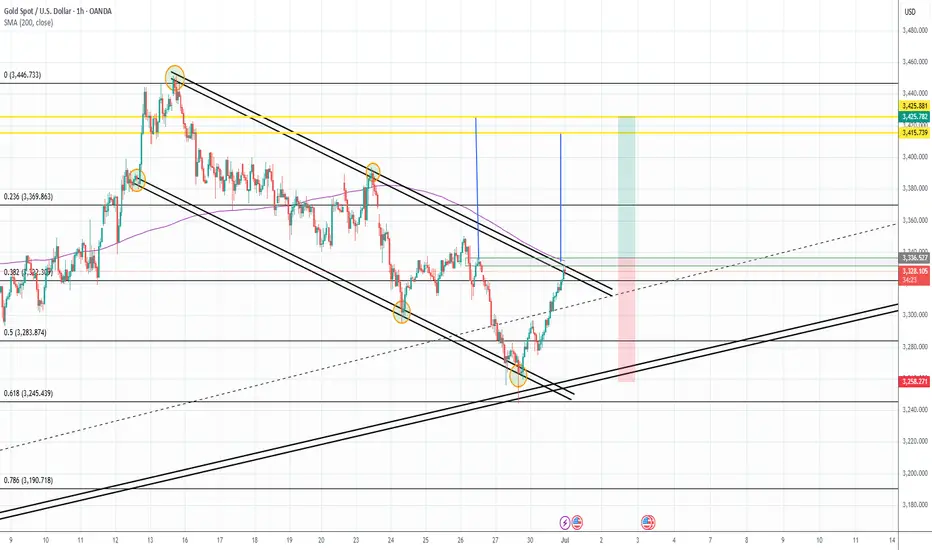
Gold Breaks Key Resistance — Bullish Spike in FormationGold dropped to the 61% Fibonacci retracement level, aligning with the long-term ascending trendline, where it showed a strong bullish rejection.
Currently, price is breaking out of the descending channel and the 200 SMA, and is beginning to form a potential bullish spike formation.
If this pattern completes and breaks to the upside, we would have three confluencing technical signals pointing to a possible target area around $3,425.881.
📌 I’ll wait for a confirmed breakout of the bullish spike to look for long entries.
XAUUSD| - liquidity Driven Buy Setup📌 Pair: XAUUSD
📈 Bias: Bullish
🕰 HTF View (4H):
Last week’s price action formed a bullish continuation structure. Internal major high taken, sweeping liquidity—confirmation of smart money interest. Expecting continuation to upside objectives.
🧭 LTF View (30M):
Waiting for clean major LH break following the sell-side liquidity sweep. Entry zones will be refined once OB mitigation confirms buyer interest.
🎯 Entry Zone:
After SSL sweep + OB tap
🎯 Target: Recent highs and continuation beyond
🧠 Mindset Note:
Trusting the flow from higher-timeframe intention down to precision entries. Patience here pays—let the structure confirm before pressing the trigger.
Bless Trading!
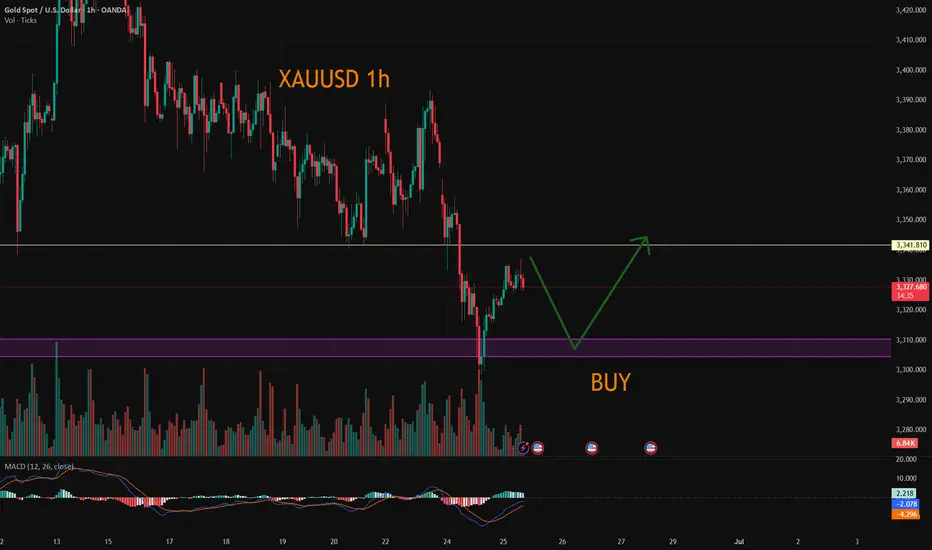
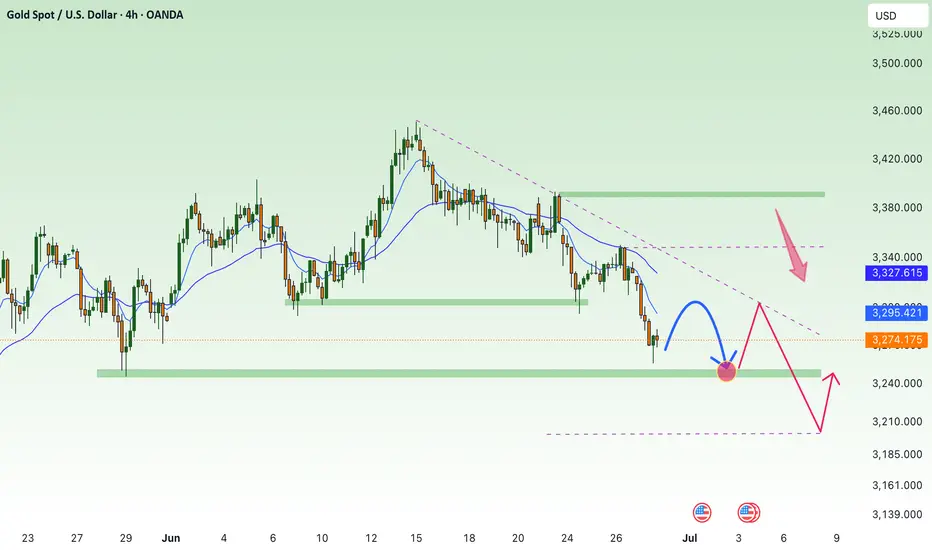
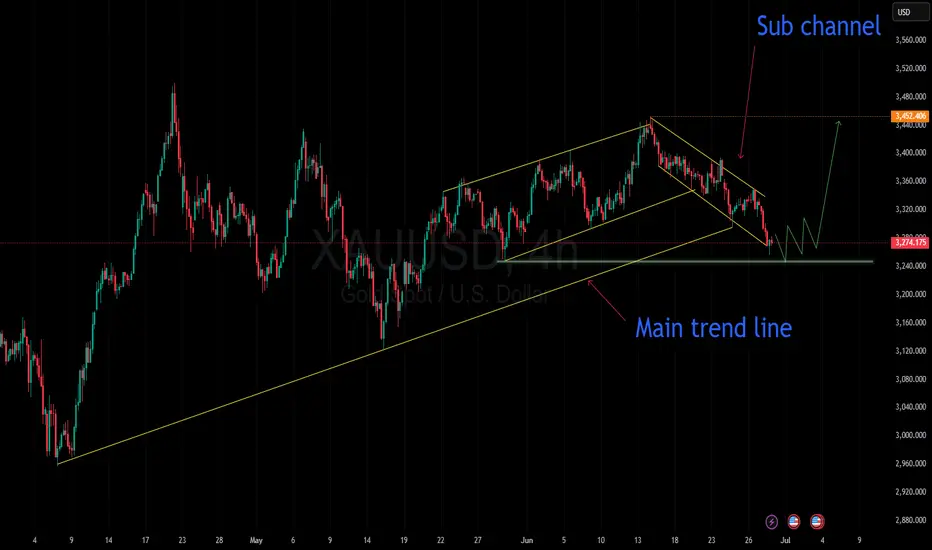
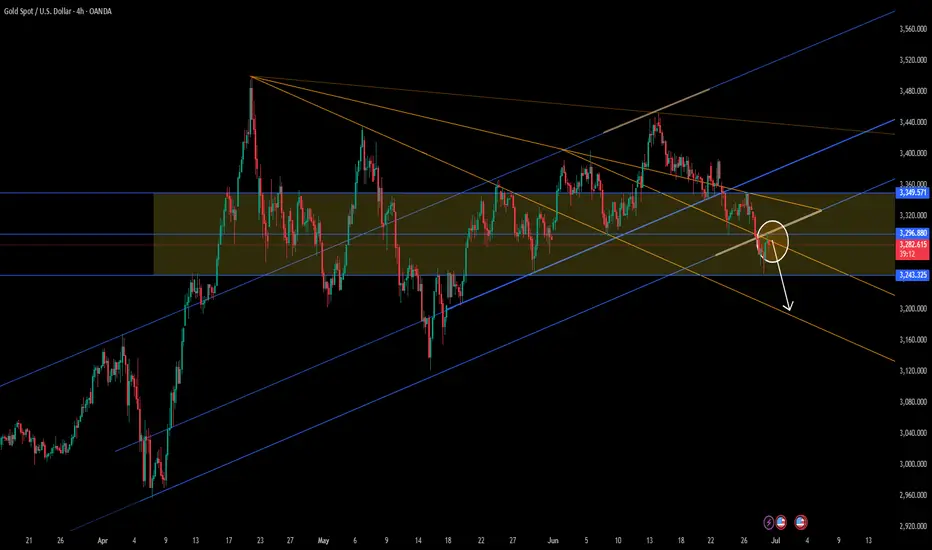
Gold is coiling for a breakout... All eyes on the next move!📉 Gold is currently moving within a minor descending channel.
In yesterday’s analysis, I pointed out the potential for a drop. Now, after a period of range-bound movement, I expect a breakout from this channel and a return to the main trend.
🎯 The first target on a reversal would be the top of the minor channel.
Keep a close eye on price action here — this zone could be key for the next move
OANDA:XAUUSD
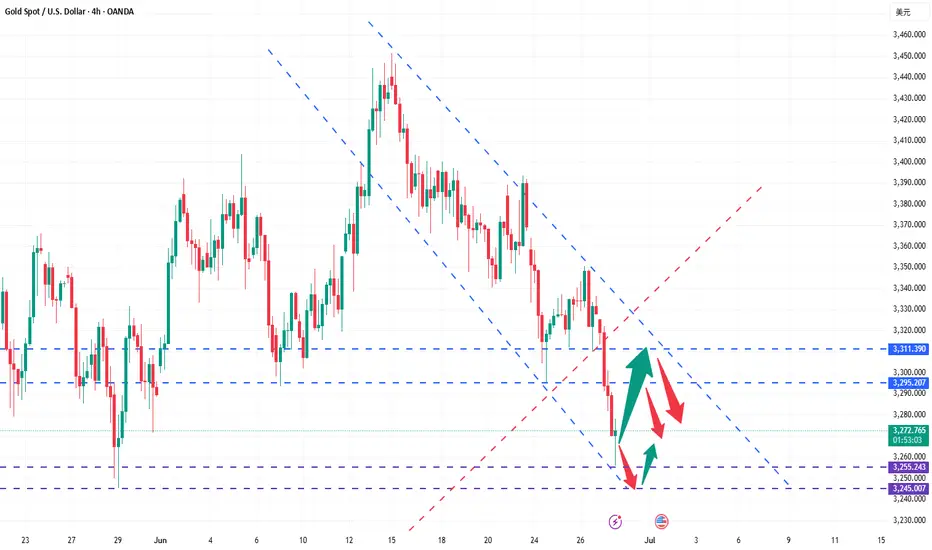
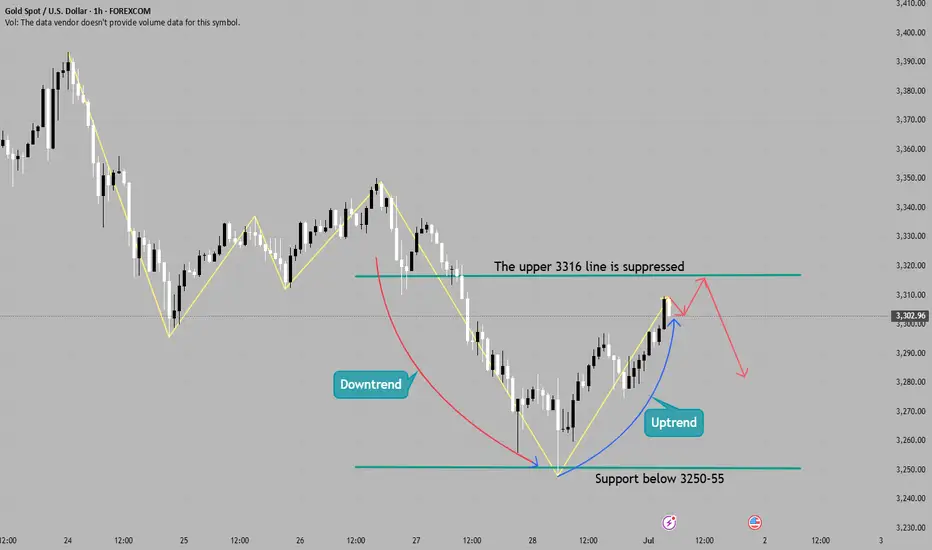
It’s the right time to make a golden layout!Gold opened at 3328 today and started the downward mode. After the European session, it continued to fall and broke the new low. The negative opening data of the US session also continued the downward mode. So far, it has reached the lowest point of 3255 and rebounded, but the strength is not very strong. After all, the upper pressure is still very strong. In the short term, we pay attention to the previous low point of 3295-3300, and focus on the upper 3305-3311. Today, the short-term operation of gold is mainly short-selling on rebounds, and long-selling on callbacks is supplemented.
From the 4-hour analysis, the upper short-term resistance is around 3295-3300, with focus on the important suppression at 3305-3311. The rebound will continue to be mainly short and look to fall back. The lower short-term support is around 3255-3245. Relying on this range as a whole, the main tone of high-altitude and low-multiple participation remains unchanged.
Gold operation strategy:
1. Short-selling in batches near the rebound of gold near 3295-3310, with a target of 3380-3370.
2. When gold falls back to around 3345-3455, go long in batches, with the target at 3370-3380.
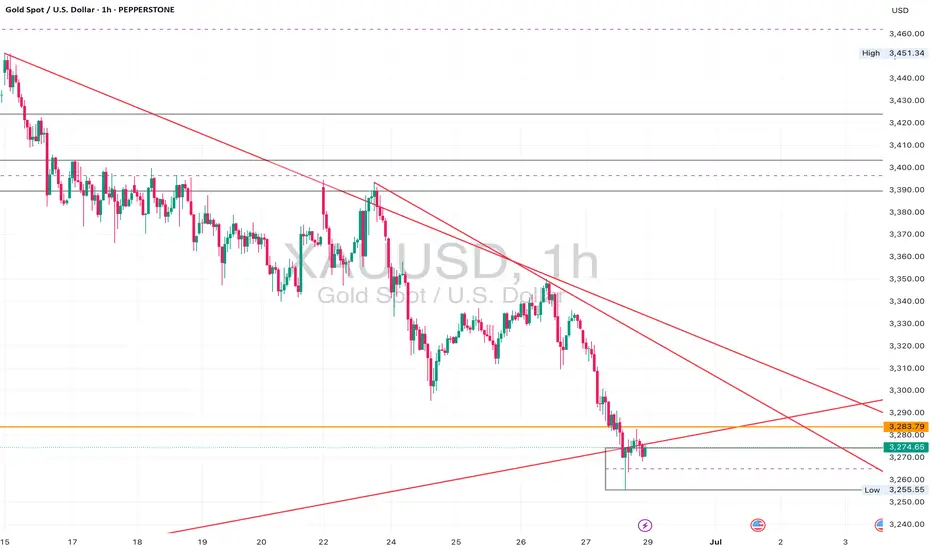
XAUUSD Breakdown: Daily Support Under Fire – Bearish MomentumGold (XAUUSD) is pressing deep into key daily support around $3,275 after a sharp drop from the $3,450s. The daily trendline that’s defined this bullish run since January is now being tested for the first time in months, signaling a possible structural shift.
On the Daily chart, price has decisively broken below the mid-range of the recent consolidation box and is holding near trendline support.
On the 4H and 1H, bearish impulsive waves have formed clear lower highs and lower lows, with the current move stalling at the support zone around $3,265–$3,275.
The 23M chart shows tight consolidation just above this support area, suggesting a potential breakdown if sellers stay in control.
📌 If this level gives way, watch for price to move quickly toward the next major support near $3,150–$3,200. Bulls must reclaim $3,300+ and break above the descending trendline to flip the bias back to bullish.
🚨 Current Bias: Bearish below $3,300; watching for confirmation of breakdown or strong reversal signals.
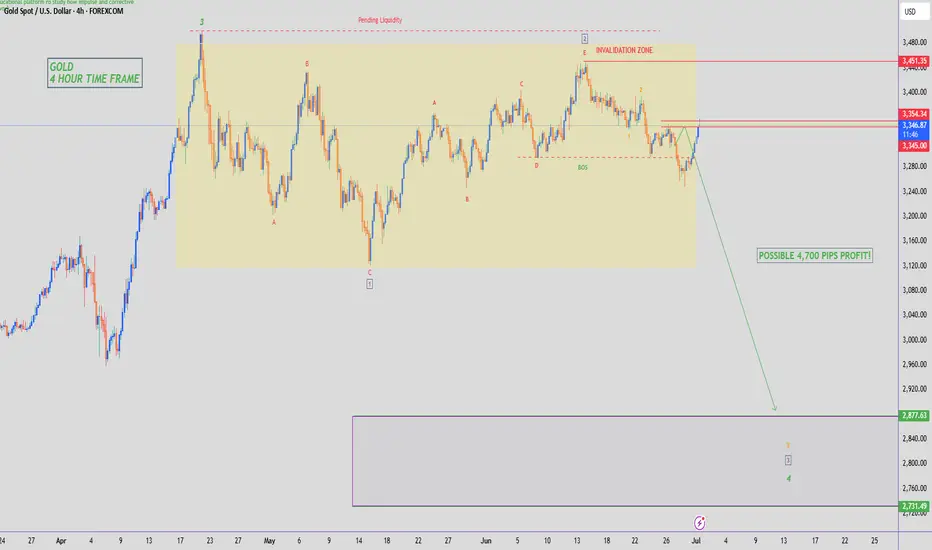
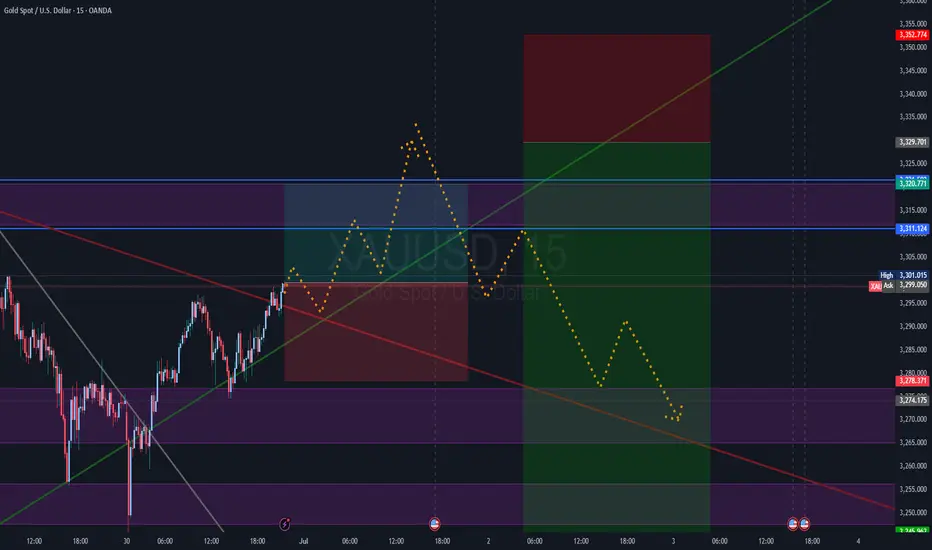
A potential scenario,- let`S see how it unfolds.Strong short term bullish movement. Strong area of resistance . Expect to see a SELL candle for the next month. Looking to take the upper 3295-3315 liquidity, before hunting the 3230 -3210 area.
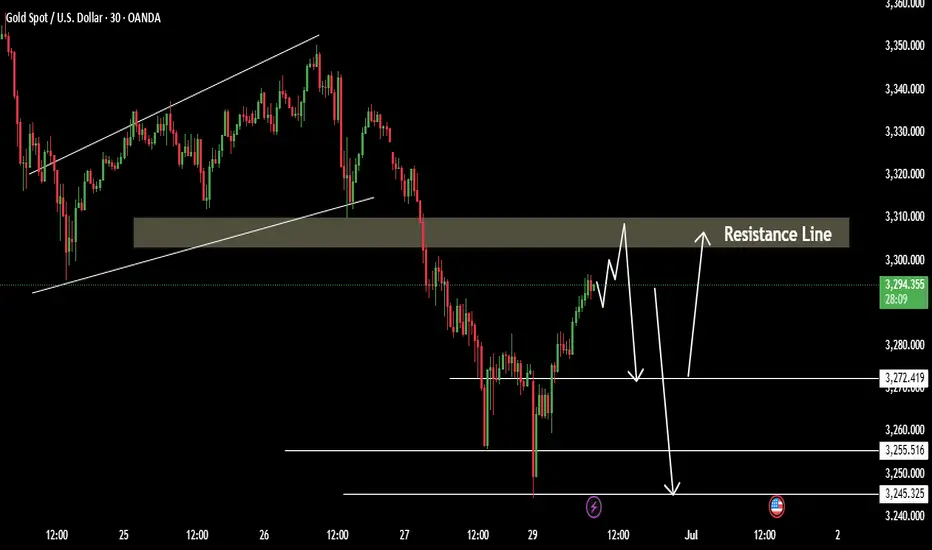
Gold has shown signs of recovery DowntrendXAUUSD Gold Technical Outlook – June 30
Gold has shown signs of recovery at the start of the session, largely supported by a weaker U.S. dollar. However, the upside remains uncertain as long as the price stays below key resistance zones.
Gold is still in a downtrend Price action suggests a potential correction phase Key resistance area lies between 3294 – 3312 Failure to break this zone keeps the bearish pressure intact.
If the price fails to hold above 3272, further downside targets are
Key Levels:
Resistance: 3294 / 3305 / 3312
Support: 3272 / 3255 / 3245
You may find more details in the chart Ps Support with like and comments for better analysis share with you.
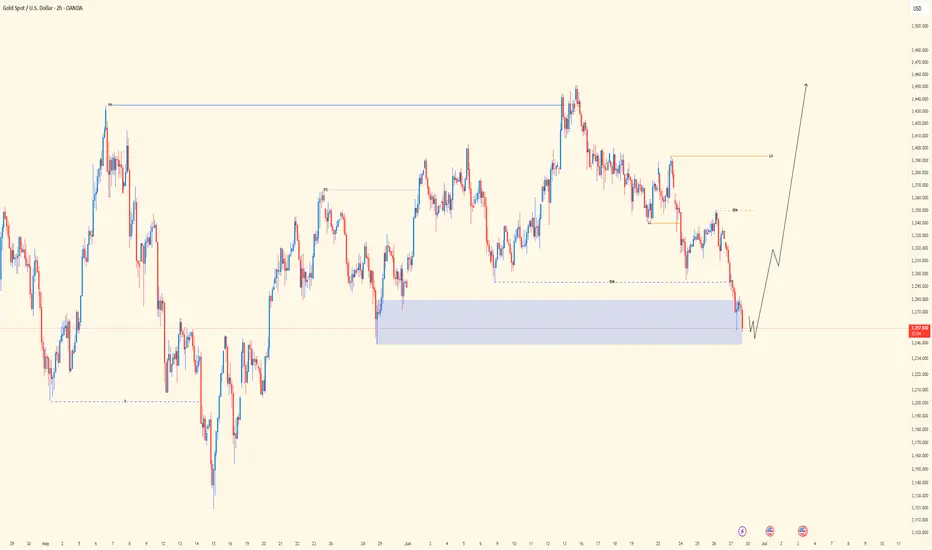
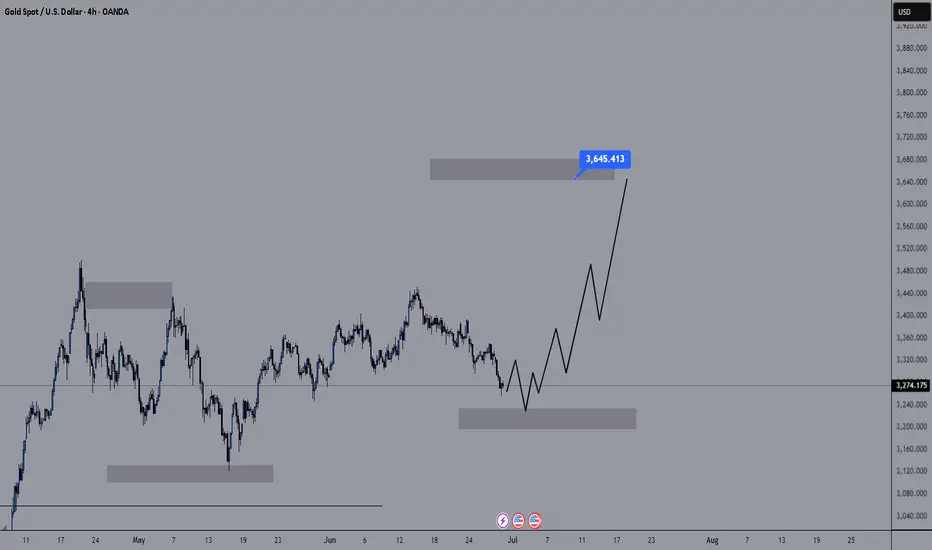
Will this growth spurt be newsless?Hello friends..
As we said in the previous analysis, we are still waiting for another upward leg. (Because the trend is bullish in the long term)
Now we are looking for buying deals in gold next week after the market opens. (Technically, it is in a good range for buying deals)
The lower area that has been identified can be a good range for buying.
You can keep the target for this deal at $3645 (which is good in terms of risk to reward).
.
I hope you have used this analysis well.
You can follow our page to see more analyses.
Continue to short gold below 3300Continue to short gold below 3300
Gold prices fell to a four-week low, but rebounded slightly
Spot gold: Today's lowest hit $3247/oz (the lowest since May 29), and then rebounded to $3296/oz.
Risk aversion cooled, trade easing suppressed gold prices
US-China trade easing: China and the United States reached an agreement on rare earth exports, boosting the stock market (S&P 500 and Nasdaq hit new highs), weakening the safe-haven demand for gold.
G7 tax agreement: Reduce global policy uncertainty, further suppress gold prices.
Trump terminated trade negotiations with Canada and threatened to impose tariffs, which temporarily boosted risk aversion.
Expectations of a Fed rate cut have increased, but short-term hawkish remarks have brought pressure
The market expects a 92.5% probability of a rate cut in September (65-75 basis points for the whole year), but Powell said that the impact of tariffs needs to be waited and see, and the probability of a rate cut in July is only 20%.
Trump said he would appoint a Fed chair who is "willing to cut rates," adding to policy uncertainty.
Geopolitical risks remain
Iran situation: Trump's threat to "bomb Iran again" and abandon sanctions relief has temporarily supported gold prices.
The Russian-Ukrainian conflict continues, but the market has partially digested the risk.
Key technical support and resistance levels
Support:
$3,250 (
$3,200 (if broken, it may fall to $3,120)
Resistance:
$3,280-3,290 (4-hour chart head and shoulders neckline).
$3,306-3,322 (if broken, it may rebound further).
Downside risks:
Trade optimism (US-China trade war, G7 agreement) may continue to suppress safe-haven demand.
If non-farm payrolls are strong this week (released on Thursday), it may push up the dollar and further suppress gold prices.
Upside support:
Geopolitical risks (Iran, Russia-Ukraine conflict) may trigger safe-haven buying.
Fed rate cut expectations still provide long-term support for gold.
Key variables:
July 9 The deadline for US tariff negotiations is on July 15. If no consensus is reached, it may trigger risk aversion in the market.
Fed policy signal: If economic data is weak, expectations of rate cuts may drive gold prices back up.
Technical pattern:
If gold prices hold $3,250, it may rebound to $3,330-3,350.
If it falls below $3,250/3,200, it may fall to $3,120.
Short-term traders: Pay attention to the breakthrough of the $3245-3280 range. If it rebounds to around $3,300, you can consider shorting on rallies. If it falls below $3,245, it may accelerate downward.
GOLD REVERSAL POINT [Bearish Bias]According to this analysis, today I'm expecting a sell opportunity. So here we're analyze 1H time frame, Price is currently moving near a strong order flow area, and has also SIBI is pending. If price faces clear rejection from this key levels, So there is a high probability that the market may decline from this level. Wait with patient and maintain discipline, confirmation is key.
Now let's see how our sell zone plays out.
Always use stoploss for your trade.
Always use proper money management and proper risk to reward ratio.
#GOLD 1H Technical Analysis Expected Move.
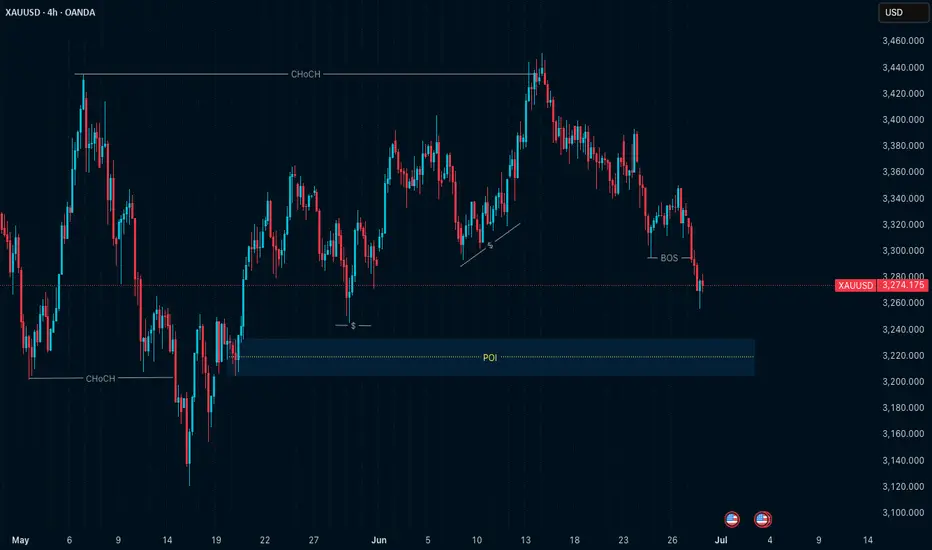
XAUUSD H4 Structure – Eyes on 3225 POI for Possible ContinuationXAUUSD has been in a structured 4H pullback, and price is now approaching a key high-timeframe zone around 3225 — marked by prior CHoCH and unmitigated price action. This level has the potential to act as a base for bullish continuation, but I will only act based on lower timeframe structure.
The trap for most traders is entering too early just because price hits a level.
My approach is different — I wait for the market to tell me when it’s ready.
🔍 The Flow I Follow (As Always):
HTF Context – Price is pulling back within a broader bullish range
POI Identified – 3225 zone = key area of interest
Wait for LTF Shift – I’ll only consider a trade if:
- M15 shows CHoCH (shift in internal structure)
- Followed by a BOS (momentum confirmation)
Then, and only then, I enter. Otherwise, I let it go.
🧠 Why This Matters:
This structure-first mindset keeps me out of random trades.
I don’t predict — I align.
No M15 shift?
No BOS?
No trade.
📊 Chart Context:
The chart attached shows:
Previous CHoCH levels
Recent BOS confirming internal structure break
Cleanly marked POI around 3225
Still no valid LTF shift — so it’s a “watch, not trade” phase
📖 From the Book Philosophy:
“The chart is the mirror. It reflects your level of patience, not your level of prediction.”
This setup reflects exactly what I teach in my book The Chart Is The Mirror — how to stop reacting to candles and start respecting structure.
No signals.
No indicators.
Just clean alignment of levels and psychology.
GOLD/USD 1H – Bullish Reversal SetupLiquidity Collected. Demand Activated. Gold Set to Fly.
🔽 Buy Zone (Demand Area)
Range: 3,235 – 3,245
Liquidity sweep below lows suggests smart money accumulation
Watch for bullish confirmation within this zone
Take-Profit Levels
TP1 ~3,260 Minor structure break
TP2 ~3,280 Liquidity retest zone
TP3 ~3,329 FVG fill & supply mitigation
🧠 Setup Highlights
FVG between 3,295 – 3,310
Smart Money Concepts in play
Ideal reversal timing after June 27 news event
✅ Trade Plan
Entry: Inside demand zone (on confirmation)
Stop Loss: Below 3,222.75
Targets: 3,260 → 3,280 → 3,329
R:R: Favorable if entered near demand base

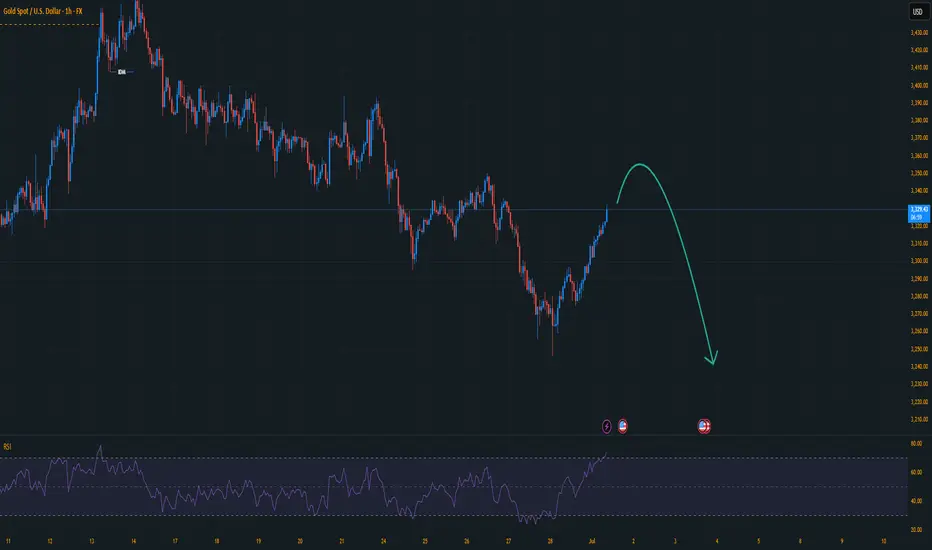
Who will be the winner in the battle between bulls and bears?From the analysis point of view, the short-term resistance above is around 3295-3301, and the pressure at 3315-3316. Focus on the pressure at 3324, the long-short watershed. In terms of operation, the rebound will continue to be the main short and look for a decline. The short-term support below is around 3250-3255. Relying on this range, the main tone of high-altitude participation remains unchanged.
GOLD: Next Move Is Up! Long!
My dear friends,
Today we will analyse GOLD together☺️
The price is near a wide key level
and the pair is approaching a significant decision level of 3,346.90 Therefore, a strong bullish reaction here could determine the next move up.We will watch for a confirmation candle, and then target the next key level of 3,365.74.Recommend Stop-loss is beyond the current level.
❤️Sending you lots of Love and Hugs❤️