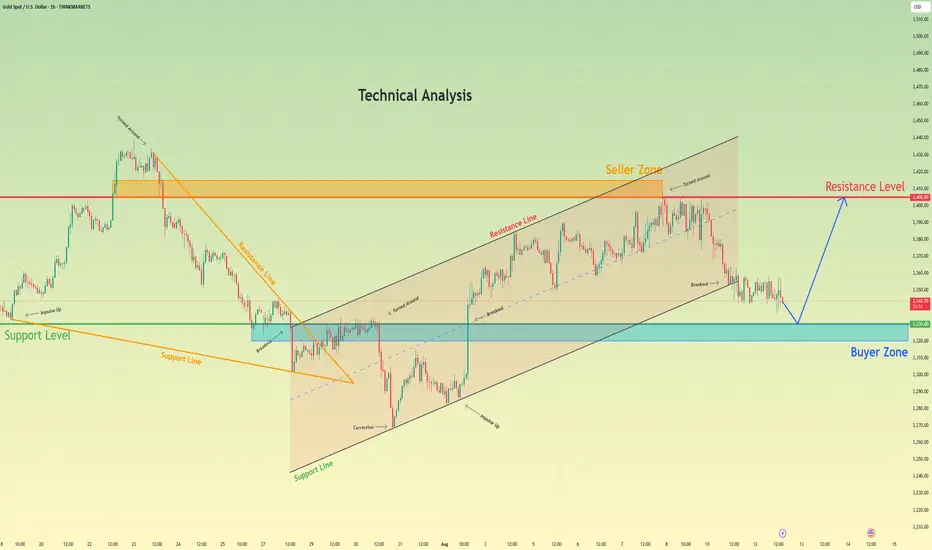
Gold may bounce from support level and rise to resistance levelHello traders, I want share with you my opinion about Gold. The technical narrative for gold has fundamentally shifted from bearish to bullish following a significant breakout from a prior downward wedge. This powerful upward rebound signaled a clear change in market control, invalidating the previous downtrend and establishing a new, constructive market structure. This new structure has taken the form of a well-defined upward channel, which has been guiding the price action higher through a series of impulsive and corrective waves. Currently, the asset is undergoing a natural corrective phase after recently testing the upper resistance line of the channel. This downward correction is guiding the price towards a critical confluence of support located around the 3330 level. This area is significant as it represents the intersection of the channel's ascending support line and a strong horizontal buyer zone. The primary working hypothesis is a long scenario, based on the expectation that buyers will step in to defend this key support confluence and maintain the integrity of the upward channel. A confirmed bounce from this area would likely initiate the next impulsive leg higher within the trend. Therefore, the tp is logically set at the 3405 resistance level, as this represents a full rotation back to the top of the channel and aligns with the major seller zone. Please share this idea with your friends and click Boost 🚀
Disclaimer: As part of ThinkMarkets’ Influencer Program, I am sponsored to share and publish their charts in my analysis.
XAUUSD trade ideas
Gold price continues to increase above 3400, next week✍️ NOVA hello everyone, Let's comment on gold price next week from 08/11/2025 - 08/15/2025
⭐️GOLDEN INFORMATION:
Spot gold held steady on Friday, while futures surged to a record high of $3,534 following reports that the United States will impose tariffs on imported gold bars. Traders also continued to digest recent U.S. economic data as they looked ahead to next week’s key inflation release. XAU/USD last traded near $3,397, little changed on the day.
Overnight, the price spread between New York COMEX futures and spot prices widened by more than $100, Reuters reported, after the Financial Times revealed that the U.S. had levied tariffs on one-kilo gold bars, citing a letter from U.S. Customs & Border Protection.
⭐️Personal comments NOVA:
Gold price accumulates around 3400, buying power remains good as interest rate cut expectations approach
🔥 Technically:
Based on the resistance and support areas of the gold price according to the H4 frame, NOVA identifies the important key areas as follows:
Resistance: $3418, $3437, $3500
Support: $3344, $3310
🔥 NOTE:
Note: Nova wishes traders to manage their capital well
- take the number of lots that match your capital
- Takeprofit equal to 4-6% of capital account
- Stoplose equal to 2-3% of capital account
- The winner is the one who sticks with the market the longest

GOLD (XAUUSD): Bullish Price Action after BreakoutFollowing a breakout of a significant horizontal resistance, 📈Gold retested this level and formed an ascending triangle on the 4-hour chart.
A bullish breakout above its neckline serves as a crucial intraday confirmation of strength of the buyers, suggesting a potential rise to at least 3430 support level.

Hellena | GOLD (4H): LONG to resistance area of 3448 (Wave 3).Dear colleagues, it seems that wave “2” has been formed and now we are seeing the development of wave ‘3’ of the higher order and wave “3” of the middle order.
I think we will see an update of the maximum of wave “1” at 3448.90. A slight correction to the support area of 3341.74 is possible, but there is also a possibility of a continuation of the upward movement without correction.
The target is the resistance area of 3448.
Manage your capital correctly and competently! Only enter trades based on reliable patterns!

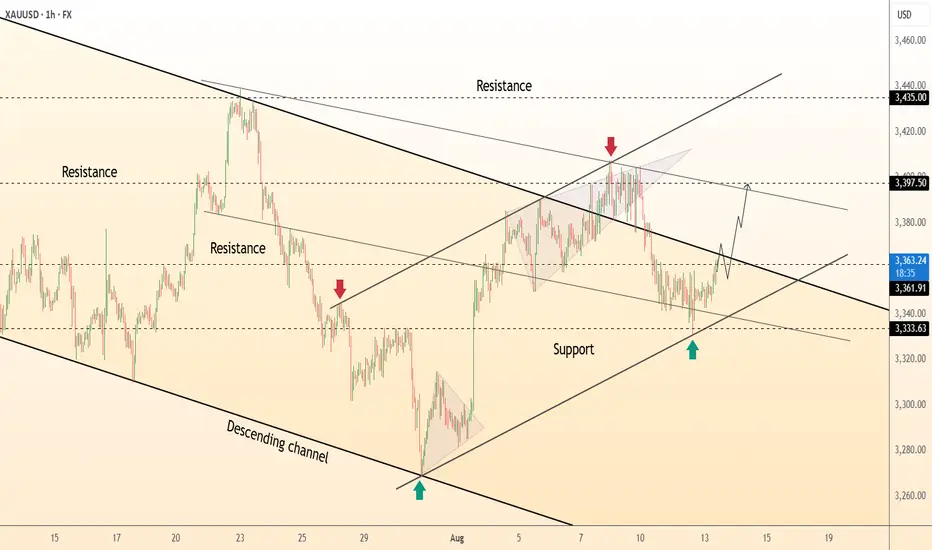
DeGRAM | GOLD is forming a cup with handle📊 Technical Analysis
● XAUUSD rebounded from 3,333 support, reclaiming the midline of its ascending channel and aiming toward the 3,397.5 resistance.
● Price action suggests a short-term bullish leg, with minor consolidation possible before retesting the upper trendline.
💡 Fundamental Analysis
● The dollar eased as Fed officials signaled caution on further tightening, supporting gold’s appeal.
✨ Summary
Bullish above 3,333; targets 3,397.5 → 3,435. Invalidation below 3,333.
-------------------
Share your opinion in the comments and support the idea with a like. Thanks for your support!
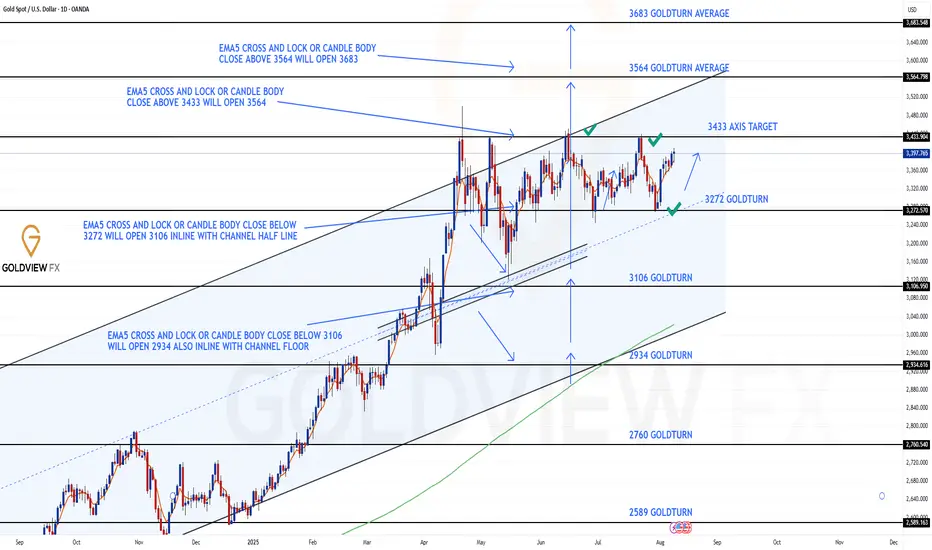
GOLD DAILY CHART ROUTE MAPHey Everyone,
Daily Chart Update
Another Clean Rejection: Structure Still Dominates
Following up on the recent price action last week, the 3372 support level continued to provide support aligned perfectly with the channel half-line, giving us the bounce that continued all the way up to 3409, just short of the 3433 resistance, which once again remains open for a potential test.
We remain in the same structured range, with price still rotating between 3272 and 3433, a 170+ pip zone that continues to deliver high-probability trade setups.
Here’s where we are now:
🔹 Range Still Active
Price is respecting the 3272–3433 boundaries with precision. Until we get a decisive break and hold outside this range, range bound strategies remain in play.
🔹 No Breakout = Clean Rejection
The failure to sustain above 3433 confirms resistance is still valid. We're watching EMA5 for potential breakout confirmation, until then, the bias stays neutral within the range.
🔹 Channel Half-line Bounce
That rejection into 3272 also matched the channel half line, and the bounce there further cements this area as critical support. The latest rally to 3397 reinforces the strength of this pivot.
Updated Key Levels
📉 Support – 3272
Still the major pivot. Buy zones remain valid here unless we see a confirmed breakdown.
📈 Resistance – 3433
Now clearly tested and rejected more than once. Any clean break and hold above could change the dynamic, but until then, it’s solid resistance with 3397 as support.
Thanks as always for your support.
Mr Gold
GoldViewFX
Lingrid | GOLD Potential Bullish Extension Following Pullback OANDA:XAUUSD is rebounding strongly from the support zone after a deep correction from the previous top near 3,437. The price has broken back above the range and formed a new impulse leg, now hovering just above the upward trendline. As long as the structure holds above 3,330, further continuation toward the 3,410–3,437 resistance zone remains likely. The projected wave path shows a bullish scenario targeting a retest of the top trendline.
📉 Key Levels
Buy trigger: Above 3,360
Buy zone: 3,330–3,340
Target: 3,410
Invalidation: Below 3,320
💡 Risks
Rejection from 3,360 trendline may lead to retracement
Failure to hold above 3,330 support could shift bias bearish
Upcoming macroeconomic data might increase volatility
If this idea resonates with you or you have your own opinion, traders, hit the comments. I’m excited to read your thoughts!

Candle patterns that help you always WinHello everyone, if you are struggling to identify price zones, entry points, or simply want to predict the trend of any currency pair, then this article is for you.
I will divide it into several parts, and today we will cover some common patterns — so grab a pen and paper to take notes!
First pattern: ASCENDING TRIANGLE
The ascending triangle is considered a bullish continuation pattern. In order to locate it, we will observe more than one ascending peak. To draw this pattern, a horizontal line (the resistance line) must be placed above the resistance points, and an ascending line (the uptrend line) must be drawn along the support points.
Second pattern: FLAG
The flag pattern is used to identify the possible continuation of a previous trend from a point where the price has drifted against that same trend. If the trend resumes, the price rise could be rapid, making the timing of a trade advantageous when noting the flag pattern.
If you think you have seen a flag to trade, the most important thing is the fast and steep price trend. If the price slowly rises and falls below the flag, you'd better not trade at that time.
3. CUP AND HANDLE
The cup and handle pattern on the price chart resembles a cup with a handle, where the cup is u-shaped and the handle has a slight downward slope.
The cup forms after an upward move and looks like a bowl or rounded bottom. As the cup is completed, a narrow price range develops on the right side and the handle is formed. A subsequent breakout of the trading range that forms the handle indicates a continuation of the previous upward move.
4. DOUBLE BOTTOM
The trajectory of the asset price within the formation of the model resembles the letter "W". The last two price lows, located at approximately the same level, is an area of strong support, in which twice performs an upward price reversal.
When the market price breaks the resistance level of the pattern, the formation of the pattern is complete. The sell signal appears and a change in the trend direction is expected.
5. INVERSE HEAD AND SHOULDERS
This pattern is identified when the price action of a security meets the following characteristics: the price falls to a low and then rises; the price falls below the previous low and then rises again; finally, the price falls again, but not as much as the second low. Once the final low is reached, the price heads upward toward resistance near the top of the previous apexes.
6. ROUNDING BOTTOM
The rounding bottom pattern looks similar to the cup and handle pattern, but does not experience the temporary downward trend of the "handle" portion.
The initial downward slope of a rounding bottom indicates oversupply, which forces the stock price down.
The move to an uptrend occurs when buyers enter the market at a low price, which increases demand for the stock. Once the rounded bottom is completed, the stock breaks out and will continue in its new uptrend.
7. TRIPLE BOTTOM
The Triple Bottom pattern is similar in appearance to the Inverse Head and Shoulders pattern, in that it is represented by a series of three highs and lows.
The difference is that the three highs of the Triple Bottom will have approximately the same height, whereas in the Inverse Head and Shoulders pattern, the second low is lower than the first and third lows.
The appearance of the Triple Bottom indicates the existence of a downtrend, which is currently in the process of reversing into an uptrend.
And here are some classic bullish patterns. In the next parts, I will cover bearish patterns, how to read candlesticks, and technical indicators.
If you find this interesting and useful, please leave me a like and a comment to keep me motivated!
Now, are you ready to trade? Remember and practice these patterns — you’ll soon become a true professional.
Good luck!
Kevinn_Nguyen.
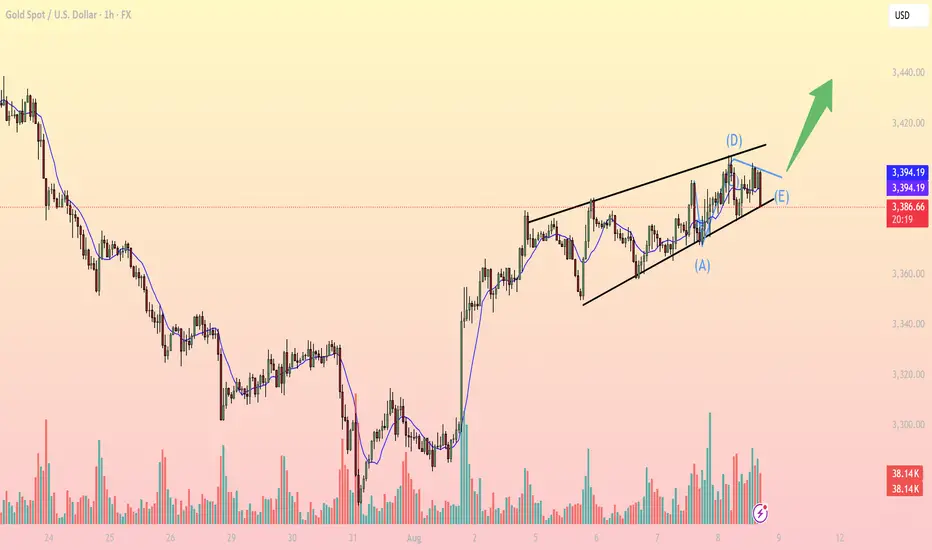
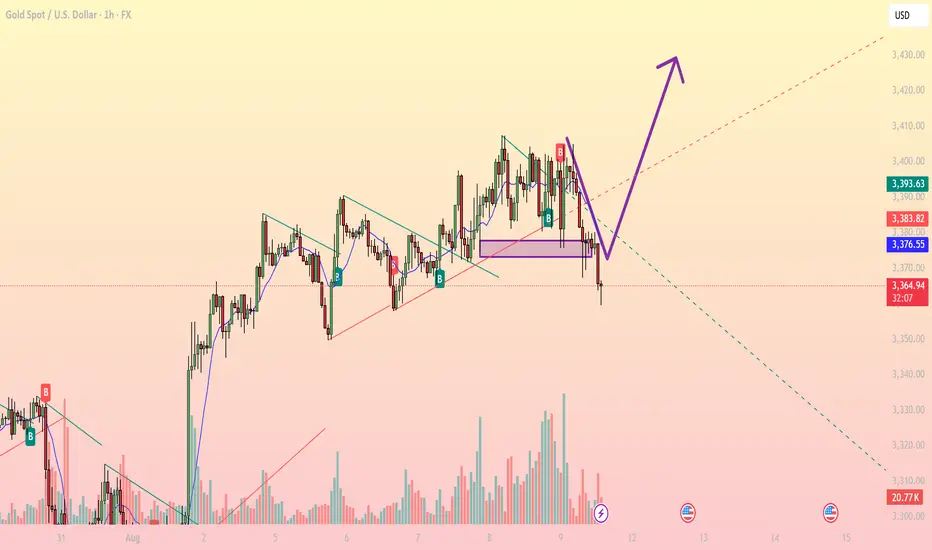
XAUUSD: Triangle Completion Hints at Breakout PotentialOn the 1H timeframe, gold (XAUUSD) is moving within a narrow ascending channel and has recently formed a clear contracting triangle correction pattern (ABCDE). This structure suggests the market is consolidating before a potential breakout to the upside.
Detailed Analysis:
- Elliott Wave Structure:
Price action appears to have completed an ABCDE triangle, a common ending pattern before a breakout wave begins.
The conclusion of wave E implies a possible impulsive move is about to start in the direction of the prior trend – in this case, bullish.
- Trendline & Channel:
Price continues to respect a well-defined ascending channel formed since August 1st, indicating a sustained bullish structure.
The current price (3,398 USD) is nearing the upper boundary of this channel. A successful breakout could push price toward the 3,410–3,415 resistance area.
- Fibonacci Retracement:
The previous correction found solid support around the 0.618 Fibonacci level (~3,360 USD), which serves as a key buy zone if price retraces.
This area is ideal for a buy-the-dip opportunity in case of a pullback.
- EMA & RSI Indicators:
Price remains above the 50-period EMA, supporting the bullish bias.
RSI is trending above 50 and not yet in overbought territory, suggesting momentum still favors the bulls.
Key Support and Resistance Levels:
3,415 – 3,420: Major Resistance -Previous swing high, profit-taking zone
3,400 – 3,405: Minor Resistance - Channel top, potential breakout trigger
3,360 – 3,365: Key Support - Fib 0.618 zone, watch for bullish reaction
3,330
Deep Support
Strong demand zone from H4 chart
Suggested Trading Strategies:
- Strategy 1 – Breakout Buy:
Entry: On confirmed breakout above 3,405 with strong volume.
SL: Below 3,390
TP1: 3,415 | TP2: 3,420+
- Strategy 2 – Buy the Dip:
Entry: On pullback to 3,360–3,365 support zone.
SL: Below 3,350
TP: Return to 3,405–3,415 zone
- Risk Note: Price is currently near resistance – avoid chasing at the top of the channel. Only enter after breakout confirmation or wait for a retest of support for better R:R setups.
Conclusion:
Gold is showing strong potential for a bullish breakout following the completion of a classic triangle correction pattern. Focus on price action around the 3,400 level for intraday trading opportunities.
Ascending triangle pattern is formed✏️Gold is consolidating in a triangle pattern. This is likely an ascending triangle pattern. We can wait for strong enough buying pressure to break the upper boundary to trigger the BUY strategy. Or wait for a reaction at the lower boundary of the triangle pattern to trigger the BUY. 3365 is broken to confirm a corrective downtrend towards 3333.
📉 Key Levels
Buy trigger: Breakout of the upper triangle pattern 3385
Buy trigger: Reaction of the buying candle at 3365
Target 3419
SELL Trigger Break and Retest bellow 3365
Leave your comments on the idea. I am happy to read your views.
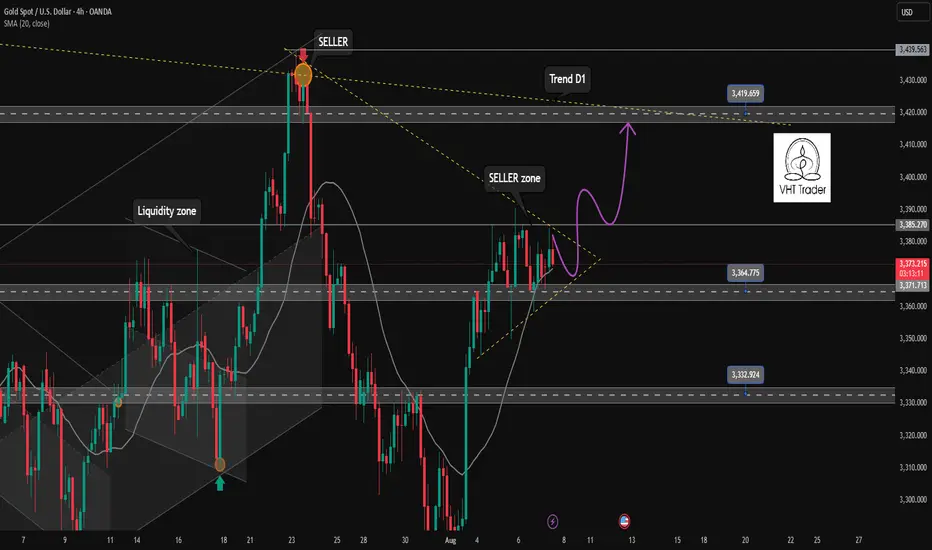
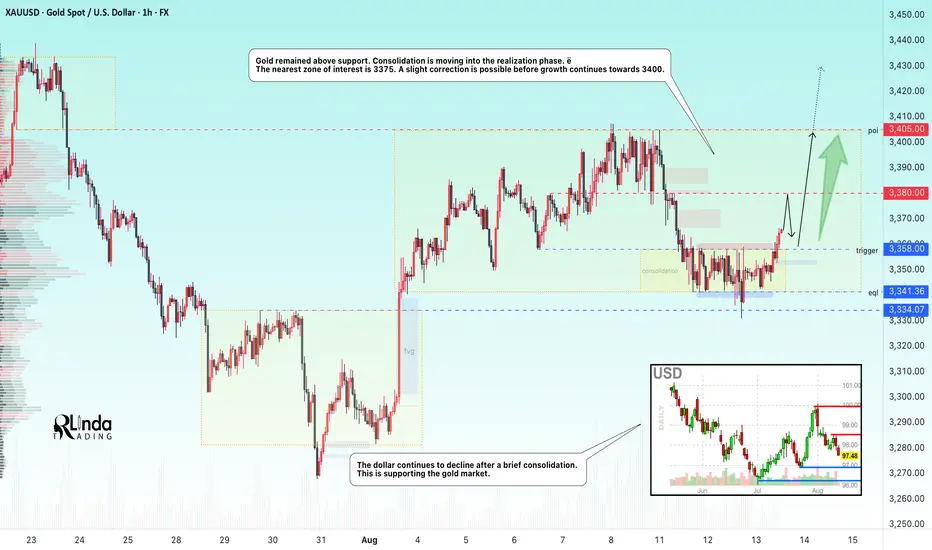
GOLD → From consolidation to distribution. Target 3400FX:XAUUSD is entering a distribution phase after the end of consolidation. The market is strong, bulls managed to keep prices from falling and formed an intermediate bottom in the 3340 zone.
The price increase was supported by expectations of a soft Fed policy after moderate July CPI data (2.7% y/y, 0.2% m/m, core 0.3%), which led to a decline in bond yields and a weakening of the dollar. However, demand for safe assets is declining amid optimism in global markets, fueled by the US-China trade truce, a possible meeting between Trump and Putin, and bets on a Fed rate cut in September. In the long term, gold could be supported by purchases by the Chinese central bank and a recovery in jewelry demand in India.
Technically, the focus is on the zone of interest ahead at 3370-3373, with a possible rebound before growth, as well as on the support zone at 3359. I do not rule out that the market may test the liquidity zone...
Resistance levels: 3370, 3380, 3400
Support levels: 3358, 3341, 3334
There is considerable potential within the consolidation, and the rally may be directed towards the resistance range of 3400. However, pullbacks are possible before growth, which could give us a good entry point.
Best regards, R. Linda!
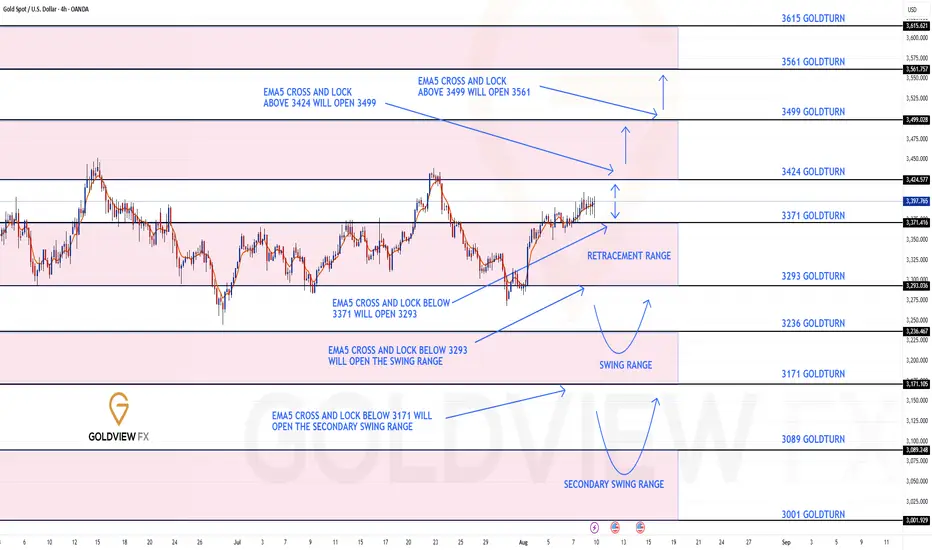
GOLD 4H CHART ROUTE MAP UPDATE & TRADING PLAN FOR THE WEEKHey Everyone,
Please see our updated 4h chart levels and targets for the coming week.
We are seeing price play between two weighted levels with a gap above at 3424 and a gap below at 3371. We will need to see ema5 cross and lock on either weighted level to determine the next range.
We will see levels tested side by side until one of the weighted levels break and lock to confirm direction for the next range.
We will keep the above in mind when taking buys from dips. Our updated levels and weighted levels will allow us to track the movement down and then catch bounces up.
We will continue to buy dips using our support levels taking 20 to 40 pips. As stated before each of our level structures give 20 to 40 pip bounces, which is enough for a nice entry and exit. If you back test the levels we shared every week for the past 24 months, you can see how effectively they were used to trade with or against short/mid term swings and trends.
The swing range give bigger bounces then our weighted levels that's the difference between weighted levels and swing ranges.
BULLISH TARGET
3424
EMA5 CROSS AND LOCK ABOVE 3424 WILL OPEN THE FOLLOWING BULLISH TARGETS
3499
EMA5 CROSS AND LOCK ABOVE 3499 WILL OPEN THE FOLLOWING BULLISH TARGET
3561
BEARISH TARGETS
3371
EMA5 CROSS AND LOCK BELOW 3371 WILL OPEN THE FOLLOWING BEARISH TARGET
3293
EMA5 CROSS AND LOCK BELOW 3293 WILL OPEN THE SWING RANGE
3236
3171
EMA5 CROSS AND LOCK BELOW 3171 WILL OPEN THE SECONDARY SWING RANGE
3089
3001
As always, we will keep you all updated with regular updates throughout the week and how we manage the active ideas and setups. Thank you all for your likes, comments and follows, we really appreciate it!
Mr Gold
GoldViewFX
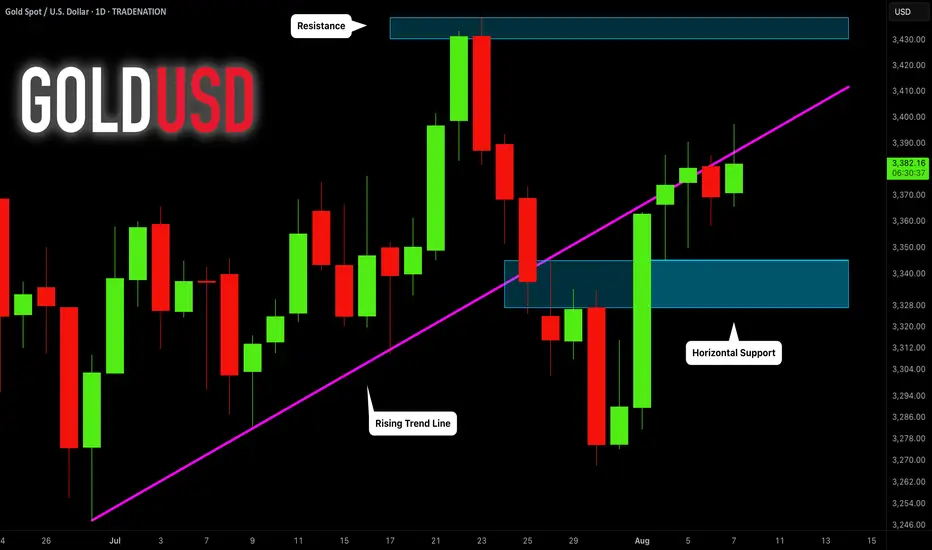
GOLD (XAUUSD): Technical Analysis Ahead of Trump
One of the important news for today is Trump speech during
the late New York session.
Here is my brief technical outlook for Gold ahead of that.
As we discussed on the yesterday's live stream, the price
is now coiling on a recently broken rising trend line that serves
as a vertical resistance now.
A bullish breakout of that and a daily candle close above
will provide a strong bullish confirmation and push the prices to 3430.
Alternatively, very bearish news today may trigger a retracement
to an underlined horizontal support.
Let's see how the market is going to react tonight.
❤️Please, support my work with like, thank you!❤️
I am part of Trade Nation's Influencer program and receive a monthly fee for using their TradingView charts in my analysis.
XAUUSD New ATH Coming Soon ?? Or Smart Money Distribution ??Gold closed the week strong, printing a large bullish daily candle. On the surface, it looks like momentum is ready to push us toward the all-time highs around $3,500.
But here’s the tricky part, as always in trading…
The volume delta on that candle is massively negative. That means heavy selling pressure came in while price was still moving up.
So, what’s going on? Two possible scenarios for next week:
1.Absorption (Bullish Case)
Large players are absorbing aggressive sellers, keeping price pinned at the highs. If that’s true, Monday could open with a gap up and follow-through toward new ATH.
2.Distribution (Bearish Case)
The big boys are unloading positions into eager late buyers. A gap up that’s quickly sold into or a gap down from Monday’s open could signal a deeper retrace back to the $3,300 area.
Key Levels to Watch:
$3,400 → Break & hold = ATH in sight.
$3,380 → Break & hold = distribution in sight.
$3,300 → Possible downside target if distribution confirmed.
Monday’s open is critical. The chart tells us there was massive orders on Friday and whichever positions they build up in Friday's range will show next week. And that could decide the trend for the rest of August.
As always trade safely peeps!!

GOLD NEXT MOVE (expecting a bearish move)(08-08-2025)Go through the analysis carefully and do trade accordingly.
Applicable- once price reaches the 3372-75
Anup 'BIAS for the day (12-08-2025)
Current price (as per applicability)- 3370-75
"if Price stays below 3388, then next target is 3365, 3355 and 3300 and below that 3250 and above that 3400 ".
-POSSIBILITY-1
Wait (as geopolitical situation are worsening )
-POSSIBILITY-2
Wait (as geopolitical situation are worsening)
Best of luck
Never risk more than 1% of principal to follow any position.
Support us by liking and sharing the post.
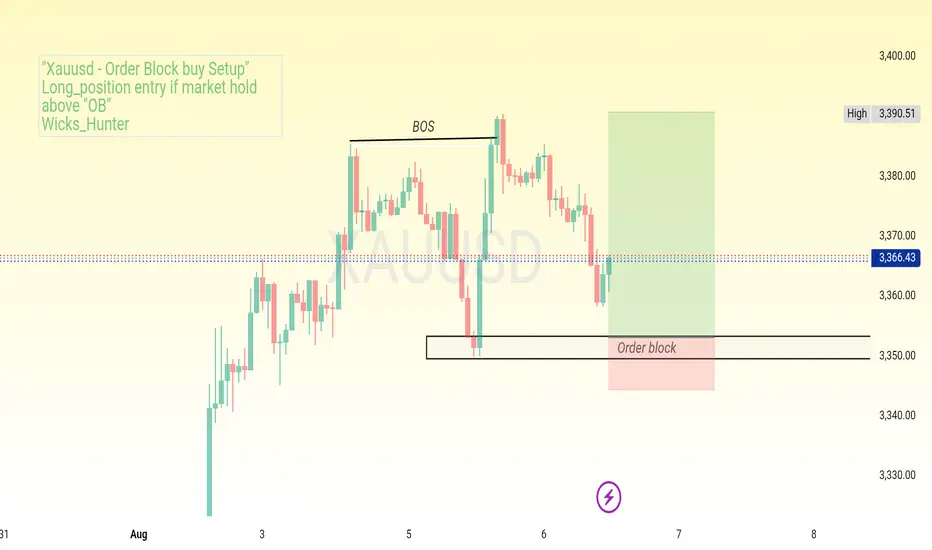
Order Block buy setup
XAUUSD H1 — Order Block Buy Setup 📈"
BOS confirmed .Price retracing to order block (3350–3353).
Looking for bullish reaction to target 3390–3400.
Risk small, aim big.
#XAUUSD #GoldAnalysis #OrderBlock #BOS #PriceAction #SmartMoney #TradingSetup #Forex #Gold #SwingTrade #TechnicalAnalysis #RiskReward #TradingPlane
XAUUSD Rebound Setup Toward Key Resistance LevelsGold is testing its support trend line near 3,376, with potential for a rebound toward resistance at 3,401. A breakout above this level could open the path to the target zone around 3,425.

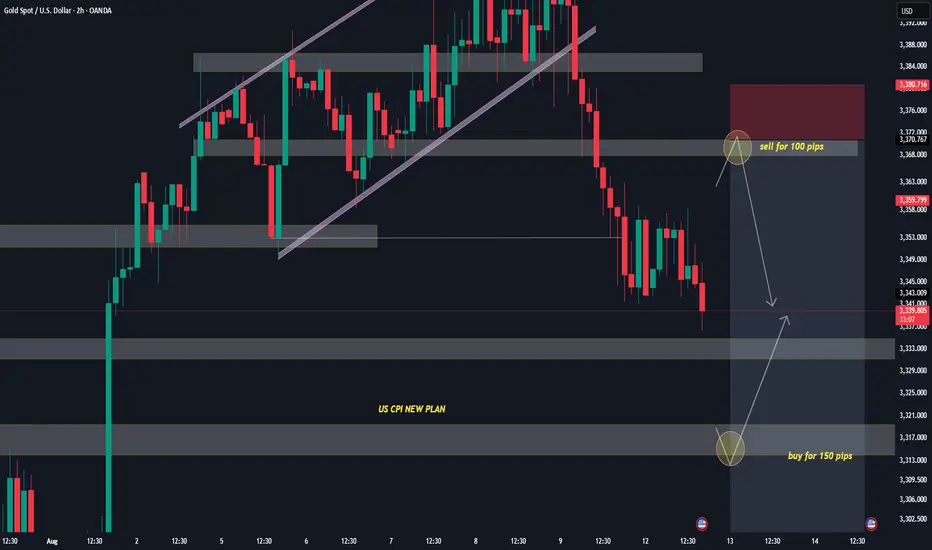
Gold Coils for a Big Move – Here’s My Plan1. Market Recap
Monday was a nasty day for Gold bulls, with the price slowly bleeding lower until it reached 3340 support.
Since then, price action has been trapped in an annoying range, swinging violently between support and resistance — just like in the final days of last week. Even yesterday’s CPI release failed to spark a real directional move, adding nothing but short-lived noise.
2. The Key Question
Has Gold finished consolidating, and is it ready to break out of this range?
3. Why I Lean Bullish at this Moment
• The recent spike down to 3330 support aligns perfectly with the Fibonacci golden zone.
• Stabilization around 3350 suggests the market is finding a short-term balance point.
• Resistance at 3360 is the critical barrier — once cleared, it could confirm a reversal.
4. Trading Plan
I hold a bullish bias for the near future.
• A confirmed break above 3360 could open the path to 3380 resistance and possibly a fresh test of 3400.
• A sustained drop below 3330 would cancel this scenario and shift the focus back to the downside.
5. Closing Note
Gold is coiled in a range — the next breakout will set the tone. Let’s see if the bulls have the fuel for a move higher. 🚀
Disclosure: I am part of TradeNation's Influencer program and receive a monthly fee for using their TradingView charts in my analyses and educational articles.

GOLD Will Keep Growing! Buy!
Hello,Traders!
GOLD is trading in an
Uptrend and the price
Made a retest and rebound
So we are bullish biased
And we will be expecting
A further bullish move up
Buy!
Comment and subscribe to help us grow!
Check out other forecasts below too!
Disclosure: I am part of Trade Nation's Influencer program and receive a monthly fee for using their TradingView charts in my analysis.

XAUUSDHello Traders! 👋
What are your thoughts on GOLD?
Gold saw a strong rally on Friday following the U.S. Non-Farm Payrolls (NFP) report and is now trading near a key resistance zone.
At this resistance, a short-term pullback is likely as traders lock in profits.
We expect the correction to be contained within key support levels, and if price holds in that zone, the uptrend is likely to resume, targeting new highs.
Will gold resume its rally after the correction? Share your view below! 👇
Don’t forget to like and share your thoughts in the comments! ❤️

THE KOG REPORT - UpdateEnd of day update from us here at KOG:
A frustrating day in terms of price action as we ranged between the two key levels, however, this did give us opportunities to capture a few scalps in the direction of Excalibur, so we can't complain.
We now have resistance at the 3355 level with support at the 3333 level which will need to hold us up to go higher and clear that void from above. We mentioned earlier an attempt at 3330 where our hot spot was sitting which gave us another good entry, I would expect there to be an undercut low if that level is broken. So, if we do get closed at break even, we'll be watching that 3310 level tomorrow! Otherwise, the ranging continues, more news tomorrow and hopefully we can start some nice swings on this.
As always, trade safe.
KOG

XAUUSD Buying Opportunity from Key Support ZoneXAUUSD – Gold Price Analysis for August 11, 2025: Buying Opportunity from Key Support Zone
In today’s session, gold (XAUUSD) on the H1 timeframe is pulling back after breaking the short-term support zone at 3,376 – 3,378 and moving down towards 3,356 – 3,358 – which aligns with the 0.618 Fibonacci retracement of the previous bullish swing. This is a key support area where buyers may step in if the market reacts positively.
1. Technical Analysis
EMA: Price is trading below the short-term EMA, showing sellers in control, but the gap is small, leaving room for a potential rebound.
Fibonacci: The 0.618 level around 3,356 acts as a technical pivot and strong support.
RSI: Approaching oversold territory, signaling a possible technical bounce.
Trendline: Price is testing the medium-term ascending trendline from late July. Holding this level would strengthen the bullish outlook.
2. Key Price Levels
Near-term Resistance: 3,376 – 3,378
Major Resistance: 3,383 – 3,384 and 3,393 – 3,395
Near-term Support: 3,356 – 3,358
Major Support: 3,340
3. Trading Strategies
Primary Scenario: Buy around 3,356 – 3,358, stop loss below 3,348, take profit at 3,376 – 3,378, extended targets at 3,383 – 3,393.
Alternative Scenario: If price breaks below 3,348 with strong volume, consider selling towards 3,340 – 3,328.
Today’s bias remains buying at support – taking profit at resistance. Traders should closely monitor price action at these levels to optimize entries.
Follow for more actionable gold trading strategies in the upcoming sessions.
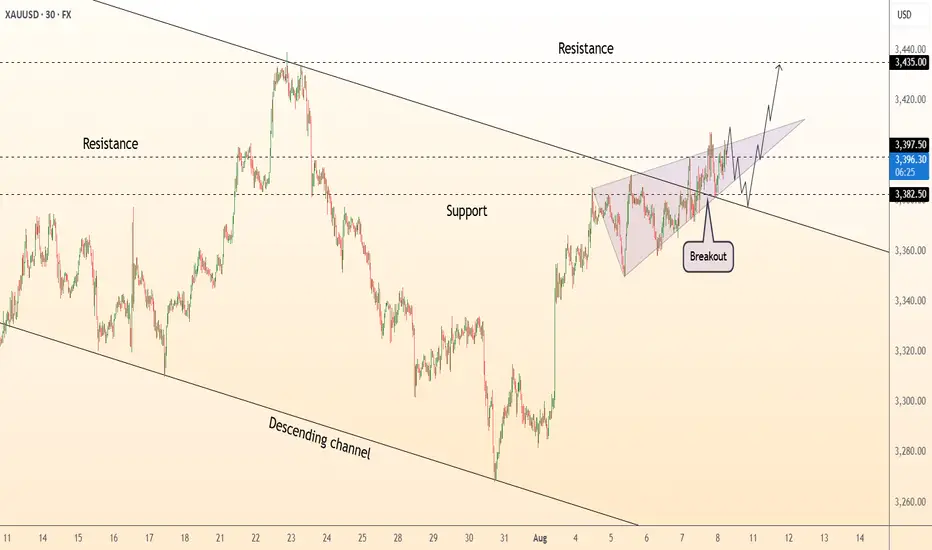
DeGRAM | GOLD above the descending channel📊 Technical Analysis
● XAUUSD broke above the descending channel and confirmed a breakout from a narrowing wedge near 3,382, signaling bullish continuation.
● The price structure now targets the 3,435 resistance, with pullbacks likely to retest the breakout zone before the next leg higher.
💡 Fundamental Analysis
● Gold is supported by renewed safe-haven demand after geopolitical tensions in the Middle East and weaker-than-expected US ISM services data, which pressured the USD.
✨ Summary
Buy above 3,382; target 3,435. Setup remains valid while holding above 3,360.
-------------------
Share your opinion in the comments and support the idea with a like. Thanks for your support!