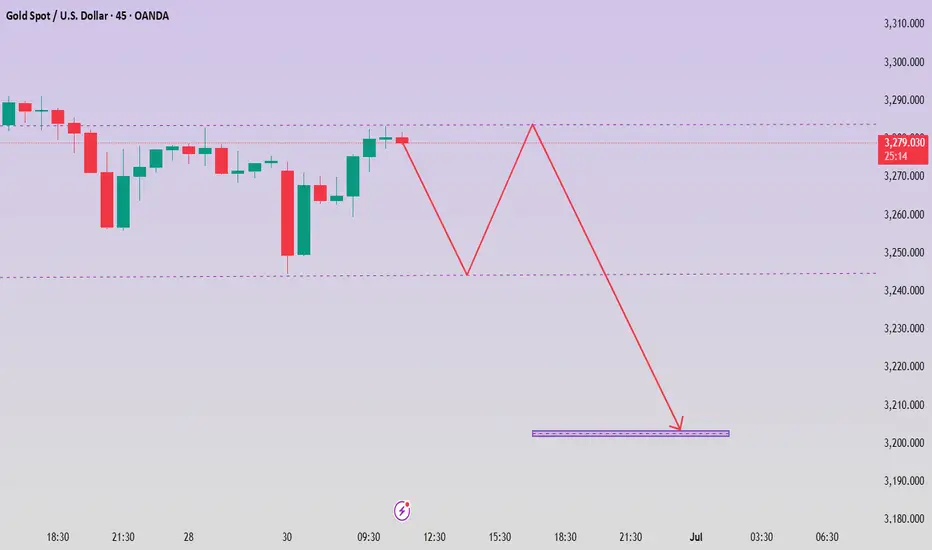
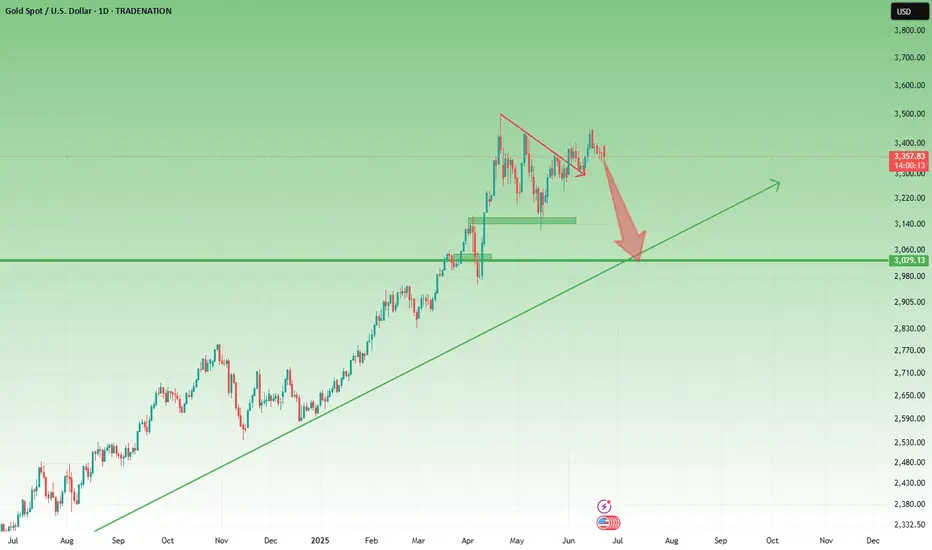
GOLD LONG TERMGold made a good push from 3250 and back up over 1000 pips.
Additionally, a break above 3340 failed, making a lower low below, opening up opportunity for further drops.
Also a perfect equal lows at 3250. Let's see if price sets up retracement sells from 3360-70 zone.
XAUUSD trade ideas
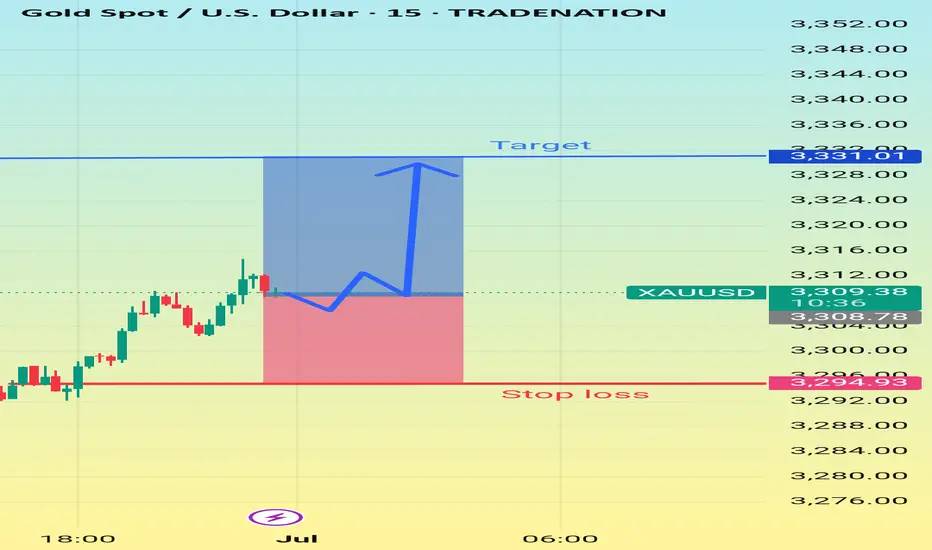
Gold Analysis and Trading Strategy – July 1✅Yesterday, gold staged a strong “V-shaped reversal,” surging violently from the intraday low of $3247 to a high of $3309. The daily chart closed with a large bullish candlestick featuring a long lower shadow, initially confirming the validity of short-term bottom support and signaling a strong bullish rebound.
✅Fundamental Overview:
The U.S. Dollar Index recorded its sixth consecutive monthly decline, further falling today to 96.87—the longest losing streak since 2017. This reflects growing market expectations for future Fed rate cuts. A weakening dollar has strengthened non-U.S. currencies and reduced the holding cost of gold, providing upward momentum for gold prices.
✅Technical Analysis:
Gold is currently in a technical rebound phase. After reclaiming the key $3300 level yesterday, the short-term trend has returned to a bullish stance. A bullish consolidation structure is now confirmed. However, on the daily chart, prices are still capped below the 10-day and 20-day moving averages (around $3330–3340), while the RSI remains in a weak adjustment phase below the midline, suggesting medium-term direction remains uncertain. In the short term, bulls dominate. The 4-hour chart shows consecutive bullish candles breaking above the middle Bollinger Band, with a golden cross forming near the $3285 area. The 1-hour chart shows Bollinger Bands expanding upward, with prices riding the upper band and moving averages in bullish alignment.
🔴Key Resistance Levels: 3328 – 3335 – 3348
🟢Key Support Levels: 3305 – 3282 – 3271
✅Trading Strategy for Asia–Europe Session:
🔹 Long Positions:
🔰If gold remains firmly above $3300, consider entering long positions on pullbacks to the $3305–3308 zone. Set a stop-loss below $3300 and aim for a target range of $3328–3335.
🔰If the price breaks above the $3328 resistance with volume confirmation, consider adding to long positions near $3330, with upside targets at $3345–3350.
🔹 Short Positions:
🔰If gold rallies toward $3328 but fails to break through, and upward momentum weakens, consider light short positions. Set a stop-loss above $3335, with downside targets at $3310–3305.
🔰If the price unexpectedly breaks below the $3280 support, possibly triggering algorithmic selling, the correction may extend further toward the $3250–3260 range.
✅Currently, gold continues to show a moderately bullish trend, and the European session is expected to fluctuate within the core range of $3300–3335. Strategically, it's recommended to prioritize buying on dips, with shorts considered only on failed rallies. If upcoming U.S. data strengthens expectations for Fed rate cuts, gold could break above the $3350 threshold. Conversely, if the data is strong or geopolitical risks ease, be cautious of a potential pullback, with key defense support at $3280.
Geopolitical Spike Fades Fast – Gold Eyes 3300As highlighted in Friday’s analysis, the daily and short-term charts remain messy, but the weekly chart is leaning clearly bearish – with a potential Dark Cloud Cover candlestick formation now confirmed.
🌍 Geopolitical Gap Up... and Quick Rejection
Monday’s Asian open brought a gap up, triggered by renewed tensions in the Middle East. But price failed to break above 3400 and quickly reversed – a textbook sign of weakness, not strength.
🧭 Technical View:
- The weekly candle closed as a Dark Cloud Cover, a strong bearish reversal signal
- The lack of follow-through after the gap up further confirms sellers are still in control
- Price remains below the key 3400 level, showing no bullish momentum behind recent spikes
📌 Trading Plan:
I continue to sell rallies, with an initial target near 3300. If bearish momentum builds, lower levels are in play.
Let the chart lead – don’t get distracted by the noise.
Disclosure: I am part of TradeNation's Influencer program and receive a monthly fee for using their TradingView charts in my analyses and educational articles.
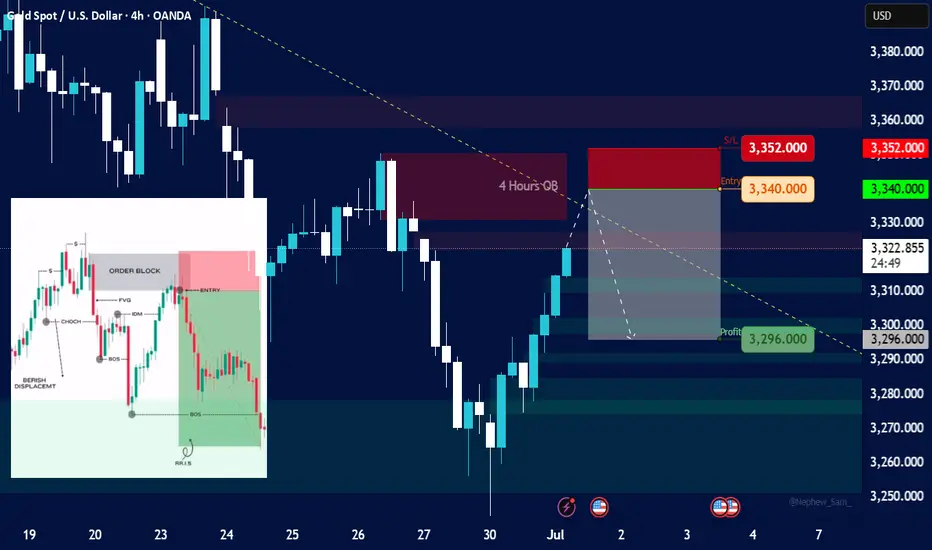
GoldHere's an analysis based on the information presented in the image:
Overall Market Structure (from a quick glance):
Recent Price Action: The price has recently experienced a significant decline, followed by a bounce.
Order Block (OB): There's a clearly marked "4 Hours OB" (Order Block) which is a key area of interest for potential resistance.
Potential Trading Setup:
Entry: The "Entry" price is set at 3,340.00. This entry point is within the bearish order block, suggesting a short (sell) position.
Stop Loss (S/L): The "S/L" is placed at 3,352.00. This is above the high of the 4-hour order block, aiming to limit losses if the price moves against the short position and breaks above the resistance.
Take Profit (Profit): The "Profit" target is set at 3,296.00. This target is significantly lower than the entry, aiming to capture a downward movement.
Risk-Reward Ratio:
Risk: The difference between the entry (3,340.00) and the stop loss (3,352.00) is 12 points.
Reward: The difference between the entry (3,340.00) and the take profit (3,296.00) is 44 points.
Ratio: This implies a risk-reward ratio of approximately 1:3.67 (44 / 12), which is generally considered favorable.
Key Technical Concepts Illustrated (from the inset image):
The smaller inset image on the left illustrates concepts commonly used in Smart Money Concepts (SMC) or Institutional Order Flow (IOF) trading:
Order Block (OB): A price range where significant institutional buying or selling occurred, often leading to price reversals. The red box indicates a bearish order block.
Entry: The point at which a trade is entered.
FVG (Fair Value Gap) / Imbalance: An area on the chart where price moved quickly in one direction, leaving an "inefficiency" or gap that price often retests.
CHoCH (Change of Character): An early sign of a potential trend reversal, indicating a shift in market sentiment.
BOS (Break of Structure): When price breaks a significant high (for a bullish trend) or low (for a bearish trend), confirming the continuation or reversal of a trend. The multiple "BOS" labels suggest a series of lower lows, confirming a bearish trend.
BERISH DISPLACEMENT: Implies strong bearish momentum leading to lower prices.
PRLII S: This specific acronym is not universally recognized but could refer to a specific pattern or setup within the trader's methodology, possibly related to liquidity or price action.
Conclusion/Potential Interpretation:
The chart suggests a bearish outlook for XAUUSD, with the trader looking to short Gold at the retest of a 4-hour bearish order block. The setup has a favorable risk-reward ratio. The concepts in the inset image provide a theoretical framework for why this particular entry and targets might be chosen, based on institutional trading principles. The current price is at 3,322.285 at 08:33:38 +04, which is below the proposed entry, suggesting this might be a setup that the trader is waiting to happen or a retrospective analysis of a potential trade idea.
GOLDGOLD is about to get ready for a push up, keep an eye from the reaction zone for buy setups.
Disclosure: We are part of Trade Nation's Influencer program and receive a monthly fee for using their TradingView charts in our analysis.
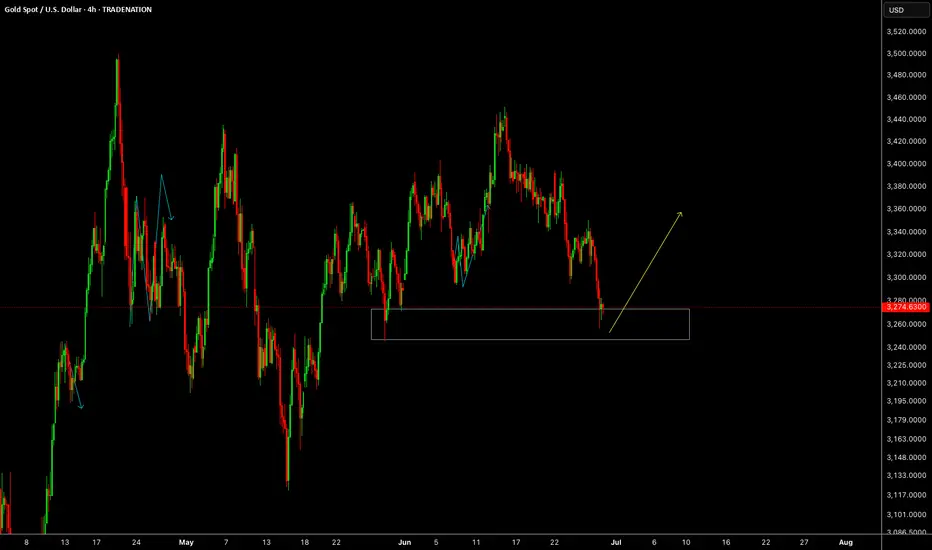
Gold Trading Strategy June 26✏️ D1 candle shows a recovery but not significantly. Gold is currently reacting at the key resistance zone of 3342.
The immediate support zone that the price is heading toward is 3326. This forms a breakout range between 3326 and 3342.
A bullish channel may form if there is a strong price reaction at 3326. Conversely, if 3326 is broken, it could confirm a continuation of the downtrend targeting 3302 during the European and US sessions today. The bearish target could even extend to 3278.
📈 Key Levels
Breakout Range: 3326 - 3342
Support: 3326 - 3314 - 3302 - 3278
Resistance: 3342 - 3363 - 3388
📊 Recommended Trade Setups
BUY: 3302–3300 | SL: 3297
SELL: 3363–3365 | SL: 3369
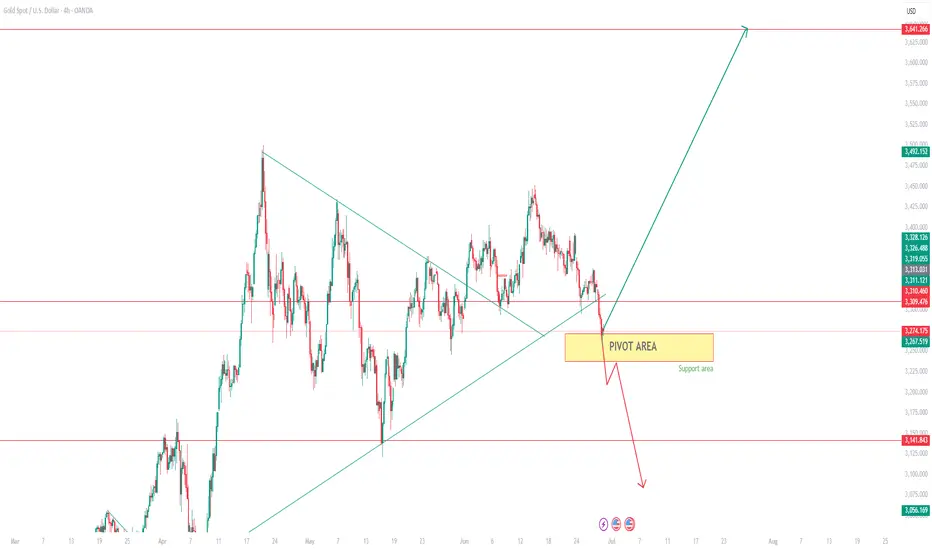
GOLD in PIVOT AREAGold is in the support area. The commodity is expected to hit the levels of 3461 in rejected from here ( 80% Chance).
However the pair can fall further if the price breaks the levels of 3200.
Exclusive operation suggestions for future market trends!!!Gold bottomed out and rebounded on Monday, so wait patiently for room for future gains. Technically, from the current hourly chart, the gold entity has always been above 3278, and it only pierced through 3275 and then began to rebound. If the retracement does not break the 618 position, there will inevitably be a high point in the future. So next, we should focus on the vicinity of 3280. If gold always closes above 3280, then the high point of 3297 on Monday is likely to be refreshed. Secondly, from the perspective of 123 seeking 4, if it goes up again, it is very likely to touch around 3310. 3310 is exactly around 618. And it is also the top position of this hourly chart range. Therefore, gold should be shorted above 3280 with caution, and the probability of touching above 3300 is very high. In terms of operation, it is recommended to directly enter the market to go long near 3280, and look at 3310-3320. If you want to short, you must wait at least for 3310-3320 before you can enter the market to short once.
Daily Outlook | XAUUSD June 30, 2025Hey traders,
Fresh week, clean structure. Let’s lock in the key levels and let price do the talking.
🌐 Macro Context
It’s a heavy week for USD – all major data drops before Friday:
Tuesday: ISM Manufacturing + Powell speaks
Wednesday: ADP Employment
Thursday: NFP, Unemployment Rate, ISM Services
Friday: US holiday – markets closed
📌 This means liquidity will build into Thursday, then fade. Expect gold to stay range-bound early in the week, unless momentum shifts hard today. Volatility should peak around NFP.
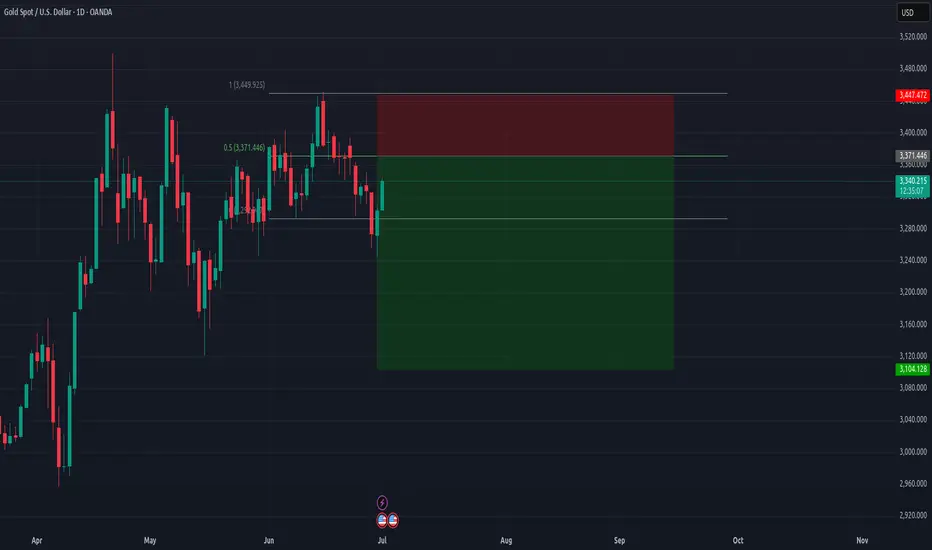
🧭 Daily Structure & Bias
Gold opened weak under 3287, still below 21EMA and 50EMA. The structure shows lower highs, bearish control, and no signs of strength reclaiming ground. RSI is at 42 — momentum down, but not oversold yet. Unless price breaks back above 3340, sellers stay in control.
✅ D1 Bias: Bearish while under 3340
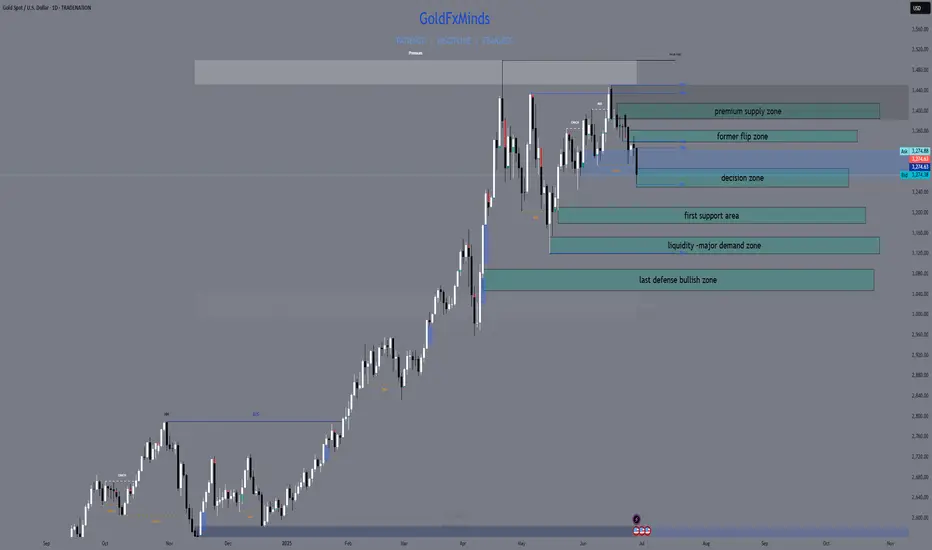
📌 Key D1 Zones to Watch
🔺 D1 Breaker Block – 3340–3355
Former support, now clean resistance. Includes 50EMA and last failed closes. If price rejects again here, bearish continuation likely. A daily close above 3355 flips short bias.
🔺 D1 Supply + FVG – 3385–3405
Unmitigated imbalance from early June. If price pushes through 3355, this is the next upside magnet. Good spot for first reaction.
⚖️ D1 Decision Zone – 3287–3265
Current price zone. Multiple past reactions. A daily close below 3265 confirms breakdown. Holding above = more choppy range.
🟢 D1 Reaction Shelf – 3210–3180
Minor support zone from April candle bodies. Can slow price, but not strong enough for reversal on its own.
🟢 D1 Demand Block – 3155–3120
First major HTF demand. Includes 200EMA, strong structure, and previous breakout base. If price sells into it fast, watch for rejection — but only with confirmation.
🟢 D1 Macro Demand – 3090–3055
Final line of macro defense. Clean imbalance + demand from February. Valid only if sentiment breaks post-NFP.
✅ Final Summary
• Below 3265 = structure breaks → opens 3180
• 3155–3120 = real support zone
• Below 3120 = macro shift risk
• Reclaiming 3340 = short bias invalid
• Break above 3385 = continuation possible
📌 Today is all about the close. No confirmation = no trade. Thursday is the real trigger — be positioned, not exposed.
—
📣 If this gave you clarity and structure, drop a 🔥, share your bias, and follow GoldFxMinds for sniper plans with zero fluff — only clean, confirmed price action.
XAUUSD Traders – The ONLY Timeframes That Matter🎓 XAUUSD Traders – The ONLY Timeframes That Matter
If you want to stop being a liquidity snack for the big players, you must know which timeframes actually reveal what the market makers are doing.
Here’s your complete educational guide for XAUUSD:
⸻
🔍 1️⃣ The 4-Hour (4H) – The Market Maker Blueprint
✅ Why Watch It?
This is where the real accumulation and distribution happens.
Market makers build and unwind positions over multiple sessions—London and New York.
If you want to see the big plan, this is your chart.
✅ What to Look For:
• Strong rejection candles near key resistance (3330–3350).
• Fake breakouts with no follow-through.
• EMA21 and SMA50 acting as dynamic resistance.
• High-volume candles marking where the big boys stepped in.
🎯 Tip: If the 4H chart is bearish, every bounce on smaller timeframes is suspect.
⸻
⏰ 2️⃣ The 1-Hour (1H) – Timing the Trap
✅ Why Watch It?
1H is perfect for seeing the moment the trap is set.
This is when price pumps into resistance or dumps below support—just enough to trigger stops.
✅ What to Look For:
• Quick rallies on low volume (pump phase).
• Reversal candles forming right after a breakout.
• Delta flipping negative as price pushes higher (hidden selling).
🎯 Tip: Combine 4H structure with 1H confirmation—this is where precision timing happens.
⸻
🎯 3️⃣ The 15-Minute (15M) – Entry Execution
✅ Why Watch It?
15M shows micro-structure and liquidity hunts.
This is where you confirm whether that big 1H candle was real—or just a head fake.
✅ What to Look For:
• Sharp wicks that stop out traders (liquidity flush).
• Tight consolidation after a failed breakout.
• Rejection patterns before price reverses.
🎯 Tip: Use the 15M to pull the trigger—not to overthink.
⸻
📅 4️⃣ The Daily – Bias Confirmation
✅ Why Watch It?
Daily sets the macro tone.
You must know whether you’re fighting the bigger wave.
✅ What to Look For:
• Where price closed relative to EMA21 and SMA50.
• Big bearish engulfing candles.
• Volatility expanding or contracting.
🎯 Tip: If daily is bearish, you have extra confirmation to fade pumps.
⸻
⚔️ How to Combine These Timeframes
Here’s the professional workflow:
1️⃣ Daily – Define bullish or bearish bias.
2️⃣ 4H – Spot the setup zone (accumulation or distribution).
3️⃣ 1H – Watch the trap unfold.
4️⃣ 15M – Execute your entry with surgical precision.
✅ This is how you stop chasing noise and start trading structure.
⸻
💡 Pro Wisdom:
“Retail traders react to price. Professionals react to price and context.”
— Technical Analysis and Stock Market Profits
⸻
🚀 Trade smart. Study structure. Outsmart the herd.
#XAUUSD #ForexEducation #PriceActionTrading #MarketMakerSecrets #LearnToTrade

XAUUSD Market Maker Playbook – Learn How the Game Is Rigged🎓 XAUUSD Market Maker Playbook – Learn How the Game Is Rigged
Traders—if you think this market is some pure, fair supply/demand mechanism, you’re getting played.
Market makers run sophisticated pump and dump cycles designed to trap you.
Today, I’m going to break down exactly how they do it, so you can start trading like a sniper, not a sheep.
🔍 Understanding the 3 Manipulation Zones
🟢 GREEN ZONE: Accumulation Range (3286–3300)
Purpose:
Market makers quietly build positions.
They create an illusion of neutrality—small candles, tight ranges.
Signs:
Repeated tests of the same level.
Volume stays steady (not exploding).
Wicks in both directions (so nobody knows who’s in control).
🟡 YELLOW ZONE: The Pump Phase (3300–3330)
Purpose:
Trigger breakout traders.
Induce FOMO buying.
Clear out short stops above the range.
Signs:
Quick impulsive candles with LOW RELATIVE VOLUME.
Price blows through resistance but struggles to hold.
Social media and news start calling “Bull Run.”
🔴 RED ZONE: Distribution & Dump (3330–3350)
Purpose:
Offload large positions into retail buying.
Leave traders trapped at the highs.
Signs:
Spikes of huge volume as price stalls.
Rejection candles (long upper wicks).
Big delta shifts negative (sellers hitting bids hard).
⚔️ How the Market Maker Sequence Works
Here’s how the trap gets set:
1️⃣ Accumulate in Green Zone
Build inventory while convincing everyone “nothing is happening.”
2️⃣ Pump into Yellow Zone
Push price up just enough to trigger momentum traders.
Keep volume deceptively low—so it looks sustainable.
3️⃣ Sell in the Red Zone
Dump big positions into the buying frenzy.
Flip the tape bearish—fast.
Watch as the herd gets stopped out or bag-held.
🎯 Tomorrow’s Possible Plays
✅ Scenario 1 – Classic Pump & Dump
Phase 1: Grind in 3286–3300.
Phase 2: Spike to 3335.
Phase 3: Dump back to 3260.
✅ Scenario 2 – Fake Breakdown Reversal
Phase 1: Slam price to 3250, triggering panic selling.
Phase 2: Accumulate aggressively.
Phase 3: Rip price back to 3320, trapping shorts.
✅ Scenario 3 – Slow Grind Liquidation
Phase 1: Drift up in low volume toward 3330.
Phase 2: Distribute over several hours.
Phase 3: Liquidate longs into NY close.
📚 How YOU Can Spot This Manipulation
Here’s your checklist—save this:
✅ Volume vs. Price Analysis
Big price moves WITHOUT proportionate volume = FAKEOUT.
Big volume at tops/bottoms = Institutional distribution or accumulation.
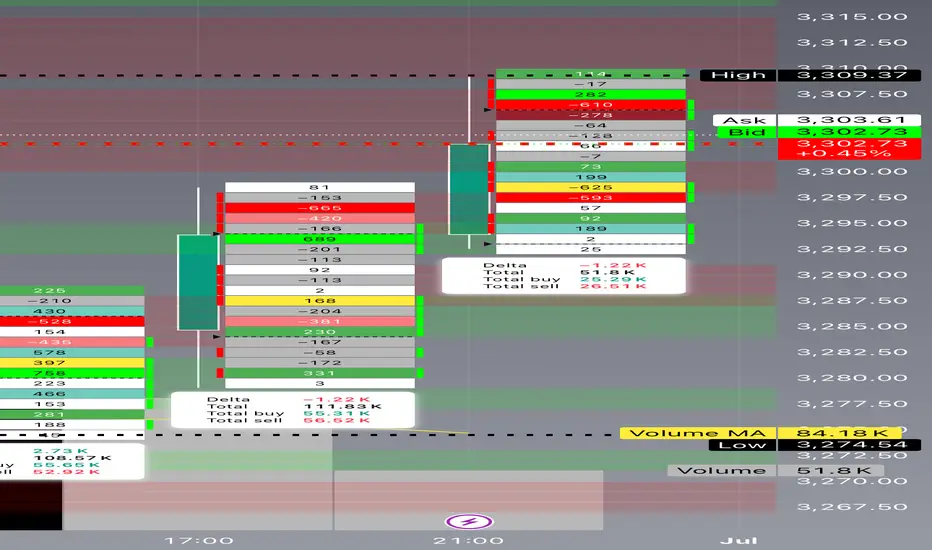
✅ Delta Confirmation
Positive delta = buyers aggressive.
Negative delta = sellers slamming bids.
Watch for divergence (price up but delta down = hidden selling).
✅ Candlestick Clues
Rejection wicks.
Engulfing candles at key zones.
Multiple failures to break past a level.
✅ Timing
London open and NY open are prime manipulation hours.
Thin liquidity in Asia can exaggerate moves.
💡 Pro Tip:
“The crowd chases price. The professionals track volume, delta, and timing.”
— Technical Analysis and Stock Market Profits
🚀 Stay sharp. Think like a market maker. Trade like a predator.
#XAUUSD #MarketMakerEducation #ForexTrading #PriceAction #LearnT
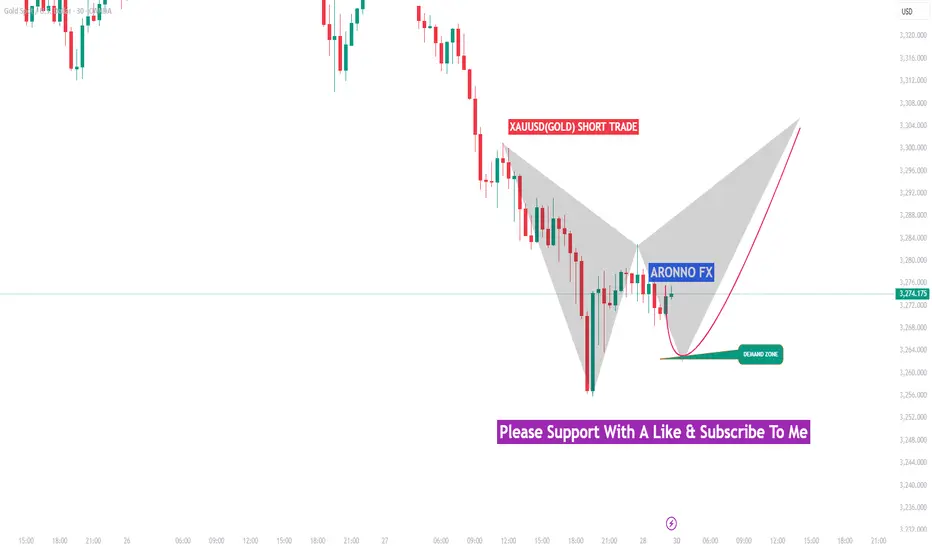
GOLD SHORT TRADEAronnoFX will not accept any liability for loss or damage as a result of
reliance on the information contained within this channel including
data, quotes, charts and buy/sell signals.
If you like this idea, do not forget to support with a like and follow.
Traders, if you like this idea or have your own opinion, please feel free command me.
Gold Extends Decline Amid Easing Safe-Haven DemandGold continues its downward trajectory as safe-haven sentiment weakens. Geopolitical tensions between Iran and Israel appear to be easing following a ceasefire agreement, reducing the perceived need for defensive assets such as gold.
At the same time, the market is reassessing its expectations regarding U.S. monetary policy. With the Federal Reserve unlikely to cut interest rates in the near term—and concerns about inflation resurfacing due to potential tax policy changes under former President Donald Trump—gold is facing a dual source of short-term pressure.
Investor sentiment is currently shifting toward riskier assets, as capital flows increasingly favor equities over gold. This risk-on environment has further eroded demand for traditional safe havens.
From a technical perspective, gold failed to break above the $3,350 level, signaling waning bullish momentum. This may indicate the onset of a short-term corrective phase.
On the political front, recent remarks by Donald Trump—including the possibility of a long-term diplomatic solution with Iran and discussions around replacing Fed Chair Jerome Powell—have introduced additional volatility into global financial markets.
Furthermore, according to market data I have reviewed, gold sales in the second quarter have shown signs of slowing. Buyers are becoming more cautious amid elevated price levels, while many investors are choosing to take profits, contributing to an increasingly two-sided market dynamic.
Despite this, I maintain a positive medium- to long-term outlook for gold. The U.S. dollar is currently at its weakest point in three and a half years, offering significant support. Notably, central banks managing over $5 trillion in assets are planning to increase their gold reserves within the next one to two years—a strong structural driver for gold’s long-term growth.
In summary, I believe gold is currently experiencing short-term corrective pressure due to a combination of geopolitical developments, interest rate expectations, and shifting investor sentiment. However, its long-term outlook remains solid, supported by a weaker dollar, global macroeconomic risks, and continued central bank accumulation.
Daily live trade with XAUUSD in 15m/30m/1h 20250630Daily live trade with XAUUSD in 15m/30m/1h 20250630
XAUUSD:Sharing of the Latest Trading StrategyAll the trading signals this week have resulted in profits!!! Check it!!!👉👉👉
Early Session Dynamics:
Gold rebounded in today’s early trading after finding support at the prior low of 3245, aligning with our weekly forecast. The intraday strategy prioritizes a low-level rebound correction, with short positions to be initiated at resistance levels.
Key Technical Levels:
Resistance: 3295–3308
Support: 3250–3240
4-Hour Chart Perspective:
The market remains weak with high volatility. The double-bottom effect at 3245 is unconfirmed, and no bottoming pattern has emerged. Thus, the week’s initial outlook is for a range-bound oscillation between 3308 and 3240:
A rebound opportunity exists as long as 3240 holds.
A break above 3308 could trigger upward momentum.
Intraday Trading Strategy:
Lacking follow-through in the European session, the short-term trend is viewed as range-bound
Sell@3305-3295
TP:3285-3250
buy@3250-3260
TP:3285-3300
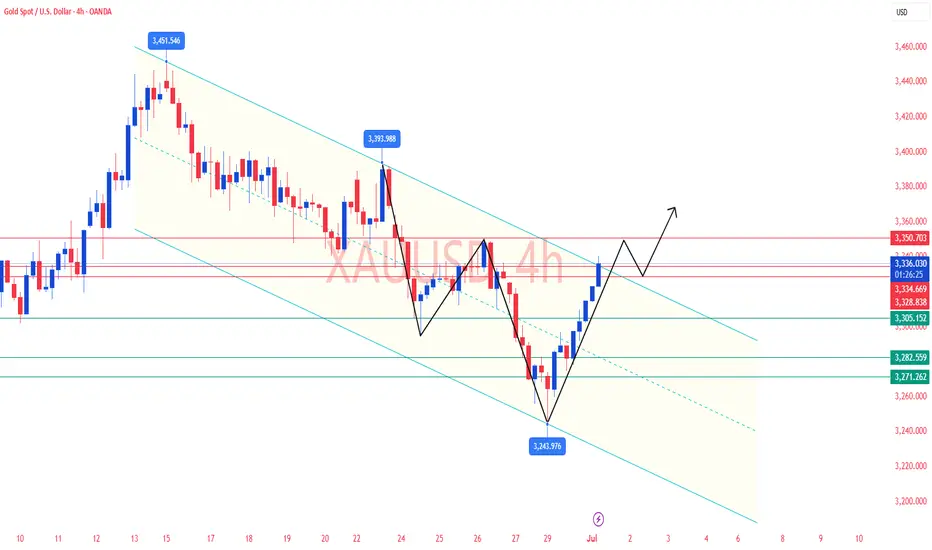
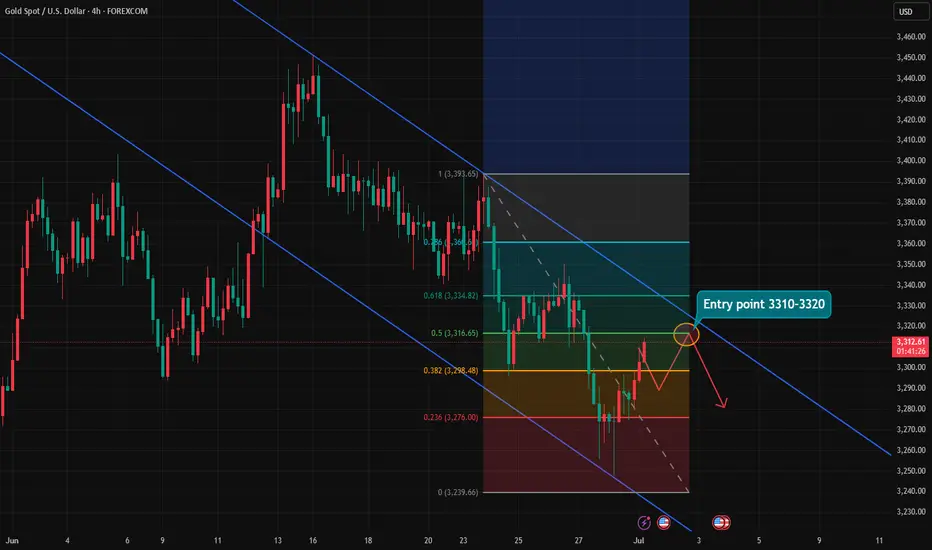
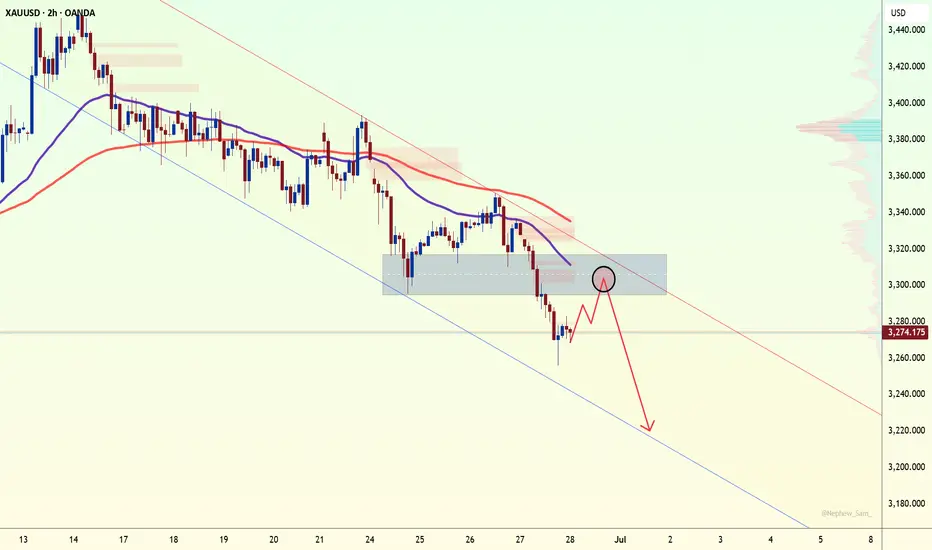
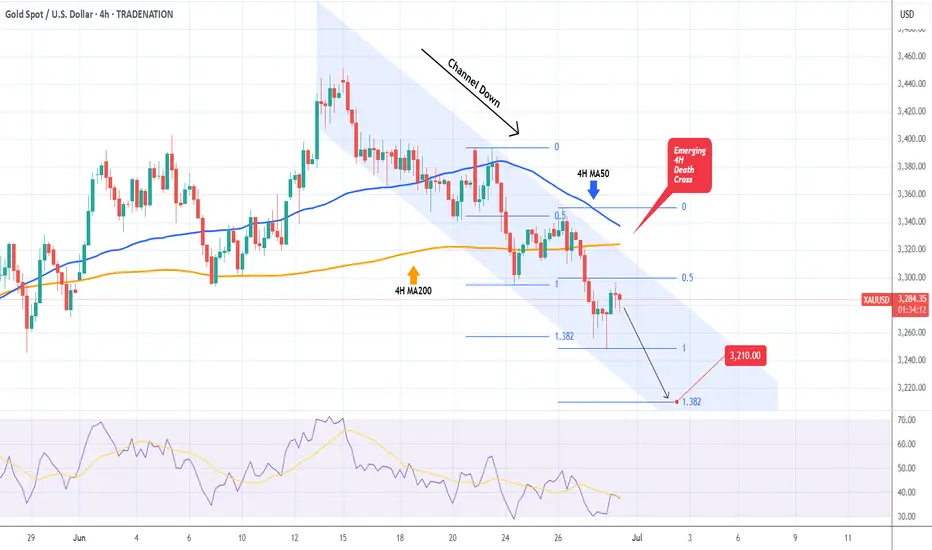
XAUUSD Channel Down starting new Bearish Leg.Gold (XAUUSD) has been trading within a 2-week Channel Down, recently rejected on its 4H MA50 (blue trend-line). The last Lower High was priced on the 0.5 Fibonacci retracement level, so currently we are on the ideal level for a new short.
With a 4H Death Cross emerging, we are targeting the 1.382 Fibonacci extension (as the previous Bearish Leg did) at 3210 for the Channel's new Lower Low.
-------------------------------------------------------------------------------
** Please LIKE 👍, FOLLOW ✅, SHARE 🙌 and COMMENT ✍ if you enjoy this idea! Also share your ideas and charts in the comments section below! This is best way to keep it relevant, support us, keep the content here free and allow the idea to reach as many people as possible. **
-------------------------------------------------------------------------------
Disclosure: I am part of Trade Nation's Influencer program and receive a monthly fee for using their TradingView charts in my analysis.
💸💸💸💸💸💸
👇 👇 👇 👇 👇 👇
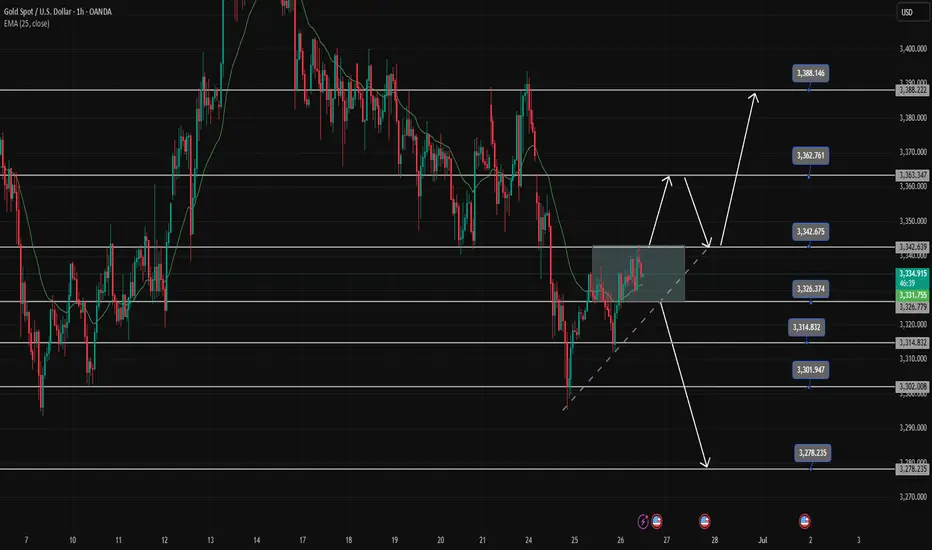
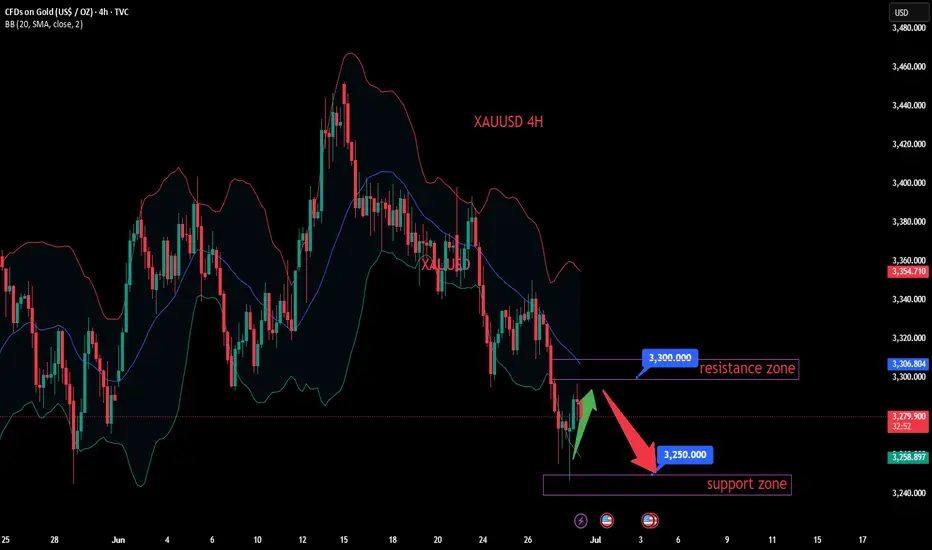
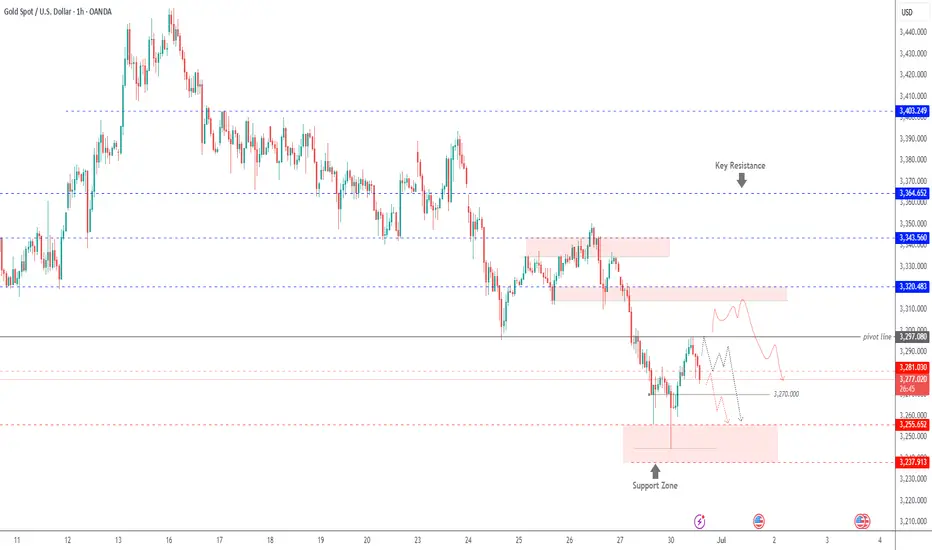
GOLD | Pressure Below Pivot – Eyes on 3255 and 3238GOLD | Market Outlook
The overall momentum remains bearish as long as the price trades below the pivot line at 3297.
Currently, the price is attempting to stabilize below 3281, suggesting a potential continuation of the downtrend toward 3270 and 3255.
A confirmed 1H close below 3255 would further strengthen the bearish scenario, opening the way toward 3238.
Sell Setup:
Valid if 1H candle closes below 3281→ Targets: 3270 and 3255
Buy Setup:
Valid if 1H candle closes above 3297→ Targets: 3314
Key Levels:
• Pivot: 3281
• Support: 3255 / 3238
• Resistance: 3297 / 3314
GOLD Will Grow! Buy!
Here is our detailed technical review for GOLD.
Time Frame: 1D
Current Trend: Bullish
Sentiment: Oversold (based on 7-period RSI)
Forecast: Bullish
The market is approaching a significant support area 3,281.18.
The underlined horizontal cluster clearly indicates a highly probable bullish movement with target 3,396.94 level.
P.S
The term oversold refers to a condition where an asset has traded lower in price and has the potential for a price bounce.
Overbought refers to market scenarios where the instrument is traded considerably higher than its fair value. Overvaluation is caused by market sentiments when there is positive news.
Disclosure: I am part of Trade Nation's Influencer program and receive a monthly fee for using their TradingView charts in my analysis.
Like and subscribe and comment my ideas if you enjoy them!

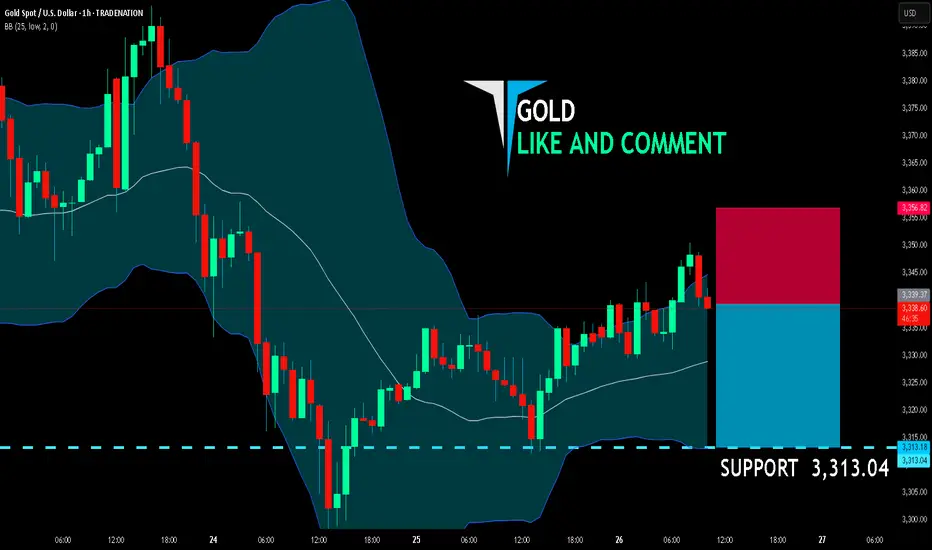
GOLD SELLERS WILL DOMINATE THE MARKET|SHORT
GOLD SIGNAL
Trade Direction: short
Entry Level: 3,339.37
Target Level: 3,313.04
Stop Loss: 3,356.82
RISK PROFILE
Risk level: medium
Suggested risk: 1%
Timeframe: 1h
Disclosure: I am part of Trade Nation's Influencer program and receive a monthly fee for using their TradingView charts in my analysis.
✅LIKE AND COMMENT MY IDEAS✅
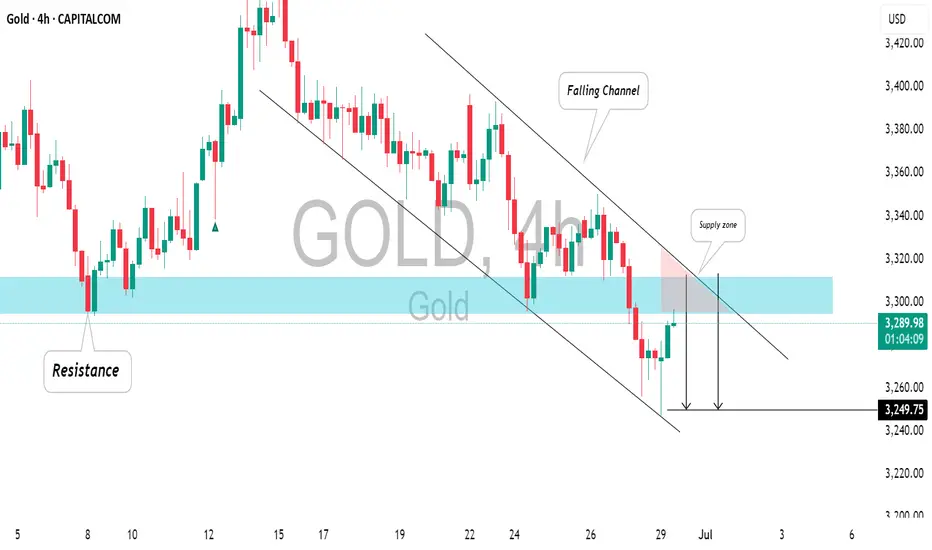
GOLD(XAUUSD): Bearish Trend Will Resume SoonGOLD appears to be bearish on an intraday chart following the violation of a key support zone.
The broken structure and descending channel resistance line now indicate a tightening supply area.
A significant bearish movement is likely to follow. The next support level is at 3249.
Gold rebounded from oversold!Gold fell continuously on Friday, and the daily line closed in a cross. Although the previous closing was a small positive, the rebound was discontinuous and there was no strong upward movement, which means that the overall reversal has not ended and there is still room for downward adjustment. It continued to fall to the 3255 line and rebounded slightly, and then approached the 3280 mark. The support below is dense, and there is no condition for aggressive shorting. If you want to short, you still have to rebound and then short.
This week, the two key positions above 3295 and 3310 were suppressed. The monthly closing is likely to be a new low. Be cautious.

Gold continues to be weak, but be careful about operations
📣Gold prices fell 2% last Friday, hitting a near one-month low. Optimistic trade-related agreements boosted risk appetite and weakened the attractiveness of gold as a safe-haven asset. This week, the market will usher in a group meeting of major central bank governors around the world (Fed Chairman Powell, European Central Bank President Lagarde, Bank of England Governor Bailey, Bank of Japan Governor Kazuo Ueda, and Bank of Korea Governor Lee Chang-yong). The market will also usher in non-agricultural data. In addition, Powell's remarks on whether to resign may ignite the market this week. Gold prices may fluctuate more around the lower track of the Bollinger Band at $3,270/ounce this week.
Technical analysis:
Last Friday, the K-line had a lower shadow, and the Bollinger Band did not diverge. It is not easy to go short directly in operation, but wait for the rebound to confirm 3295 and the key resistance of ma5 to be short.
💰 Operation strategy: Rebound to 3280-3283 to go short, target 3270-3265, stop loss 3288-3290