XAUUSD trade ideas
GOLD BULLS STILL HAVE LAST PUSHBULLS 15M still have power still we have 3414 area need to be tested before we get good correction (BEAR IN MIND GOLD LONG TERM IS BULL)
We will only get this correction if 3414 area holds
Most likely will hold cos i can see 2985 area before we creating new highs for GOLD (2985 AREA WILL BE GOOD PLACE TO BUY AND HOLD)
Any way ONLY TIME WILL TELL
GOOD LUCK

Gold trading rhythm is perfectly matchedIn the previous strategy, we recommended maintaining a high-selling and buying-low strategy for gold. We accurately predicted the high point near 3397 and arranged short positions near 3395. It then fell steadily to around 3371. Judging from the current gold trend, gold rose and then fell in the European session, touching around 3397, which is exactly the pressure level of the upward channel trend line. The Bollinger Bands in the 4H cycle closed, and the indicators temporarily showed signs of differentiation, but the overall market was resistant to declines at high levels. The current short-term support is around 3375-3370. If it does not break the short-term, it will still be volatile. If it falls below, the strong support of 3360 will be seen. The upper pressure levels are 3385, 3398-3400. In terms of operation, we still maintain a high-altitude, low-multiple short-term strategy. I will give the specific operation ideas at the bottom, remember to pay attention in time!
XAUUSD Short Re EntryElite Analysis
BE on previous entry
Targeting lower liquidity pools. Still vigilant to liquidity that will be coming up.
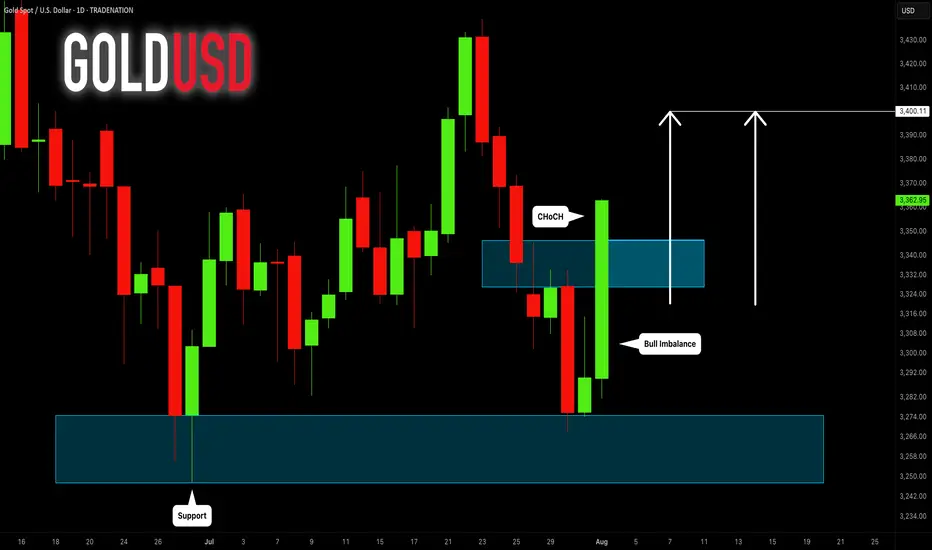
GOLD (XAUUSD): Move Up Ahead?!
Friday's fundamentals made Gold very bullish during the New York session.
The price formed a high momentum bullish candle on a daily,
breaking a minor daily resistance area.
It gives us a confirmed Change of Character CHoCH and indicates
a highly probable bullish continuation next week.
I think that the price will reach 3400 level.
❤️Please, support my work with like, thank you!❤️
I am part of Trade Nation's Influencer program and receive a monthly fee for using their TradingView charts in my analysis.
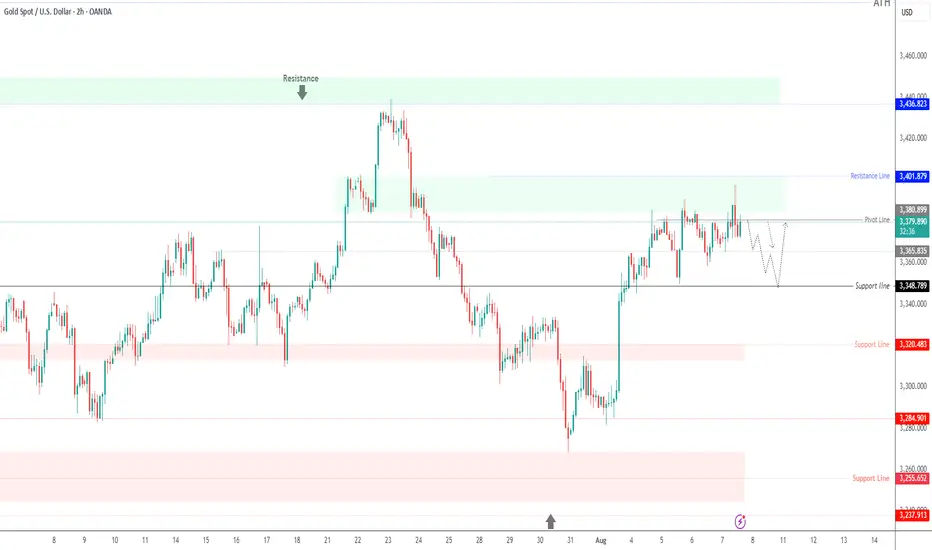
Gold Reverses After Hitting Resistance–Bearish Correction Ahead?GOLD – Market Overview
Gold reached our resistance target perfectly, rallying nearly $50 from 3349 to 3400, as previously projected.
Now, price has reversed from the resistance zone and is stabilizing below 3380, which supports a potential bearish correction toward 3365.
A break below 3365 would likely extend the move down to 3349.
For bullish momentum to resume toward 3402, we need a clean break above 3385.
Pivot Line: 3380
Support: 3365 – 3349
Resistance: 3391 – 3402
previous idea:
Report - 8 August, 2025EVENT OVERVIEW & MARKET REACTIONS
President Trump’s decision to double existing tariffs on Indian imports—from 25% to a total of 50%—has escalated geopolitical tensions, especially as the justification centers on India’s continued purchase of Russian oil. This marks a significant deterioration in U.S.-India relations, which had been relatively stable despite differences in trade and defense procurement. New Delhi responded sharply, denouncing the tariffs as “unfair” and “unreasonable.” Market reaction in India was immediate, with the Nifty 50 falling 1.2% intraday and the rupee weakening slightly against the dollar, reflecting investor nervousness over geopolitical risk.
In the U.S., equity markets shrugged off the geopolitical risk, buoyed by strong corporate earnings and major announcements like Apple’s $100bn domestic investment to relocate manufacturing and circumvent tariffs. The S&P 500 and Nasdaq gained 0.7% and 1% respectively. Apple shares rose 5.8% after the White House praised its reshoring strategy, helping mask broader anxieties. The dollar index (DXY) fell 0.4% as markets increased bets on imminent Fed rate cuts. U.S. 10-year Treasury yields rose 4bps to 4.23%, suggesting some reallocation from bonds into equities despite Fed dovish expectations.
Oil markets remained volatile but ultimately firmed slightly, as traders weighed OPEC+'s impending production increases against longer-term structural demand from India and China. Crude oil held near $78/barrel, while gold remained elevated at $2,072/oz, underscoring lingering investor caution amid geopolitical and monetary uncertainty.
STRATEGIC FORECASTS
The doubling of tariffs on India is not just a bilateral issue—it is a strategic signal. Trump is making it clear that U.S. allies who defy his energy sanctions regime will be punished economically, regardless of shared democratic values. This recalibration raises risks of fragmentation among the so-called "Indo-Pacific Quad" and undermines the credibility of U.S.-India defense cooperation, which had recently expanded under frameworks like iCET (Initiative on Critical and Emerging Technology).
In the near term, India will likely seek to diversify its export markets while doubling down on domestic resilience policies. However, the Modi administration will also be under pressure from global investors—particularly those supporting the "China+1" strategy—to maintain open channels with Washington. The Apple announcement only intensifies pressure on India, as it highlights the cost of geopolitical non-alignment.
Elsewhere, geopolitical instability continues to compound: Berkshire Hathaway shares are underperforming as Warren Buffett exits; UK-China relations are fraying over embassy construction; and Switzerland continues to reel from a 39% tariff shock. These converging flashpoints are indicative of a more transactional, power-politics-driven global order in which traditional alliances no longer guarantee trade security.
FISCAL AND POLITICAL IMPLICATIONS
Trump’s tariff war is no longer just about economic protectionism—it is now a tool of direct foreign policy coercion. The targeting of India, despite its status as the fifth-largest economy and a major U.S. trade partner, shows a willingness to weaponize the U.S. consumer market against strategic allies. For India, this is politically damaging. The Modi government had made substantial diplomatic overtures to Washington and is now politically cornered between maintaining sovereignty in energy policy and sustaining access to its largest export market.
For the U.S., there are short-term political gains. Trump’s base is likely to support these aggressive moves as evidence of “economic patriotism,” and domestic reshoring by companies like Apple lends weight to his industrial revival narrative. However, the long-term cost could be a more fractured, de-dollarized trading world, with allies exploring new coalitions that reduce exposure to U.S. leverage.
RISKS
Geopolitical Fracture: The breakdown in U.S.-India ties could ripple through other Indo-Pacific partnerships, weakening containment strategies against China.
Investor Sentiment in India: With India now seen as a target rather than a partner, capital inflows could slow, especially in high-growth sectors like electronics manufacturing.
Commodities Volatility: Continued weaponization of oil trade—whether through tariffs or sanctions—keeps crude markets vulnerable to shocks.
Policy Overreach: Trump’s escalating use of trade tools risks overplaying U.S. leverage, potentially provoking multilateral backlash or retaliatory coalitions.
OPPORTUNITIES
U.S. Tech Reindustrialization: Apple’s $100bn commitment shows companies can turn geopolitical headwinds into domestic capex tailwinds—bolstering U.S. factory growth.
Gold as Safe Haven: With the Fed likely to ease and global risks rising, gold is well-positioned to continue attracting risk-averse capital.
Currency Arbitrage: USD weakness opens the door for tactical positioning in high-yield currencies like INR and BRL—if investors can hedge policy volatility.
Reshoring Supply Chains: The shift of production from India, China, and Southeast Asia to U.S. and Mexico-based facilities presents a logistics and construction boom in North America.
ASSET IMPACT OUTLOOK
XAUUSD (Gold)
Safe-haven demand is strong amid worsening U.S.-India relations and fears of sanctions spillovers. Real yields are falling; Fed dovishness supports further upside.
S&P 500
Strong corporate earnings and reshoring announcements are temporarily offsetting macro fears. But any further escalation in tariffs could pressure margins and global exposure.
USDJPY
As the dollar softens on dovish Fed bets and rising geopolitical risk, JPY gains as a safe-haven. Yen could strengthen further if bond volatility stabilizes.
DXY (US Dollar Index)
Despite strong U.S. equities, softer data and rising expectations for rate cuts are pushing the dollar lower. DXY could test 101 in coming weeks.
Crude Oil (Brent/WTI)
Volatile. OPEC+ supply increases are counterbalanced by continued demand from India and fears of sanctions. Oil likely range-bound $75–$82 near term.
Dow Jones
Blue-chip industrials may benefit from reshoring and stimulus bets, though tariff risks remain. Broad market support from positive earnings surprises.
INR (Indian Rupee)
Facing downside pressure from geopolitical risk premium, outflows, and weaker confidence in export stability. May weaken toward 84.5 per USD short term.

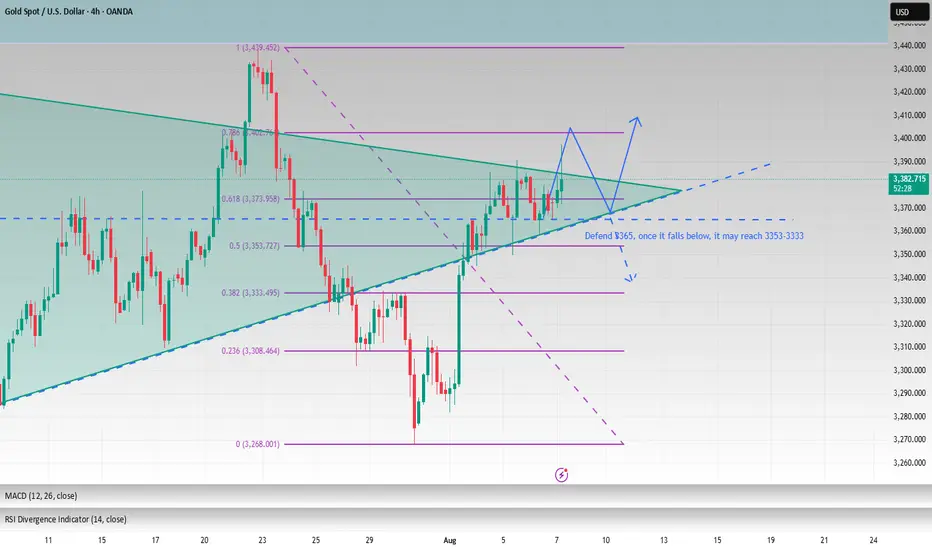
Gold range fluctuates, continue to be bullish after falling back
Yesterday, gold prices initially declined before rising, continuing the previous day's deep V-shaped rebound pattern. Prices came under pressure at 3378 in the Asian and European sessions, weakening and fluctuating downward. The European session continued its downward trend, breaking through 3360 to reach around 3358 before stabilizing and recovering. In the US session, bullish momentum continued to rebound, breaking through 3380 before falling back under pressure and weakening. The price finally closed around 3367, closing in a mid-yin-yang pattern of volatile adjustment. Overall, gold prices retreated again to test support near 3360, effectively establishing a wide range of bullish and bearish fluctuations in the short term. Further gains are expected today, challenging above 3390. However, given the recent volatile pattern of gold prices, it's not advisable to chase gains or sell losses in the short term. If your current trading is not ideal, I hope Yulia can help you avoid investment pitfalls. We welcome your communication.
According to the 4-hour chart, support is currently focused around 3365-60, while resistance is expected around 3395-3400. We should maintain a high-short-low-buy cycle within this range. In the intermediate range, we should be cautious in following orders and patiently wait for key entry points. I will provide detailed trading strategies during the trading session, so please stay tuned.
Gold Trading Strategy:
Go long on gold if it retraces to the 3360-65 level, with a stop loss at 3353 and a target of 3390-3395. Continue holding if it breaks below this level.
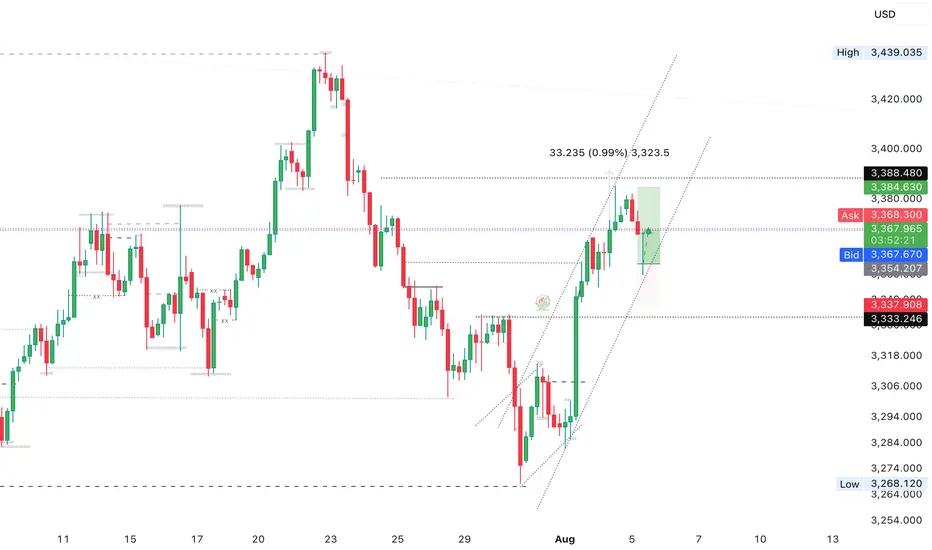
Gold Consolidates at the Top, Bearish Reversal Ahead?On the 15-minute chart, XAUUSD is showing signs of exhaustion after a strong bullish impulse. Price is currently consolidating around the 3,370–3,375 resistance area, failing to make a clean breakout. Volume is fading, suggesting buyer momentum is weakening.
Technical Breakdown:
1. Market Structure:
Since late July, the market has formed a clear uptrend with higher highs and higher lows.
However, recent price action is showing indecision at the top, with multiple rejection wicks – indicating a potential short-term distribution phase.
2. Price Action & Supply-Demand Zones:
Demand Zone 1: Around 3,310–3,320 acted as the launchpad for the strong bullish breakout on August 2.
Demand Zone 2: Around 3,345–3,350 provided support for the next leg up.
Current Supply Zone: Between 3,375–3,380 – multiple rejections have been observed here.
3. Indicators Overview:
EMA20 & EMA50 (not shown but inferred): Upward sloping, but starting to flatten – signaling potential consolidation or bearish divergence.
RSI (likely above 70 earlier): Now showing signs of bearish divergence, supporting a possible short-term correction.
4. Fibonacci Retracement Analysis:
From the recent bullish swing (3,310 → 3,375), key retracement levels are:
0.382 → ~3,350
0.5 → ~3,342
0.618 → ~3,334
This confluence around the 3,334–3,342 range makes it a critical zone for a potential bullish bounce.
Suggested Trading Strategies
Scenario 1 – Scalping the Rejection (Counter-trend short):
Entry: SELL limit at 3,375–3,380
Stop Loss: 3,386
Take Profits:
TP1: 3,350 (Fibonacci 0.382)
TP2: 3,335 (Fibonacci 0.618 + previous support)
Scenario 2 – Trend Confirmation (Breakdown Play):
Setup: Sell if price breaks below 3,350 with volume confirmation.
Target Zones:
Initial target: 3,310 (prior demand zone)
Extended target: 3,280–3,265 (possible Wyckoff distribution breakdown)
Key Levels to Watch:
Significance: 3,380 - Resistance - Short-term supply zone
3,350: Support - Key Fibonacci 0.382 level
3,334: Support - Strong confluence zone (Fibo + demand)
3,310: Support - Bullish breakout base
Conclusion:
Gold is currently in a vulnerable position with signs of bullish exhaustion. Traders should stay patient and wait for confirmation before entering. Watch the 3,350–3,334 zone for reaction – it will likely decide the next directional move.
If you found this analysis helpful, make sure to follow for more updated strategies and save this post for future reference.

Gold (XAU/USD) Technical Analysis:Gold is currently consolidating after a temporary bullish move and is testing a key support zone near $3,370.
🔻 Bearish Scenario:
If the price breaks below $3,370 and holds, this could lead to further downside towards $3,358, followed by a potential retest of the major support area at $3,310.
🔺 Bullish Scenario:
If the price bounces and breaks above the $3,385 resistance with strong momentum, we may see a continuation toward $3,397, and possibly $3,410.
⚠️ Disclaimer:
This analysis is not financial advice. It is recommended to monitor the markets and carefully analyze the data before making any investment decisions.
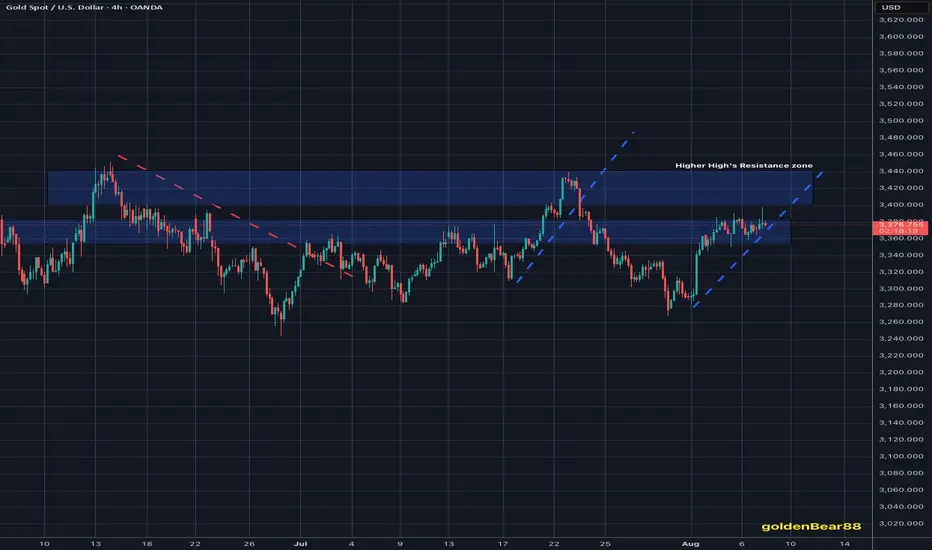
Gold extending Buying sequenceAs discussed throughout my Tuesday's session commentary: "My position: I will keep Buying every dip on Gold from my key entry points / #3,357.80 is one of them expecting final push above the Resistance zone towards #3,400.80 benchmark."
If you have been Buying every dip as per my suggestion you would be in excellent Profits now. I have been Buying Gold from my #3,357.80, #3,367.80, #3,372.80 and #3,378.80 key entry points (last batch of Buying orders closed with Target late U.S. - early Asian session last night).
Technical analysis: Gold is under unprecedented Volatility (however with Bullish underlying trend) with Gold (Xau-Usd Spot) and the Futures price on a tight spread. This is of course the product of heavy speculation in the Metals market, fuelled by the expectation that the Fed’s new talks will be accepted. Needless to mention, this environment is Gold friendly. Technically I do see current aggressive decline in form of a correction as not sustainable however I cannot approach current configuration Technically since these are Fundamentally driven sessions but I do expect a slight pullback back towards #3,352.80 - #3,357.80 only for Gold to soar even more, as the main Support and Higher High’s High’s / Low’s cluster is nearby (#3,357.80 - #3,367.80). Despite Bond Yields stabilization, the continuous Low’s on DX on parabolic decline are adding Buying pressure on Gold and limiting all Selling advance which I am utilizing to it's maximum with my set of Buying orders.
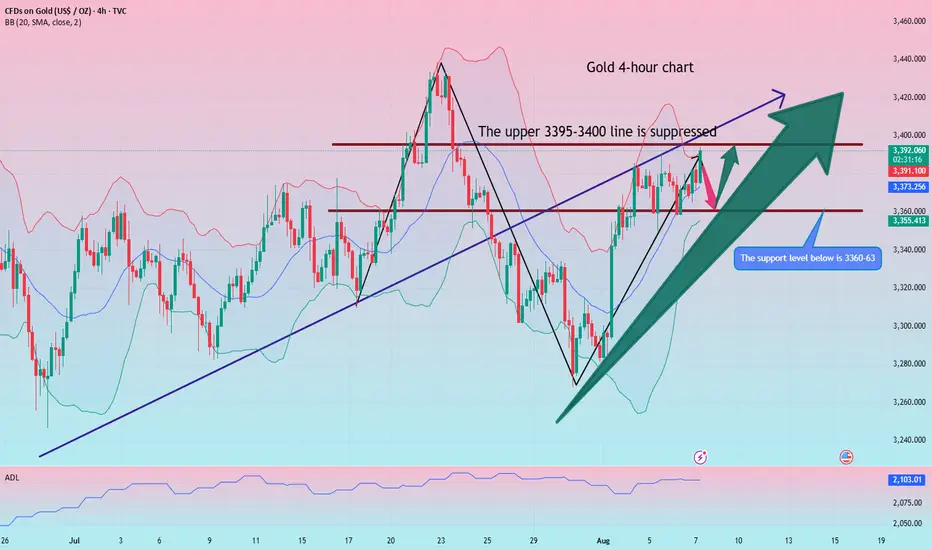
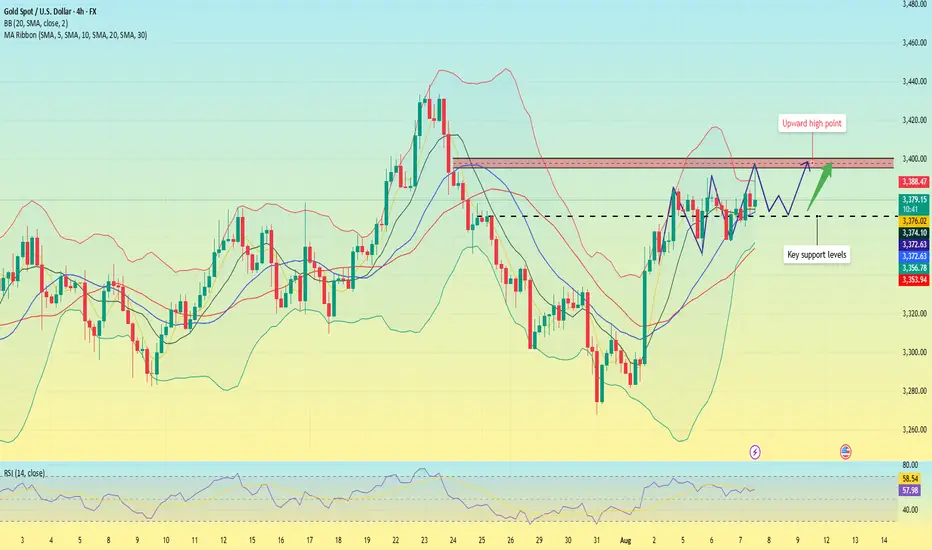
Gold is under pressure. Can the upward trend continue?On Thursday, gold rose rapidly in the European session, reaching around 3397, but failed to successfully break through the 3400 integer mark; it currently fell back slightly and fluctuated around 3375. Judging from the 4-hour chart, the price is currently running close to the middle track of the Bollinger band; since the market opened this week, the gold price has continued to run above the middle track of the Bollinger band. Despite the slight decline, it has remained within the upward trend channel and has continuously set new highs.
The current upward pressure position remains at 3390-3400, and the key support level is around 3370, which is also the crossover position of the current MA5, 10, and 20 moving averages. The RSI indicator remains above its midline, indicating that bullish momentum remains.
Quaid believes that as long as the price remains above 3370 in the US session, any pullback will be a sign of accumulating upward momentum. Gold still has the trend of hitting the 3400 integer mark.
Trading strategy:
Go long near 3370, stop loss at 3360, profit range 3380-3390-3400.
Short near 3400, stop loss at 3410, profit range 3375-3365-3355.
XAUUSD: Market Analysis and Strategy for August 7Gold Technical Analysis:
Daily Chart Resistance: 3430, Support: 3335
4-Hour Chart Resistance: 3400, Support: 3358
1-Hour Chart Resistance: 3400, Support: 3368.
Yesterday's pattern for gold was similar to the day before. Following a volatile decline in the Asian session, the New York market bottomed out and rebounded at support levels. The market is still maintaining a volatile upward trend, with rising lows, a step-by-step rise. Short-term adjustments won't affect the overall market trend. Today's strategy is undoubtedly to follow the trend and buy low!
Currently, the hourly chart lows are rising, from 3345 to 3350, and then to 3358. Today's Asian session low is 3365. Therefore, until 3365 is broken, there is a buying opportunity on the dip. Consider yesterday's low of 3358 as a defensive buying position for a bullish outlook.
BUY: 3390near
BUY: 3368near
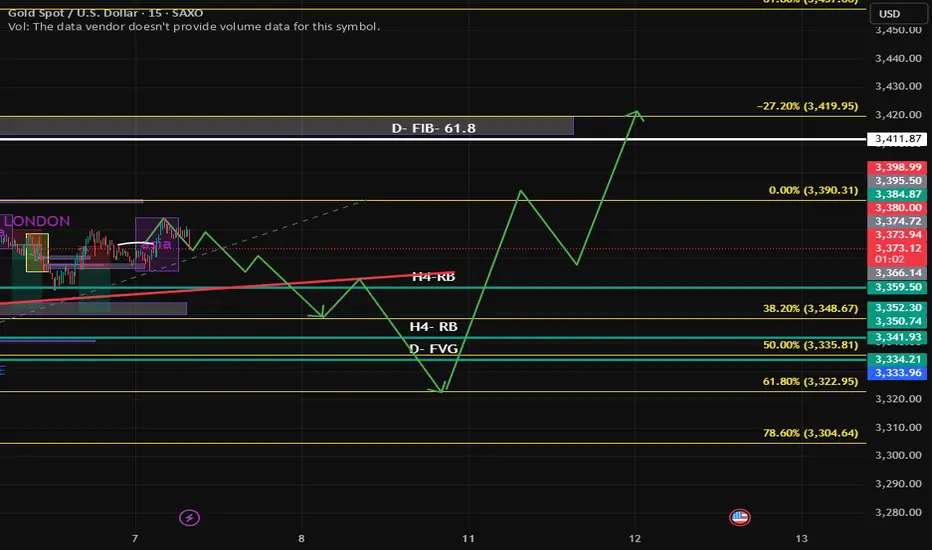
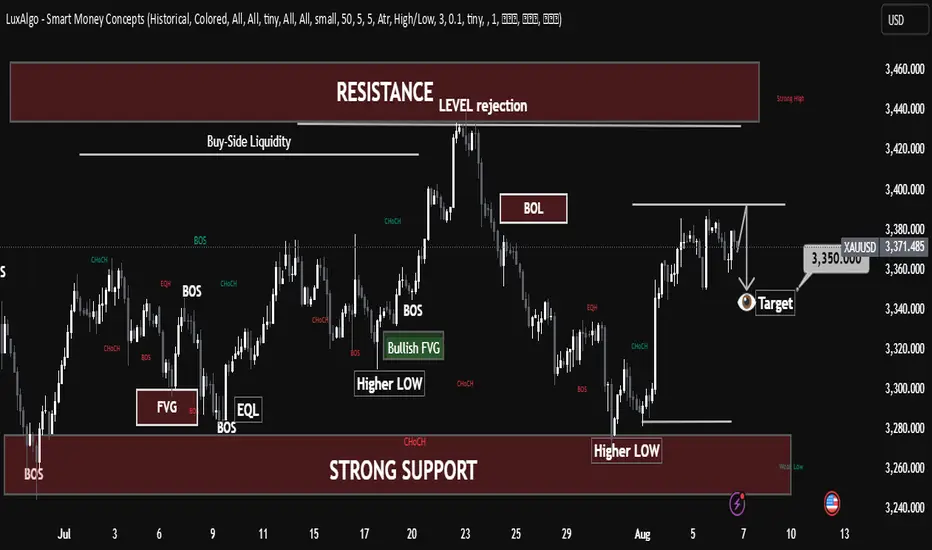
XAUUSD Chart Analysis – Smart Money Concepts (SMC) Based🔍 XAUUSD Chart Analysis – Smart Money Concepts (SMC) Based
1. Market Structure Overview:
The chart clearly shows a bullish market structure forming after a sequence of Breaks of Structure (BOS) and Change of Character (CHoCH) events.
The market has consistently made Higher Lows, indicating strength from the bulls and institutional order flow to the upside.
2. Key Zones Identified:
✅ Strong Support Zone (Demand Area):
Around $3,260–$3,280, this level has been respected multiple times.
It is marked with BOS, CHoCH, and a Bullish Fair Value Gap (FVG) indicating institutional accumulation and unfilled orders.
The area also contains a Weak Low, which gives price a reason to stay above if bullish sentiment continues.
❌ Strong Resistance Zone (Supply Area):
Around $3,420–$3,460, this area shows signs of Level Rejection and is labeled with Buy-Side Liquidity.
This is where price previously reversed after grabbing liquidity—indicating distribution and possible shorting interest from smart money.
3. Liquidity Zones:
Buy-Side Liquidity: Above recent swing highs near $3,420–$3,440. Price tapped this level and sharply rejected.
Sell-Side Liquidity (Target Area): Currently aiming for the zone around $3,350, which aligns with a recent imbalance (FVG) and a clean liquidity pool below short-term higher lows.
4. Fair Value Gaps (FVGs):
A Bullish FVG is seen mid-chart, where price was rapidly driven up, leaving a gap—price later returned to this zone, respected it, and pushed higher again.
This is a strong sign of institutional entry and provides excellent long entries.
5. Trend Confirmation:
BOS + CHoCH + Higher Lows = Bullish Bias.
Each low is forming higher than the previous, with strong rejections from demand zones.
6. Entry & Target Insight:
Entry Point: After price reacted from support and printed another Higher Low.
Target: Currently price is targeting $3,350 (short-term retracement or pullback target).
This target is likely an internal liquidity sweep before potential continuation to retest the resistance zone again.
7. Educational Takeaways:
Market Structure is King: Observe BOS/CHoCH for directional bias.
Liquidity Matters: Understand where liquidity is resting—price seeks it.
FVG as Entry Tool: Fair Value Gaps provide high-probability trade setups when aligned with structure.
Patience at Key Zones: Wait for confirmations at resistance/support rather than impulsive trades.
✅ Summary:
Bias: Bullish, until structure breaks.
Short-Term Target: $3,350 (as per the chart).
Long-Term View: If price maintains higher lows, potential revisit to the resistance zone ($3,420–$3,460) is likely.
Invalidation Level: Break and close below strong support ($3,260) would shift bias.
The bullish trend remains unchanged, seize the opportunityAfter today's opening, gold continued the bullish trend of yesterday. Judging from the daily line, gold has continued to rise, and it may only be a matter of time before it reaches a higher level. Judging from the 4H chart, the technical indicators are dead cross and shrinking, and the flexible indicators are repairing upward. The short-term middle track support is around 3372, and the upper side pays attention to the short-term pressure of 3395-3405. If the European session fails to effectively break through the short-term resistance, it will give the opportunity to test the 3380-3370 support again. If it is not broken, you can consider continuing to go long.
OANDA:XAUUSD
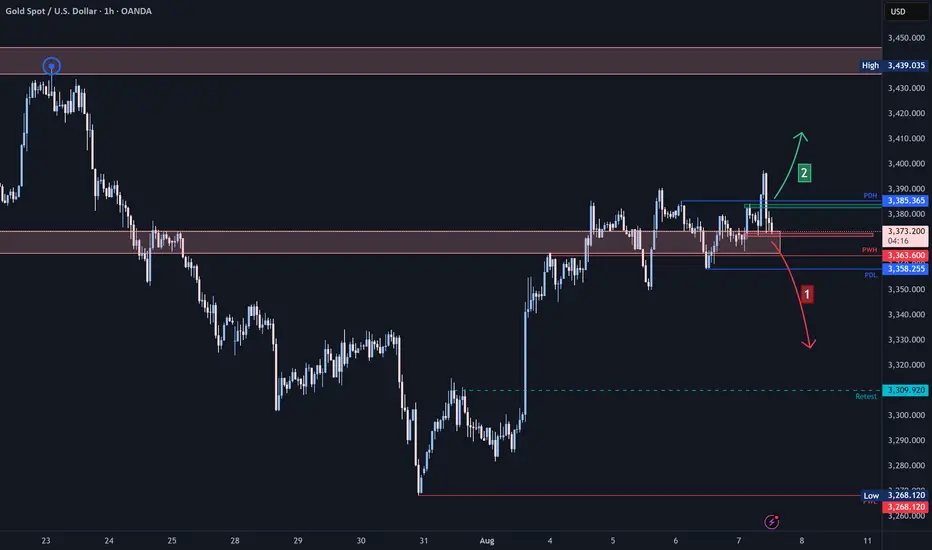
XAUUSD (SHORT)
Price broker the trendline and had to come back to retest it to confirm breakout. We expecting bears to come in for fither sells.
NB:DXY correlating with GOLD direction as extra confirmation,
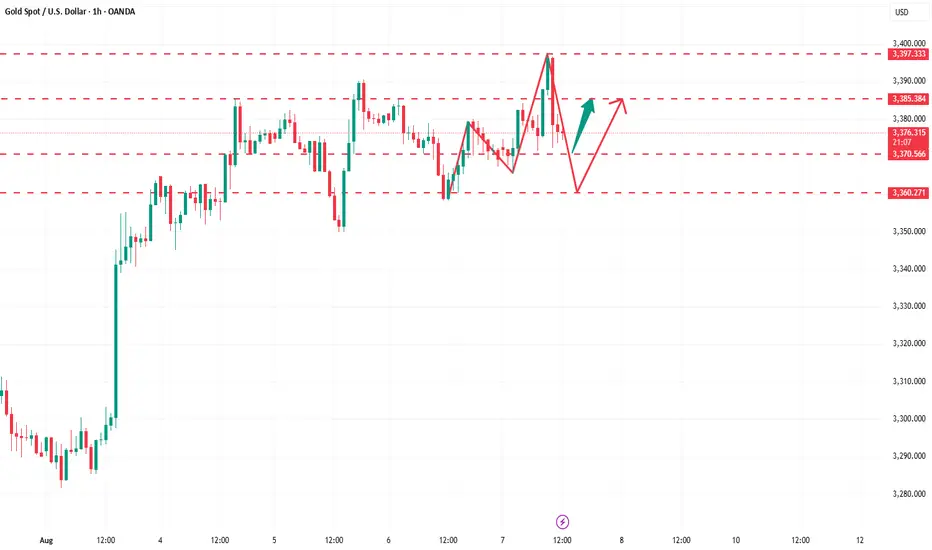
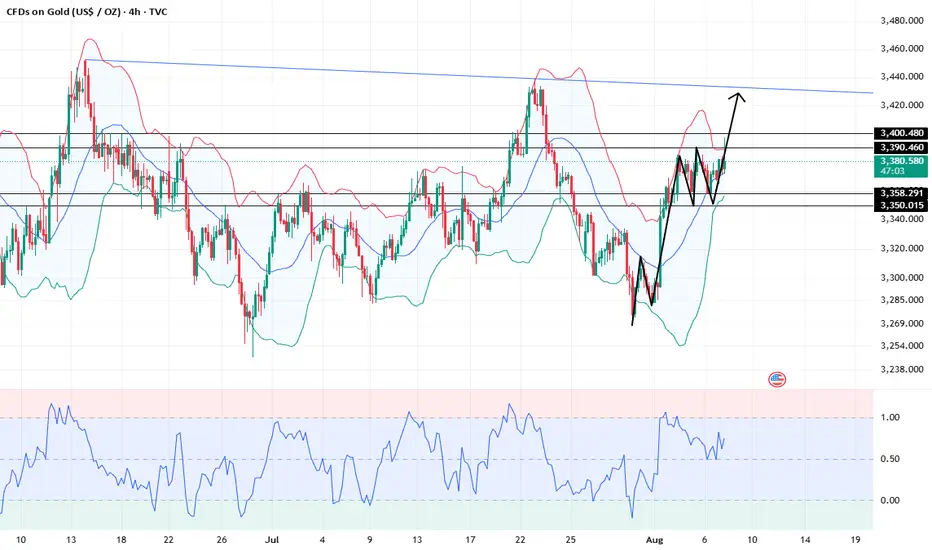
Bullish Momentum Builds: Gold Set to Challenge 3400 and BeyondAlthough gold encountered resistance again near 3385 in the short term, the retracement has not been effectively continued so far, and the downward momentum is not particularly strong. Gold has always remained above the 3375-3365 area, with strong buying support below and the market bearish sentiment is not serious. In comparison, the bulls still have a considerable advantage!
The current gold price structure clearly maintains a strong bullish trend. With gold reclaiming the 3375-3365 area yesterday, bullish sentiment has further strengthened. As gold's center of gravity shifts upward, multiple strong support areas have formed below, limiting any potential pullbacks and further supporting its upward trajectory. Therefore, as long as gold can maintain above the 3375-3365 area, I believe that gold will definitely refresh the short-term high of 3390 again, and is expected to launch a strong impact on the 3400 mark, and may even continue to the 3420-3430 area.
So for short-term trading, I don’t have much desire to short gold for the time being. I am happy to watch for opportunities to enter long positions after gold retreats to the 3375-3365 area!

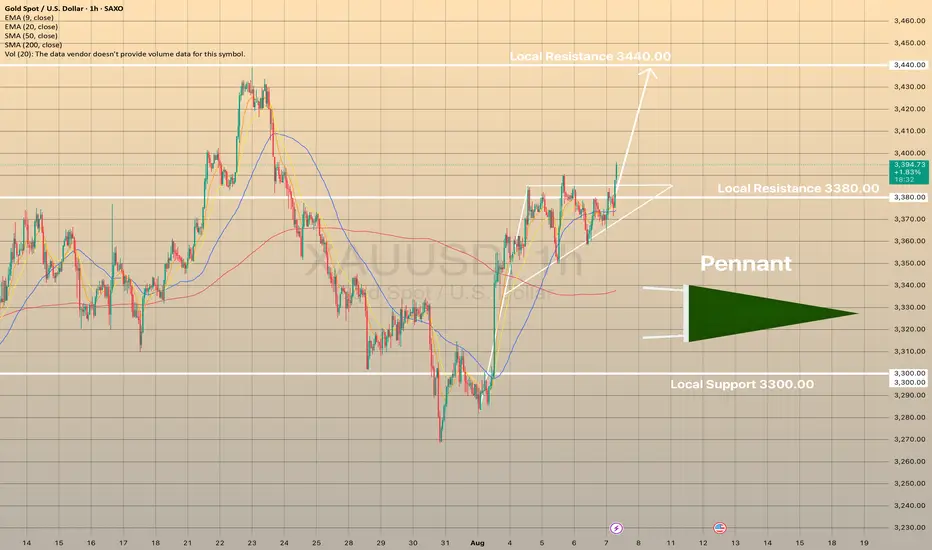
XAUUSD rises due to tariff wars and weak economic dataXAUUSD rises due to tariff wars and weak economic data
Gold climbed to 3,380.00 level on August 7, hitting a two-week high, as renewed U.S. tariff threats and expectations of Federal Reserve rate cuts in September and December boosted its appeal. President Trump announced 100% tariffs on imported semiconductors (excluding U.S.-made), 25% on Indian imports, and 50% on select Brazilian goods. Additionally, Weak U.S. economic data and a cooling labor market further support gold’s rise.
Technically, price has formed the Pennant chart pattern right below the local resistance of 3,380.00. Further breakout of the level and ascending towards 3,440.00 level is expected in short-term.
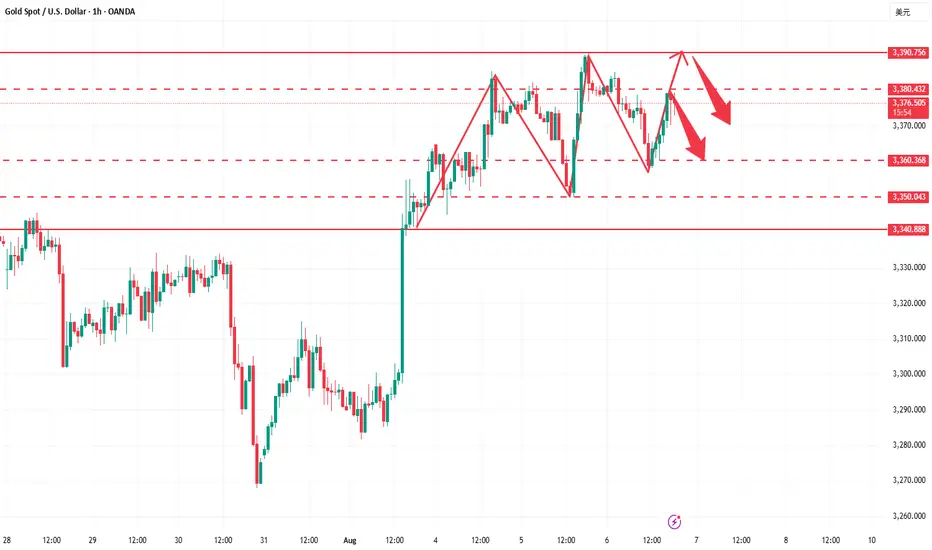
Gold fluctuates repeatedly. How can we avoid detours?Gold currently lacks sustained bullish momentum. The monthly chart has formed four consecutive upper shadows, indicating significant market pressure at high levels. Bulls are hesitant to take risks and lack the appetite for aggressive action, leading to a typical volatile pattern of rapid rises and equally rapid declines in gold prices. Yesterday's price action further confirmed this pattern. Although gold prices briefly reached a new high after bottoming out and rebounding, they were unable to consolidate above that level and subsequently retreated rapidly. Currently, the 3380-3390 area has become a key short-term resistance level, but repeated attempts to retest it have led to heavy selling pressure. Meanwhile, the 3370 area, a trading-intensive zone, poses significant downside risks for gold if it breaks below it, potentially extending the range to 3355-3340. Technically, resistance is concentrated in the 3380-3390 area, while support lies at 3355-3340. Short-term volatility is largely locked within this range. We recommend maintaining a volatile strategy of buying high and selling low.
Regarding trading strategies, we recommend placing short positions in batches within the 3375-3390 area, targeting 3360-3345. Pay attention to position control and stop-loss settings during this process. If the price rebounds to the support area and stabilizes, consider short-term long positions to flexibly respond to the intraday rhythm.
Gold (XAU/USD) - Bullish Breakout Opportunity Above Golden ZoneGold (XAU/USD) has recently shown strong bullish momentum, moving upward from a "Strong Support Area" and a lower "Golden Zone." The price is currently consolidating just below a significant resistance area, the 1st TG (Target), which is also labeled as a "Golden Zone." This presents a potential high-probability setup.
My analysis suggests that the current consolidation is a period of accumulation before the next leg of the uptrend. The key to a successful trade here will be a confirmed breakout above the 1st TG. This would indicate that buyers have absorbed the selling pressure at this resistance and are ready to push the price higher.
Bullish Scenario: The primary scenario I'm watching is a breakout above the 1st TG and its corresponding "Golden Zone" resistance. A clear 4-hour candle closing above this area would be a strong bullish signal.
Bearish Scenario: A failure to break the resistance, followed by a sharp move back down below the current consolidation level (1st SUP), would invalidate the bullish thesis and suggest a potential deeper retracement.
Trading Plan:
Long Entry: Enter a long position on a confirmed breakout and close above the 1st TG (Golden Zone) resistance level.
Profit Target 1: The 2nd TG level, which sits at the top of the chart.
Stop Loss: A stop loss should be placed below the 1st SUP level to protect against a false breakout or a reversal.

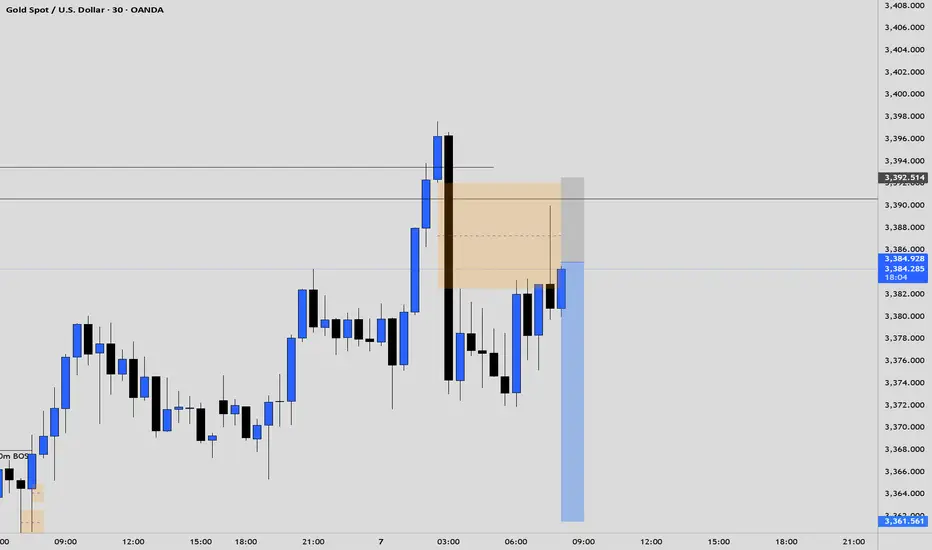
Gold Market Update – Tuesday Capitalist InsightGold market tapped into the 3380's supply zone, triggering a retracement toward the 3350's demand zone. This mitigation aims to set the tone for the next hedge formation, which will likely determine the next directional momentum.
🟡 Key Levels:
Supply: 3390's
Demand: 3350's
Next Bias Confirmation: Reaction from 3350 zone
🔁 Watch for:
A strong bounce from 3350's could confirm continuation of the bullish trajectory, while failure to hold may reopen bearish correction zones. Follow for more insights , comment and boost idea
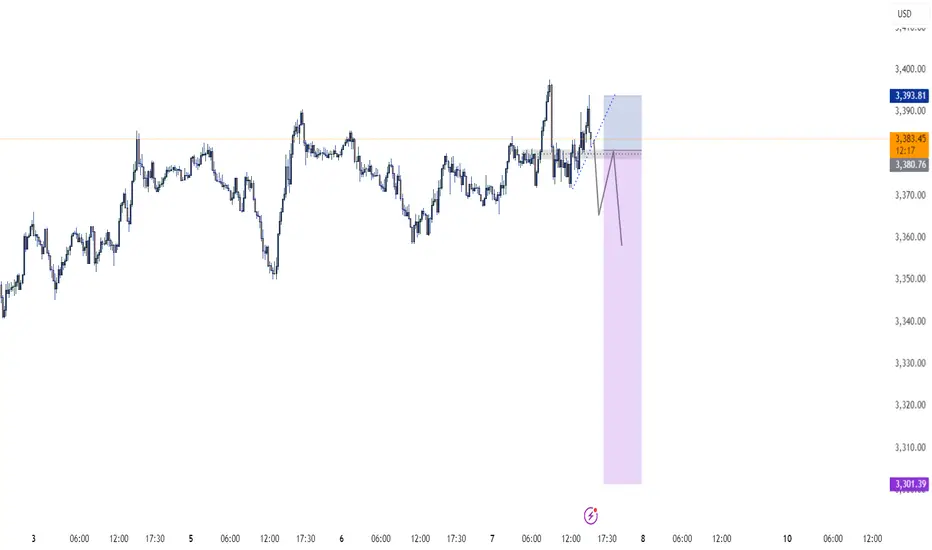
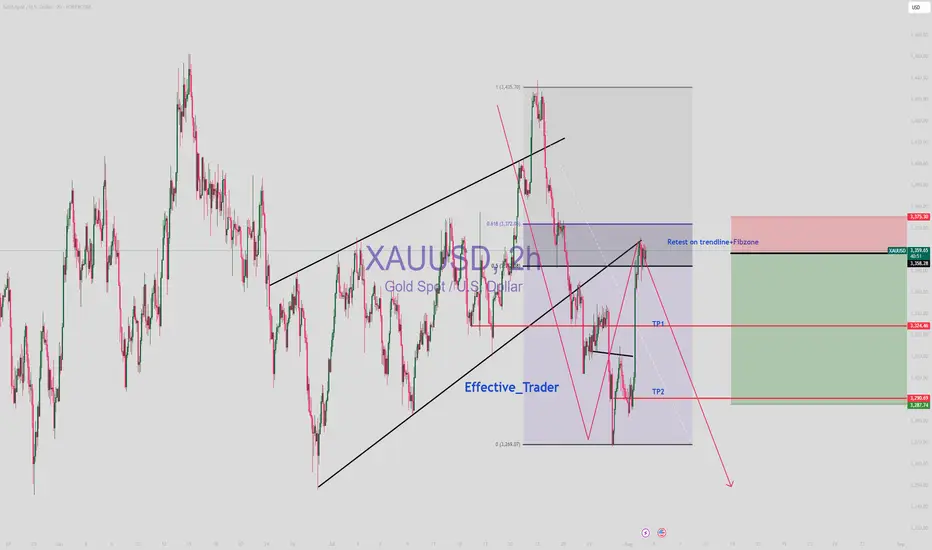
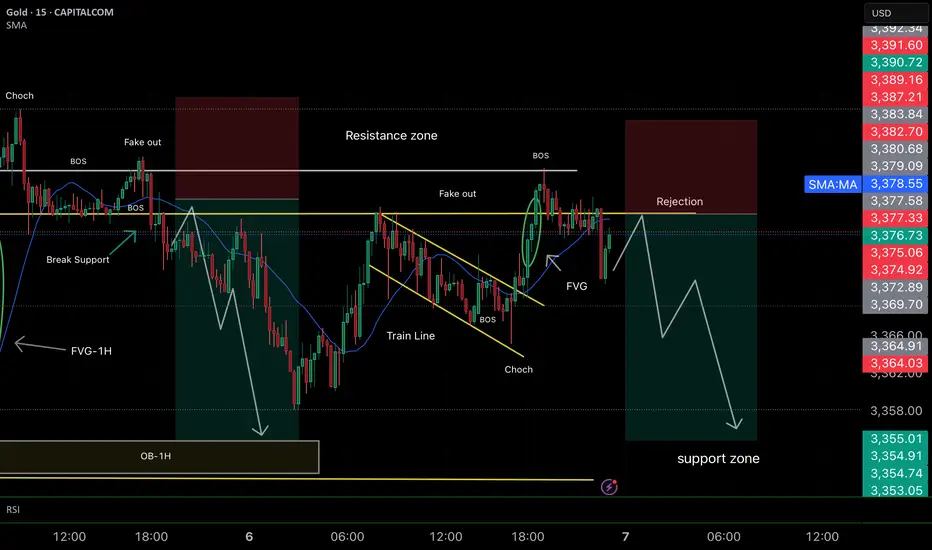
Smart Money Concept (SMC)📉 Bearish Analysis XAU/USD – SMC
🔹 1. Previous Market Structure
• Price was respecting a train line (trendline) which was broken aggressively, confirming a Break of Structure (BOS).
• After that, the market created a fake out above the resistance zone, grabbing liquidity from early buyers.
🔹 2. Signs of Weakness
• A clear rejection at the resistance zone, showing that buyers lost control.
• The train line break also signals a Change of Character (ChoCh), suggesting the beginning of a bearish swing.
🔹 3. Prior Mitigation Completed
• Price already mitigated key zones, including the 1H Order Block (OB-1H) and previous 1H Fair Value Gap (FVG).
• A new bullish FVG was formed but seems to have been rejected, adding to the bearish pressure.
🔹 4. Trade Plan
• Entry: Rejection after the fake out within the red supply zone
• Target: Support zone between 3,355 – 3,352, where liquidity is likely resting
• Stop Loss: Above resistance and the last BOS to avoid being caught by manipulation
💡 Summary for your caption:
“Price broke the trendline and showed clear weakness at resistance, leaving behind unmitigated interest at lower levels. The FVG rejection suggests institutional intent. High-probability short setup targeting the support zone.” GOOD LUCK TRADERS.. ;)
XAU usd , a possible route mapplease go thru the path, watch and do act according to ur view as well.. good luck..
please note: this information has to take as an educational purpose. entering to this trade must be at ur risk..