Daily Gold Mapping (XAUUSD) — 7 August 2025
Market Bias: Bullish with Short-Term Rejection Possibility
Key Levels to Watch:
Resistance Zone (H4 Fresh Supply)
3383 - 3386
- Price is approaching a fresh H4 resistance area.
- We are eyeing this zone for a potential short-term rejection or pullback, suitable for scalping short entries.
- However, this zone is not a confirmed reversal unless price gives clear bearish structure.
Support Zone (H4 Demand + Double Bottom)
3362.5 - 3359.5
- A solid H4 support base has formed here.
- Double bottom structure hints at strong bullish sentiment from buyers defending this area.
- If price returns to this zone, we anticipate potential buy entries as continuation of bullish trend.
XAUUSD trade ideas
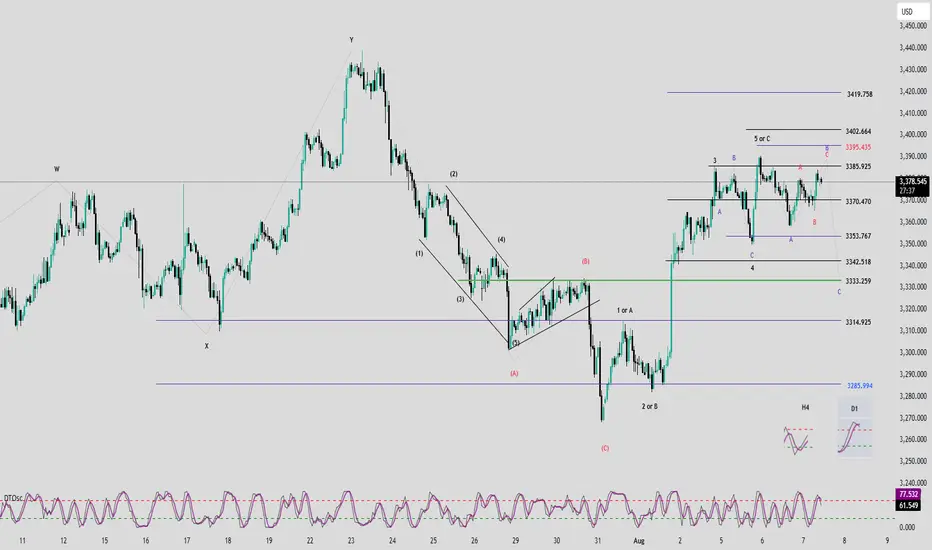
Elliott Wave Analysis – XAUUSD | August 7, 2025📊
________________________________________
🔍 Momentum Analysis:
• D1 Timeframe: Daily momentum is turning bearish, signaling that a medium-term downtrend may have already started and could last until mid-next week.
• H4 Timeframe: Momentum is rising, but the slope of the two momentum lines is relatively flat → indicating weak bullish strength. We should closely watch the overhead resistance zones.
• H1 Timeframe: Momentum has entered the overbought zone → a short-term reversal is likely, especially near the 3386 level.
________________________________________
🌀 Elliott Wave Structure:
• Based on the bearish momentum shift on the D1 chart, we expect the market is entering an ABC corrective pattern (in green).
• Currently:
o Wave A is completed.
o Wave B is in progress.
• Since Wave A appears to be a 3-wave structure, Wave B may unfold as a flat correction. In that case, potential target zones for Wave B are:
o 3385
o or 3395 → these are the key resistance levels to monitor.
• Within Wave B (green), we observe an internal 3-wave ABC structure (in red), where:
o Wave C (red) may reach:
3386
or extend toward 3395
→ In alignment with the D1 momentum signal, 3386 is considered a potential entry point for a short position.
________________________________________
📈 Trade Plan:
• SELL Zone: 3386 – 3389
• Stop Loss: 3397
• Take Profits:
o TP1: 3370
o TP2: 3353
o TP3: 3333
xau usd a probable scene Market can sweep its trend line liquidity and could take another buy entry at the given level.. and also can go to the target ...its just for an educational and study purpose , i dont recommend to take trade at this point. just watch and see
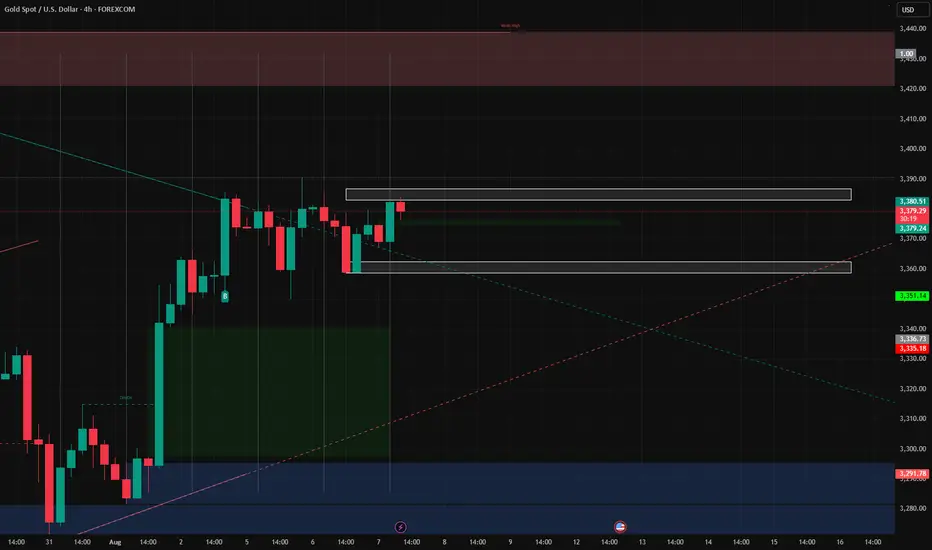
XAUUSD Weekly Outlook | $3,285 Key Level and Structure SetupHere’s my outlook on gold (XAUUSD) for the week of August 4–9, 2025.
Last week’s move was shaped by strong early dollar momentum, a 3% U.S. GDP report midweek, and Friday’s sentiment shift after the surprise tariff announcement.
Price is now sitting near the $3,380 supply zone, a structure that’s been in play since April. I highlight:
✅The key demand zone ($3,245–$3,285)
✅The broken descending trendline is now acting as support
✅Potential reaction around $3,360 early in the week
✅$3,285 remains my key level going forward. If ever price comes close, I’m watching for signs of strength or breakdown there to guide my setups.
I’ll update my thoughts in the comments as price action unfolds.
Disclaimer:
Based on experience and what I see on the charts, this is my take. It’s not financial advice—always do your research and consult a licensed advisor before trading.

Gold Trend Analysis August 7, 2025Market Overview
- Gold prices rose slightly in the first trading session of the week due to geopolitical concerns in the Middle East and weak US employment data
- However, selling pressure returned in the early morning today as the USD recovered and US bond yields rose slightly again
- The market is waiting for the speech of the Fed officials later today, which is expected to be hawkish
Factors that pressured gold down
- DXY index rose again, putting pressure on gold prices, which are priced in USD
- US 10-year bond yields increased
- FED said it was not in a hurry to cut interest rates
- Money flows shifted to stocks
GOLD H4 | Could the price reverse from here?XAU/USD is reacting off the sell entry at 3,382.85, which is a pullback resistance and could reverse from this level to the take profit.
Stop loss is at 3,432.37, which is a swing high resistance.
Take profit is at 3,333.65, which is a pullback support that is slightly above the 50% Fibonacci retracement.
High Risk Investment Warning
Trading Forex/CFDs on margin carries a high level of risk and may not be suitable for all investors. Leverage can work against you.
Stratos Markets Limited (tradu.com ):
CFDs are complex instruments and come with a high risk of losing money rapidly due to leverage. 65% of retail investor accounts lose money when trading CFDs with this provider. You should consider whether you understand how CFDs work and whether you can afford to take the high risk of losing your money.
Stratos Europe Ltd (tradu.com ):
CFDs are complex instruments and come with a high risk of losing money rapidly due to leverage. 66% of retail investor accounts lose money when trading CFDs with this provider. You should consider whether you understand how CFDs work and whether you can afford to take the high risk of losing your money.
Stratos Global LLC (tradu.com ):
Losses can exceed deposits.
Please be advised that the information presented on TradingView is provided to Tradu (‘Company’, ‘we’) by a third-party provider (‘TFA Global Pte Ltd’). Please be reminded that you are solely responsible for the trading decisions on your account. There is a very high degree of risk involved in trading. Any information and/or content is intended entirely for research, educational and informational purposes only and does not constitute investment or consultation advice or investment strategy. The information is not tailored to the investment needs of any specific person and therefore does not involve a consideration of any of the investment objectives, financial situation or needs of any viewer that may receive it. Kindly also note that past performance is not a reliable indicator of future results. Actual results may differ materially from those anticipated in forward-looking or past performance statements. We assume no liability as to the accuracy or completeness of any of the information and/or content provided herein and the Company cannot be held responsible for any omission, mistake nor for any loss or damage including without limitation to any loss of profit which may arise from reliance on any information supplied by TFA Global Pte Ltd.
The speaker(s) is neither an employee, agent nor representative of Tradu and is therefore acting independently. The opinions given are their own, constitute general market commentary, and do not constitute the opinion or advice of Tradu or any form of personal or investment advice. Tradu neither endorses nor guarantees offerings of third-party speakers, nor is Tradu responsible for the content, veracity or opinions of third-party speakers, presenters or participants.

Gold is in very nice bearish opportunity ahead.Gold is in very nice bearish opportunity ahead.. After breaking of long period bullish trend line. Gold is now testing The trendline. Just wait on confirmation on higher timeframe and The way down should be opened.

Daily Analysis- XAUUSD (Thursday, 6th August 2025)Bias: Bearish
Notes:
- Daily consolidating after Friday spike up
- Looking for price to retrace back down to daily structure
- Potential SELL if there's
confirmation on lower timeframe
- Pivot point: 3390
Disclaimer:
This analysis is from a personal point of view, always conduct on your own research before making any trading decisions as the analysis do not guarantee complete accuracy.

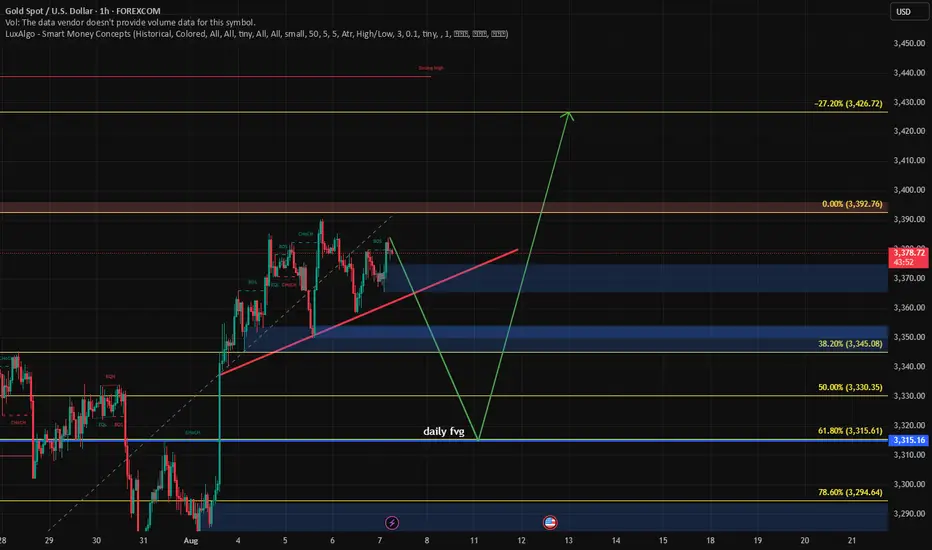
Latest Gold Price Update TodayHey everyone! Let’s take a closer look at what’s happening with gold today.
Over the past week, the global gold market experienced dramatic swings. Prices tumbled following cautious remarks from Federal Reserve Chair Jerome Powell, only to rebound sharply after disappointing U.S. employment data.
On Wednesday, the Fed held interest rates steady, and Powell stated, “We haven’t made any decisions for September.” Though brief, that statement hinted that a rate cut isn’t guaranteed — dashing investor hopes and sending gold to its lowest level in four weeks.
But by Friday, the narrative flipped. A weaker-than-expected jobs report triggered a powerful rally. Within just two minutes of the data release, gold surged by $30, closing the week at $3,361 — a gain of over 2% in a single day.
These moves highlight just how sensitive gold is to Fed signals. A slight shift in tone or a single data point can spark major volatility.
From a technical perspective, falling U.S. Treasury yields have allowed XAU/USD to regain bullish momentum, as the market reassesses Fed rate expectations after the weak NFP print. If gold successfully breaks out of its current channel after a short-term pullback, the next target could be $3,400 — or even higher.
Do you agree with this outlook? Share your thoughts in the comments.
Good luck and happy trading!
August 7, 2025 - XAUUSD GOLD Analysis and Potential OpportunitySummary:
Price action today is likely to stay within the 3358–3385 consolidation zone. Inside this range, the strategy is to sell near the top and buy near the bottom. Watch 3365 — if it breaks, look for short opportunities on pullbacks; if 3375 holds, look for long setups on dips. Overall, the support and resistance levels are cluttered, suggesting potential choppy moves. I’ll only act on very clean setups near key levels. If they don’t form, I’ll stay on the sidelines. Protect your capital and trade smart — good luck!
📍 Key Levels to Watch:
• 3405 – Resistance
• 3400 – Psychological resistance
• 3390 – Key intraday resistance
• 3375 – Resistance
• 3365 – Support
• 3350 – Psychological support
• 3345 – Support
• 3334 – Support
📈 Intraday Strategy
SELL below 3365, targeting 3358, then 3350, 3345, 3340
BUY above 3375, targeting 3380, then 3385, 3390, 3394
👉 If you find this helpful or traded using this plan, a like would mean a lot and keep me motivated. Thanks for the support!
Disclaimer: This is my personal view, not financial advice. Always use proper risk control.
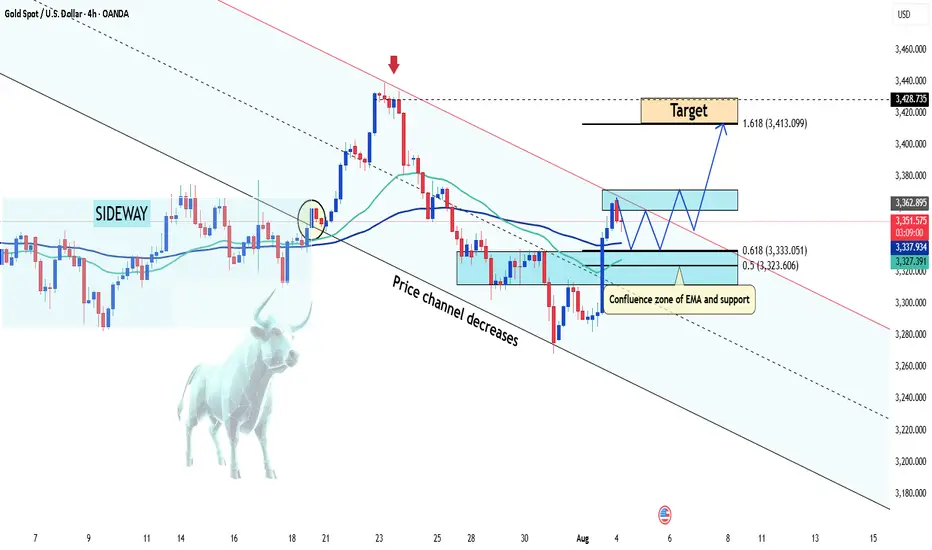
Gold Week 32 OutlookFollowing Non-farm payroll (NFP) on Friday, 01 August 2025, Gold started and maintained a bullish sentiment. With all things considered. It is likely to spend the early days of the week correcting before shooting back upwards towards Thursday/Friday.

XAU/USD - Potential Targets this WeekDear Friends in Trading,
How I see it,
Let me know if anything is unclear, inputs and questions always welcome.
I don't always have the right answers, but I do share my opinion freely.
I sincerely hope my point of view offers a valued insight
Thank you for taking the time study my analysis.

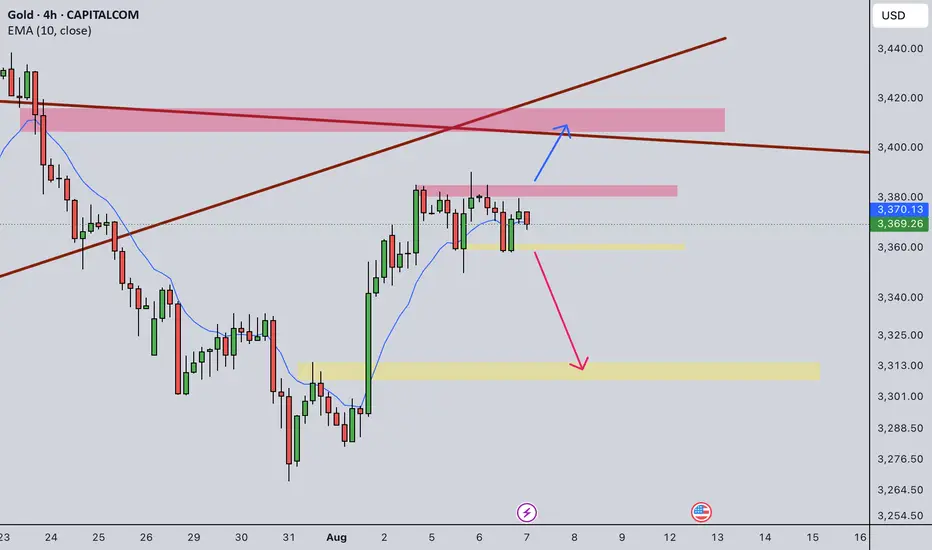
Gold Intraday Trading Plan 8/7/2025Gold is trapped in a range from 3357 to 3385 right now. I will look for trading opportunity upon breaking of the resistance or support.
If 3385 resistance is broken, I will buy toward 3417.
If 3357 support is broken, I will sell toward 3315.
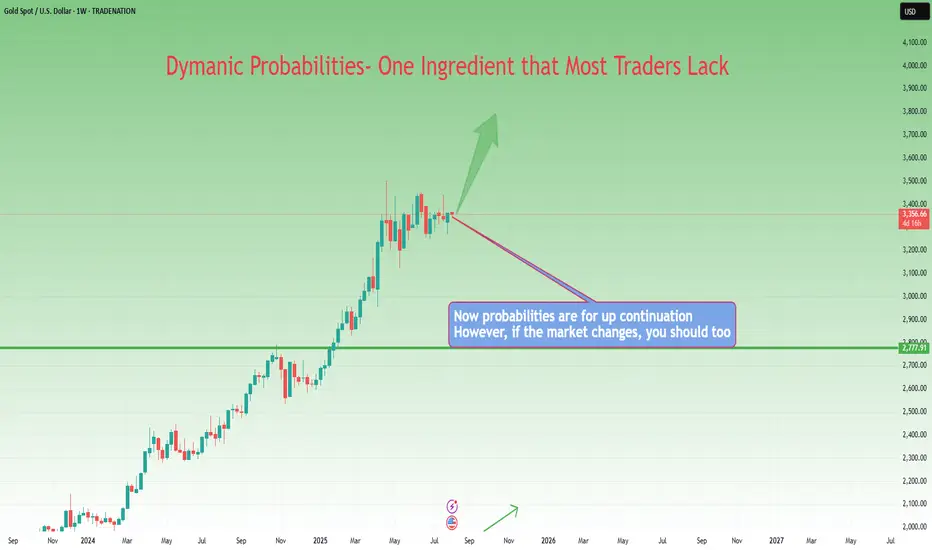
From Execution to Adaptation: Enter Dynamic ProbabilitiesIn the previous article , we looked at a real trade on Gold where I shifted from a clean mechanical short setup to an anticipatory long — not because of a hunch, but because the market behavior demanded it.
That decision wasn’t random. It was based on new information. On structure. On price action.
It was based on something deeper than just “rules” — it was about recognizing when the probability of success had changed.
That brings us to a powerful but rarely discussed concept in trading:
👉 Dynamic probabilities.
________________________________________
📉 Static Thinking in a Dynamic Market
Most traders operate with static probabilities — whether they realize it or not.
They assign a probability to a trade idea (let’s say, “this breakout has a 70% chance”) and treat that number as if it’s written in stone.
But markets don’t care about your numbers.
The moment new candles print, volatility shifts, or structure morphs — the probability landscape changes. What once looked like a clean setup can begin to deteriorate. Conversely, something that looked uncertain can start aligning into high-probability territory.
Yet many traders fail to adapt because they’re emotionally invested in the original plan.
They’ve already “decided” what the market should do, so they stop listening to what the market is actually doing.
________________________________________
🧠 Dynamic Probabilities Require Dynamic Thinking
To trade dynamically, you must be able to update your internal odds in real time.
This doesn’t mean constantly second-guessing or overanalyzing — it means refining your bias based on evolving context:
• A strong breakout followed by weak continuation? → probability drops.
• Price holding above broken resistance with clean structure? → probability increases.
• Choppy pullback into support with fading volume? → potential reversal builds.
It’s like playing poker: you might start with a good hand, but if the flop goes against you, your odds change.
If you ignore that and keep betting like you’ve got the nuts, you’re not being bold — you’re being blind.
________________________________________
📍 Back to the Gold Trade
In the Gold trade, the initial short was based on structure: broken support turned resistance.
The entry was mechanical, the reaction was clean. All good.
But then:
• Price came back fast into the same zone.
• Sellers failed to defend it decisively.
• The second leg down was sluggish, overlapping, and lacked momentum.
• Compression began to form.
That’s when the probability of continued downside collapsed — and the probability of a reversal increased.
The market had changed. So did my bias.
That’s dynamic probability in action — not because of a feeling, but because of evolving evidence.
________________________________________
🧘♂️ The Psychological Trap
Many traders intellectually accept the idea of being flexible — but emotionally, they cling to certainty.
They fear being “inconsistent” more than they fear being wrong.
But in a dynamic environment, consistency of thinking is not about repeating the same action — it’s about consistently reacting to what’s real.
True consistency is not mechanical repetition. It’s mental adaptability grounded in logic.
________________________________________
🧠 Takeaway
If you want to trade professionally, you must upgrade your mindset from fixed-probability execution to fluid-probability reasoning.
That doesn’t mean chaos. It means structured flexibility.
Your edge isn’t just in spotting patterns — it’s in knowing when those patterns are breaking down.
And acting accordingly, before your PnL does it for you.
Disclosure: I am part of TradeNation's Influencer program and receive a monthly fee for using their TradingView charts in my analyses and educational articles.
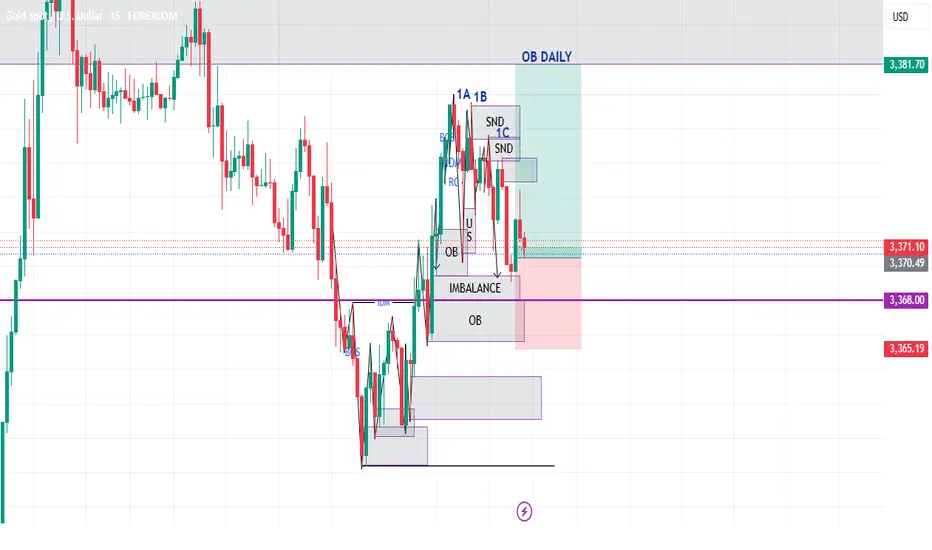
XAUUSDlook TF M5
Entry Setup and Risk Management:
Active Buy Limit at 3,368.00 (Volume: 10 million USD)
Entry is pending at the lower Order Block (OB) zone and the imbalance area.
SL (Stop Loss): Around 3,365.00
TP (Take Profit): 3,381.00 – 3,381.70
Manual Buy at 3,370.41 and 3,370.49 (Volume: 5 million USD each)
Both positions are currently open, targeting the same TP area — the Daily OB zone.
Price Confirmation:
The current price is around 3,371.73, showing bullish potential (upward reversal).
There is a bullish reac
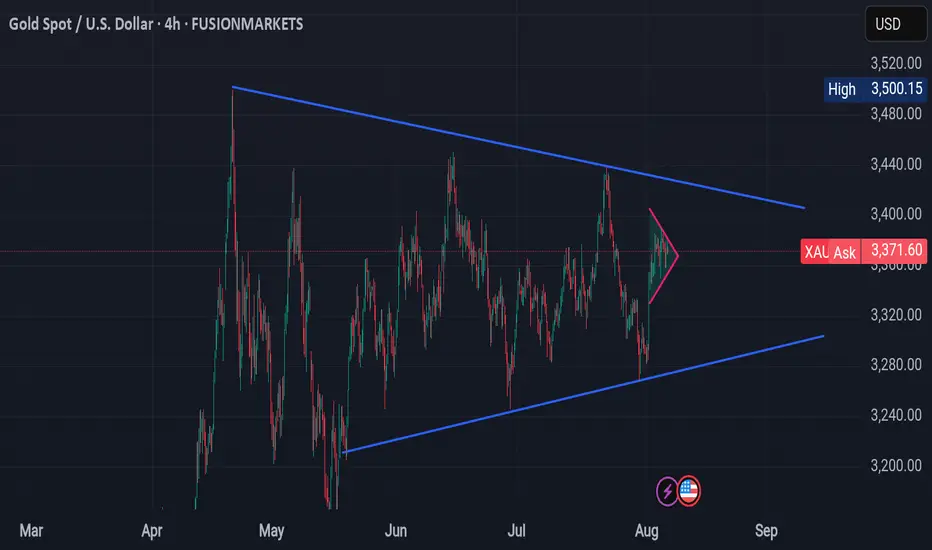
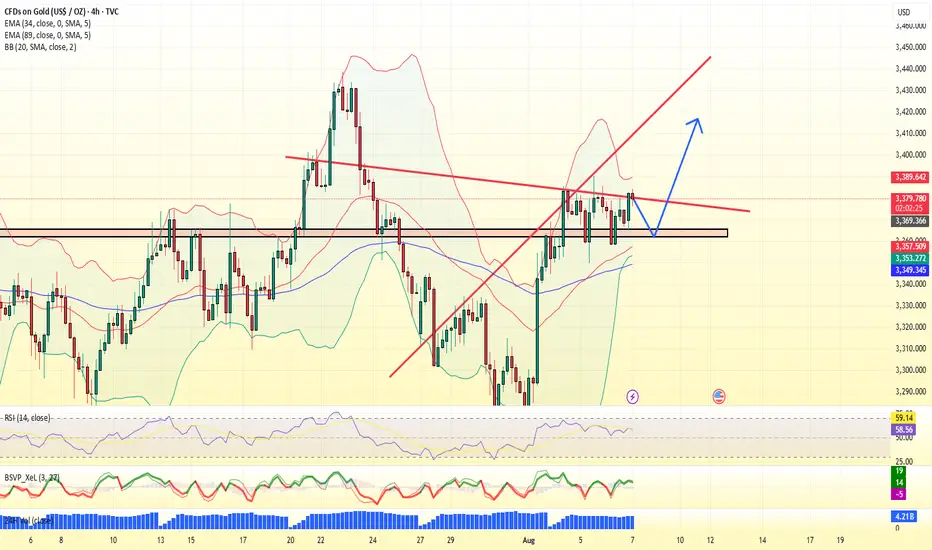
Professional Chart Analysis – Gold Spot (XAU/USD) – 4H Timeframe⏳ Overview
This 4-hour chart of XAU/USD (Gold vs USD) shows a large symmetrical triangle pattern with a smaller triangle forming near the apex — signaling an upcoming high-probability breakout. This structure reflects prolonged market indecision and compression of volatility.
---
🔺 1. Chart Pattern Structure
🟦 Primary Structure: Symmetrical Triangle
Upper Trendline (Resistance): Descending from ~3,480 to ~3,400
Lower Trendline (Support): Ascending from ~3,200 to ~3,300
This large triangle encapsulates price action since April 2025, representing an extended consolidation phase.
🟥 Secondary Structure: Mini Triangle
A smaller triangle (highlighted in pink) within the larger structure shows tight range consolidation in the last 2–3 weeks.
This acts as a coiling zone, where a breakout is imminent.
---
📈 2. Price Action Analysis
Current Price: $3,374.26 (midpoint of the large triangle)
Volatility: Significantly reduced, suggesting a breakout move is coming.
Market Condition: Low momentum and choppy within the range — likely liquidity build-up by institutions.
---
🎯 3. Key Levels
Zone Price Range Significance
Immediate Resistance $3,400–$3,420(Local top of triangle)
Immediate Support $3,300–$3,320(Bottom triangle support)
Major Breakout Level 🔼 Above $3,420(Bullish breakout)
Major Breakdown Level 🔽 Below $3,280 (Bearish breakdown)
High Target Zone $3,500–$3,560(Measured bullish move)
Low Target Zone $3,200–$3,140(Measured bearish move)
---
🧭 4. Trade Setup Scenarios
✅ Bullish Scenario (Breakout Above $3,420)
Entry: Above $3,420
Stop-Loss: Below $3,390
Targets:
TP1: $3,500
TP2: $3,560
⚠️ Bearish Scenario (Breakdown Below $3,280)
Entry: Below $3,280
Stop-Loss: Above $3,310
Targets:
TP1: $3,200
TP2: $3,140
---
📉 5. Institutional Perspective
This pattern may represent distribution (if it breaks down) or re-accumulation (if it breaks up).
Institutions often use triangle apexes as breakout points to trigger stop hunts and induce volatility.
---
📝 Professional Conclusion
> Gold (XAU/USD) is in a well-defined symmetrical triangle, with price action approaching a critical breakout zone. The market is coiling within a smaller triangle, suggesting a volatility explosion is near. Traders should stay out of the chop zone and prepare for a breakout or breakdown confirmation using volume, candlestick structure, or retest setups.
---
Would you like me to:
🔧 Mark this chart with entry/exit levels, stop loss, and breakout targets?
📤 Prepare a version suitable for posting on TradingView with annotations and analysis title?