GOLD NEXT MOVE (expecting a bearish move)(08-08-2025)Go through the analysis carefully and do trade accordingly.
Applicable- once price reaches the 3372-75
Anup 'BIAS for the day (12-08-2025)
Current price (as per applicability)- 3370-75
"if Price stays below 3388, then next target is 3365, 3355 and 3300 and below that 3250 and above that 3400 ".
-POSSIBILITY-1
Wait (as geopolitical situation are worsening )
-POSSIBILITY-2
Wait (as geopolitical situation are worsening)
Best of luck
Never risk more than 1% of principal to follow any position.
Support us by liking and sharing the post.
XAUUSD trade ideas
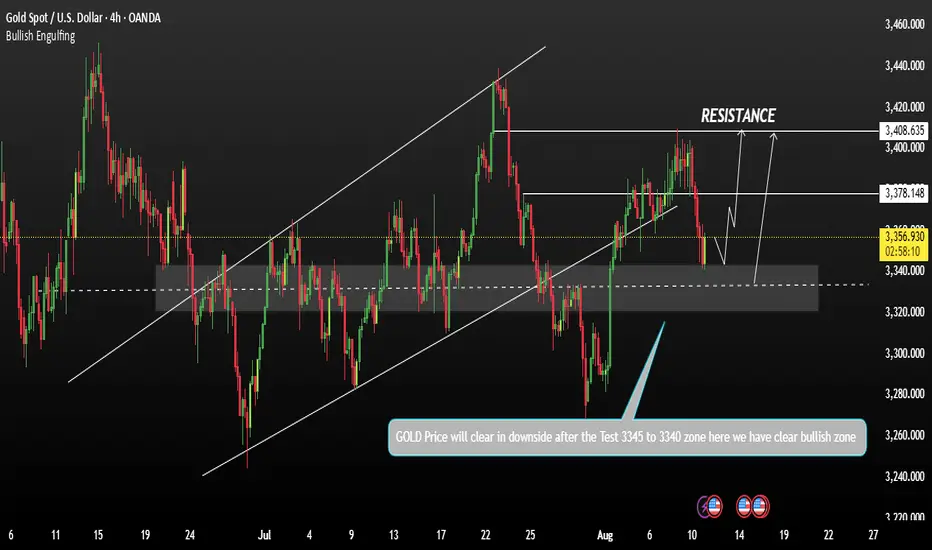
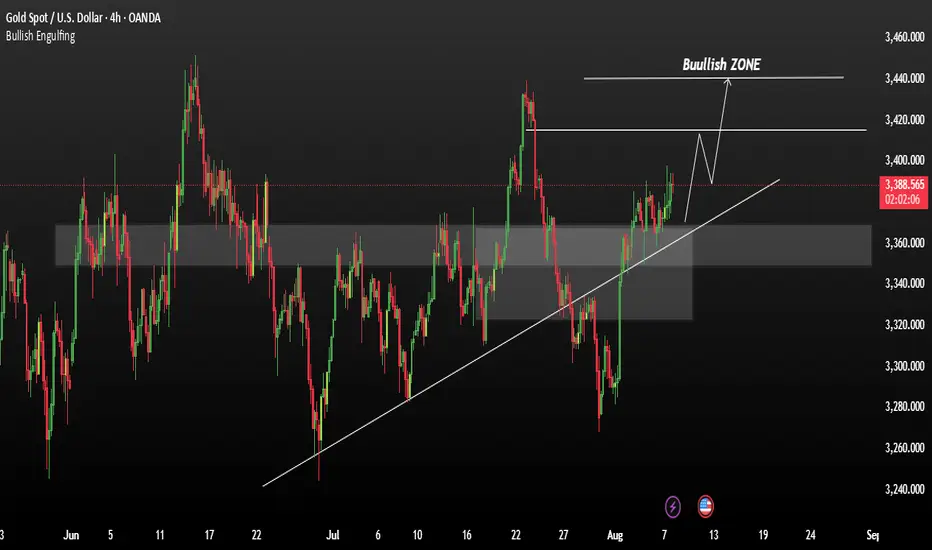
GOLD Price could retest Support after GrowthGold remains in a bullish zone overall, but today’s price action shows a potential short-term downtrend forming. Weak China PPI data Profit-taking ahead of the US inflation report Ongoing uncertainty in US–China trade negotiations. Tensions over microchip policy between the US and China.
Key range to watch: 3350 – 3400.
3350 is acting as a strong support — a hold above could lead to a rebound A sustained break above 3400 may open the path toward higher targets.
If you want, I can also make you a chart-ready short version for quick posting to your audience. That way, it’s concise but still professional.
Ps; Support with like and comments for better analysis Thanks for supporting.
Gold Bounces from PRZ — Is a Short-Term Rally Underway?Gold ( OANDA:XAUUSD ) started to rise from the Support zone($3,307-$3,275) as I expected in the previous idea .
Gold is currently moving near the Support zone($3,350-$3,326) , Potential Reversal Zone(PRZ) , and $3,334 (Important price) .
From the Elliott wave theory , it seems that Gold has completed its 5 impulsive waves and now we should wait for corrective waves . Corrective waves can complete at the Potential Reversal Zone(PRZ) .
I expect Gold to rise to $3,383(at least) in the coming hours .
Second Target: $3,396
Note: Stop Loss (SL) = $3,321
Gold Analyze (XAUUSD), 1-hour time frame.
Be sure to follow the updated ideas.
Do not forget to put a Stop loss for your positions (For every position you want to open).
Please follow your strategy; this is just my idea, and I will gladly see your ideas in this post.
Please do not forget the ✅ ' like ' ✅ button 🙏😊 & Share it with your friends; thanks, and Trade safe.

GOLD Technical Analysis! BUY!
My dear subscribers,
My technical analysis for GOLD is below:
The price is coiling around a solid key level - 3392.3
Bias - Bullish
Technical Indicators: Pivot Points Low anticipates a potential price reversal.
Super trend shows a clear buy, giving a perfect indicators' convergence.
Goal - 3397.7
Stop Loss - 3389.29
About Used Indicators:
By the very nature of the supertrend indicator, it offers firm support and resistance levels for traders to enter and exit trades. Additionally, it also provides signals for setting stop losses
Disclosure: I am part of Trade Nation's Influencer program and receive a monthly fee for using their TradingView charts in my analysis.
———————————
WISH YOU ALL LUCK

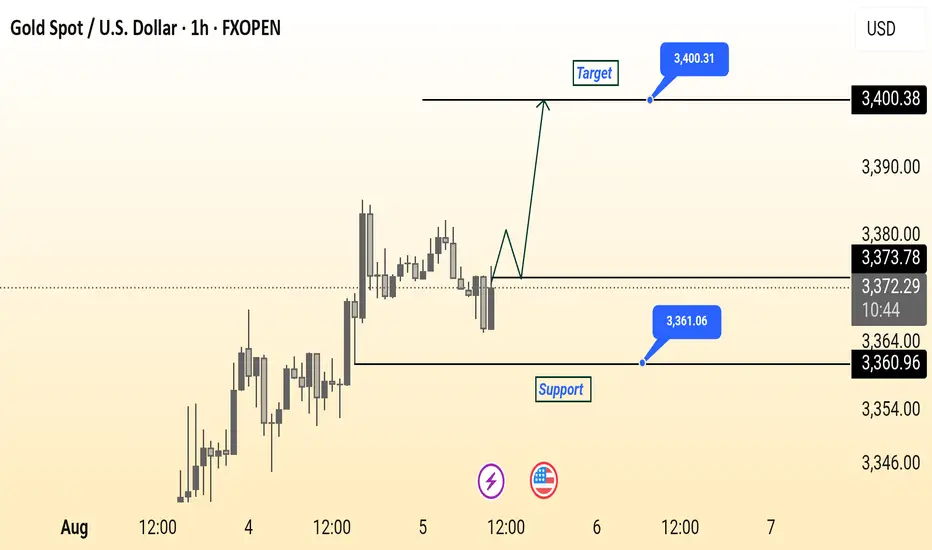
Gold Spot (XAU/USD) 1-Hour Chart Analysis – Potential Upside TowThis 1-hour chart for Gold Spot (XAU/USD) from FXOPEN shows a key support level at $3,360.96 and a potential target at $3,400.31. The current price is hovering around $3,372.04, just below the minor resistance of $3,373.78. A bullish breakout from this zone could initiate a move toward the target, as illustrated by the projected upward path. The support zone marked in blue suggests a strong buying interest that could act as a rebound area if prices dip. Watch for price action confirmation near support for potential long entries.
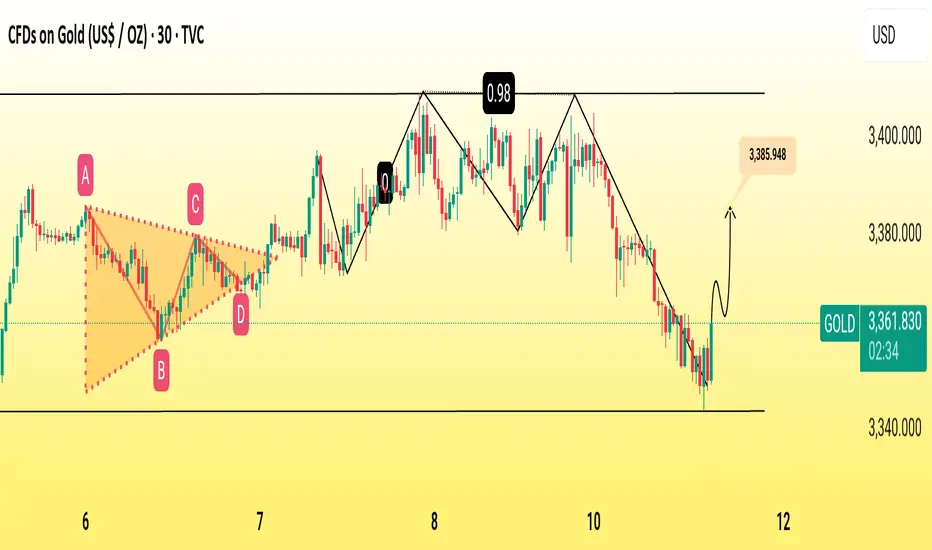
Gold Price Eyes Bullish Rebound After Triangle BreakoutGold (XAU/USD) is showing signs of a potential upward reversal after bouncing from the $3,350 support zone. The earlier symmetrical triangle (A-B-C-D) breakout led to sideways consolidation before a retracement. Price action now suggests bullish momentum could target $3,385, with strong support holding near $3,340. A break above the short-term resistance could confirm the rebound toward higher levels.
1. Symmetrical Triangle Breakout – The A-B-C-D pattern indicated price compression, followed by an upside breakout, showing bullish bias.
2. Support Zone – Strong support is established around $3,340–$3,350, holding despite recent selling pressure.
3. Retracement Phase – Price pulled back after peaking near $3,400, creating a lower-high sequence.
4. Bullish Reversal Signal – Recent bounce from support suggests buyers are stepping back in.
5. Upside Target – Immediate resistance lies near $3,385; a break above could lead toward the $3,400 zone.
6. Risk Factor – Failure to hold above $3,340 could open the door for further downside correction.
(Gold) Technical Analysis – Buy-Side Correction in PlayGold is currently undergoing a correction on the buy side, with price action suggesting the potential for further upside. The market is showing bullish momentum amid rising global uncertainty.
Dovish Fed Expectations: Increasing speculation around potential Fed rate cuts, along with discussions about leadership changes (including the possible replacement of Kugler and Powell), is contributing to a more accommodative outlook. Geopolitical & Trade Tensions: Continued escalation of global trade conflicts is boosting demand for safe-haven assets like gold, adding to bullish pressure.
If the price holds above the 3370–3380 support zone, bullish continuation toward 3420/3440 is likely in the short term.
You May find more details in the chart.
Ps; Support with like and comments for better analysis
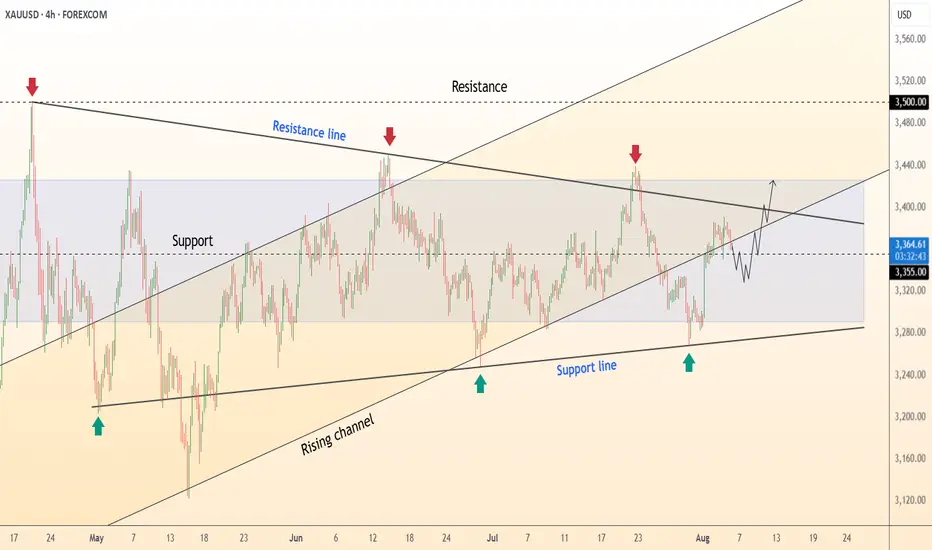
DeGRAM | GOLD around the lower boundary of the channel📊 Technical Analysis
● XAUUSD bounced off the rising channel base at 3,280 and reclaimed the mid-range of the 3,294–3,435 consolidation zone, carving out a higher low pattern.
● The price is compressing into the descending resistance, with a break above 3,400 confirming upside extension toward 3,435 and 3,500.
💡 Fundamental Analysis
● Gold demand stays firm as investors hedge against US fiscal concerns after Fitch’s downgrade, while real yields ease on softer employment revisions.
✨ Summary
Buy above 3,310; break >3,400 targets 3,435 → 3,500. Setup invalid below 3,280.
-------------------
Share your opinion in the comments and support the idea with a like. Thanks for your support!
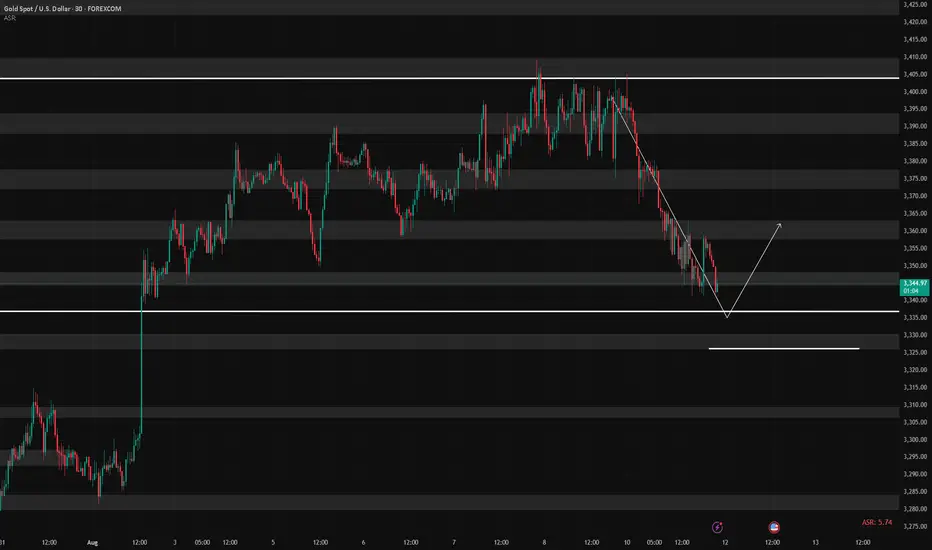
8/12: Key Support at 3343–3337, Resistance at 3366–3372Good morning, everyone!
Yesterday, the market saw a one-sided drop, with selling pressure on the 4H chart largely released. However, the daily bullish structure has been damaged. Given the size of yesterday’s decline, there’s a decent chance of an intraday rebound today.
Key support levels to watch are 3343–3337 and 3328–3323, while resistance sits at 3352–3358 and 3366–3372–3378. Trading should focus on these zones.
With today’s news-driven volatility likely to exceed yesterday’s, if the downtrend continues, I see 3312–3298 as an attractive buying opportunity. My overall bias for the day remains buying on dips, with potential short opportunities near resistance.

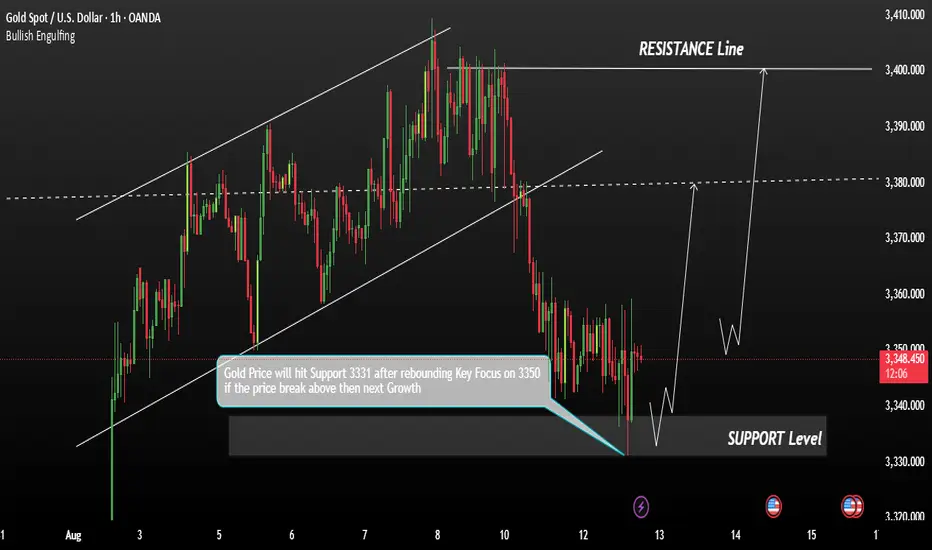
GOLD Rebound Ahead of Top GrowthGold has rebounded from the 3331 support zone and is moving back towards the resistance line. Price is currently consolidating at these levels, and a sustained push above 3350 could open the path towards the next resistance areas at 3380 and 3400.
Holding above the upward trend channel supports a bullish continuation. A failure to hold this trend channel could invite selling pressure, especially if the USD strengthens. Sudden macroeconomic developments may impact safe-haven demand and cause sharp intraday volatility.
You May find more details in the chart.
Trade wisely Best of Luck Buddies.
Ps; Support with like and comments for better analysis.
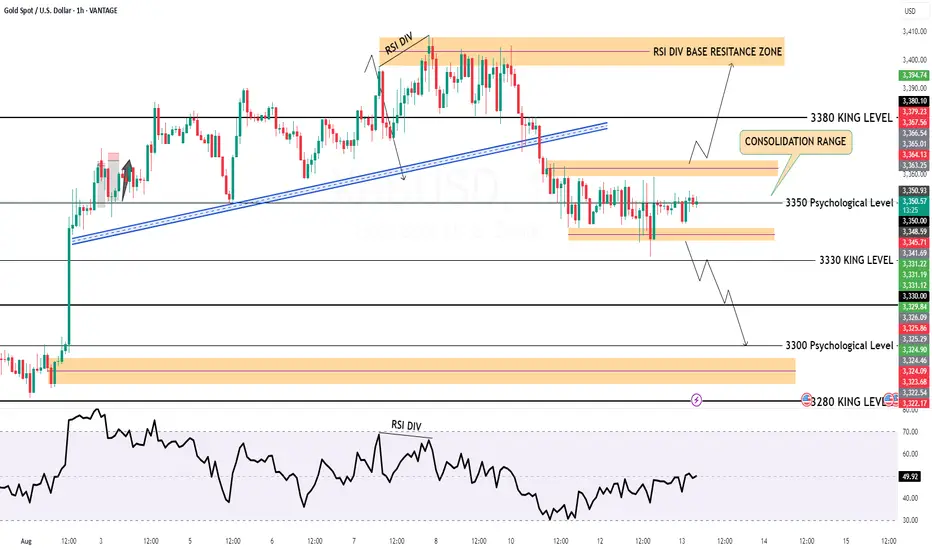
Gold Poised to Rise on Looming Russia Sanctions!!Hey Traders, above is a breakdown of the current technical and fundamental setup for Gold, with a focus on key support zones and the macro landscape that could drive further upside.
From a technical standpoint, the first major support area to watch is around 3,334, which previously acted as a strong resistance level. Now that price has broken above it, we could see this zone retested as a support — a classic breakout-retest scenario that may offer a potential bounce opportunity.
The second key zone is located near 3,311, a historically significant support/resistance level. What makes this level even more critical is its confluence with the primary ascending trendline, reinforcing its importance as a structural support in case of a deeper retracement.
On the fundamental side, gold continues to benefit from its role as a safe-haven asset, especially amid rising geopolitical and economic tensions. There are two major catalysts in play right now:
Escalating trade tensions, particularly around new tariffs. Markets are pricing in a high baseline tariff risk of 15%, which adds a layer of uncertainty and supports defensive assets like gold.
Mounting geopolitical pressure on Russia, with the U.S. expected to announce secondary sanctions this week. These could further disrupt global markets and drive demand for hard assets.
In summary, gold is positioned well both technically and fundamentally. If price holds above the mentioned support zones, we could see renewed bullish momentum in the sessions ahead. Keep an eye on developments related to trade policy and sanctions, they could be key drivers of the next move.

Gold Retesting Support 3,350–3,345-Short-Term Buying Opportunity📊 Market Overview
Gold is currently trading around 3,350 USD/oz, slightly higher than the previous session thanks to expectations that the Fed will cut interest rates amid a weakening USD. The market remains cautious ahead of upcoming U.S. inflation data, which could provide new momentum for gold prices. Additionally, President Trump’s confirmation that gold imports will not face tariffs has helped stabilize investor sentiment.
📉 Technical Analysis
• Key Resistance: 3,400 – 3,410 USD/oz
• Nearest Support: 3,345 – 3,350 USD/oz
• EMA09: Price is currently below the EMA09 on the H1 timeframe → short-term downward pressure still persists.
• Candlestick / Volume / Momentum: After a sharp drop on August 11, price is sideways around the support zone; RSI on H1 is about 56, not yet overbought, indicating potential for a rebound if support holds.
📌 Outlook
Gold could rebound short term from the 3,350–3,345 zone if U.S. inflation data comes in lower than expected and the USD continues to weaken. However, if price breaks below 3,345 with strong selling pressure, the downtrend may extend to 3,335 or 3,330.
💡 Suggested Trading Strategy
BUY XAU/USD: 3,346 – 3,343 USD/oz
🎯 TP: 40/80/200 pips
❌ SL: 3,339 USD
SELL XAU/USD: 3,407 – 3,410 USD/oz
🎯 TP: 40/80/200 pips
❌ SL: 3,413 USD

GOLD Intraday H1 Chart For 13 August 25Hello Traders,
as you can see that GOLD is still in tight range all eyes for now 3365 resistance level break out for further upward move
below 3330 level GOLD remains bearish and will move towards 3308 level
Disclaimer: Forex is Risky
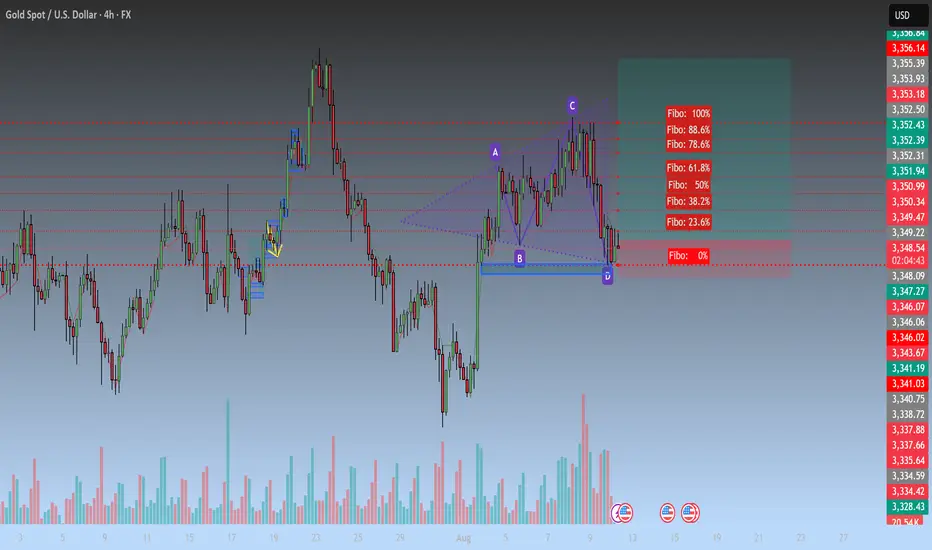
XAUUSD Analysis – August 12 – 4H ChartOn the 4H timeframe, gold is forming a Bullish Harmonic structure (likely a Gartley or Bat pattern), with point D appearing around the strong support zone 3,349 – 3,346 USD, aligning with the 0% Fibonacci level and previous swing low.
1. Technical Breakdown
Harmonic Pattern:
A → B: Strong bearish leg.
B → C: Retracement to the 61.8 – 78.6% Fibo zone.
C → D: Decline to the 88.6 – 100% Fibo zone, touching a strong support area and giving potential reversal signals.
Fibonacci Retracement Key Levels:
50%: 3,352 USD.
61.8%: 3,353 – 3,354 USD.
78.6% – 88.6%: 3,355 – 3,356 USD (near-term resistance target).
Volume: Bullish wick candles at point D with higher volume, indicating bottom-picking activity.
EMA: Price is currently testing the short-term EMA; a successful breakout could open the way toward higher resistance levels.
2. Trading Scenarios
Scenario 1 – Buy following the Harmonic pattern (Preferred):
Entry: 3,349 – 3,350 USD.
Stop Loss: 3,343 USD (just below point D by ~6–7 USD).
TP1: 3,352 USD (Fibo 50%).
TP2: 3,355 USD (Fibo 61.8%).
TP3: 3,358 USD (major resistance + Fibo 78.6%).
RRR: ~4.8 as seen on the chart, suitable for short-term swing setups.
Scenario 2 – Sell against the pattern (High Risk):
Only consider if price breaks strongly below 3,343 USD with high volume.
Target: 3,338 – 3,335 USD.
3. Key Notes
Prioritize buying as long as price holds above point D with bullish confirmation on H1–H4 timeframes.
If price rallies but fails to break above 3,355 USD, consider partial profit-taking and moving SL to breakeven.
Risk management: limit to 1–2% per trade, avoid FOMO entries.
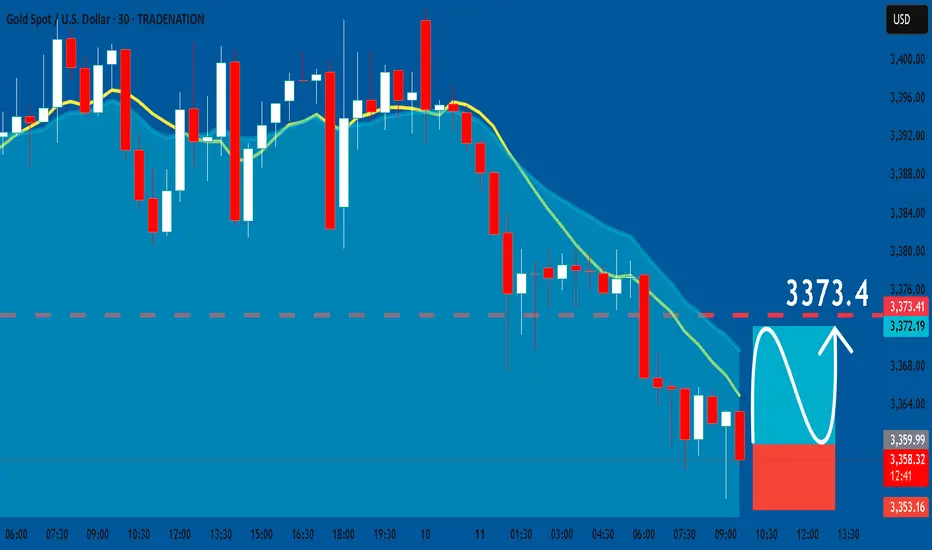
GOLD: Bullish Continuation & Long Trade
GOLD
- Classic bullish setup
- Our team expects bullish continuation
SUGGESTED TRADE:
Swing Trade
Long GOLD
Entry Point - 3360.0
Stop Loss - 3353.1
Take Profit - 3373.4
Our Risk - 1%
Start protection of your profits from lower levels
Disclosure: I am part of Trade Nation's Influencer program and receive a monthly fee for using their TradingView charts in my analysis.
❤️ Please, support our work with like & comment! ❤️
Gold short opportunityGold completed its mini bull flag target and re-entered a micro rising channel, a potentially bearish structure.
With price now testing a key supply zone, we’re watching for rejection to initiate a short, targeting the major demand zone below.

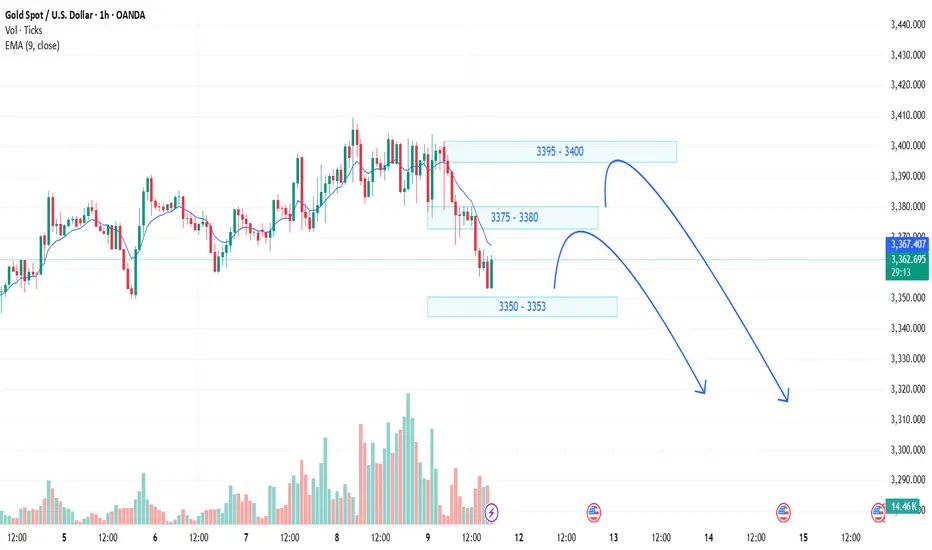
XAUUSD Gold Trading Strategy August 11, 2025XAUUSD Gold Trading Strategy August 11, 2025:
At the beginning of the new week's trading session, the gold price fell sharply from the 340x area to the current 335x area.
Basic news: The US Dollar Index (DXY) fell to around 98 last week, unable to stay above 100. Although the 10-year Treasury yield rose to 4.285%, the Dollar remained under pressure, reflecting market concerns about political risks in the United States.
Technical analysis: After the price met the 340x resistance area, it fell sharply. Currently, the H1 frame MA lines have turned into resistance, but the H4 frame is still support. The H1 frame RSI is showing signs of increasing again and moving towards the average line; the H4 frame RSI is adjusting towards the oversold area. We will wait at the resistance areas and liquidity areas to trade.
Important price zones today: 3375 - 3380, 3350 - 3355 and 3395 - 3400.
Today's trading trend: SELL.
Recommended orders:
Plan 1: SELL XAUUSD zone 3378 - 3380
SL 3383
TP 3375 - 3365 - 3355 - 3330.
Plan 2: SELL XAUUSD zone 3395 - 3397
SL 3400
TP 3392 - 3382 - 3362 - 3330.
Plan 3: BUY XAUUSD zone 3353 - 3355
SL 3350
TP 3358 - 3368 - 3378 - 3390 (small volume).
Wish you a safe, successful and profitable new trading week.🥰🥰🥰🥰🥰
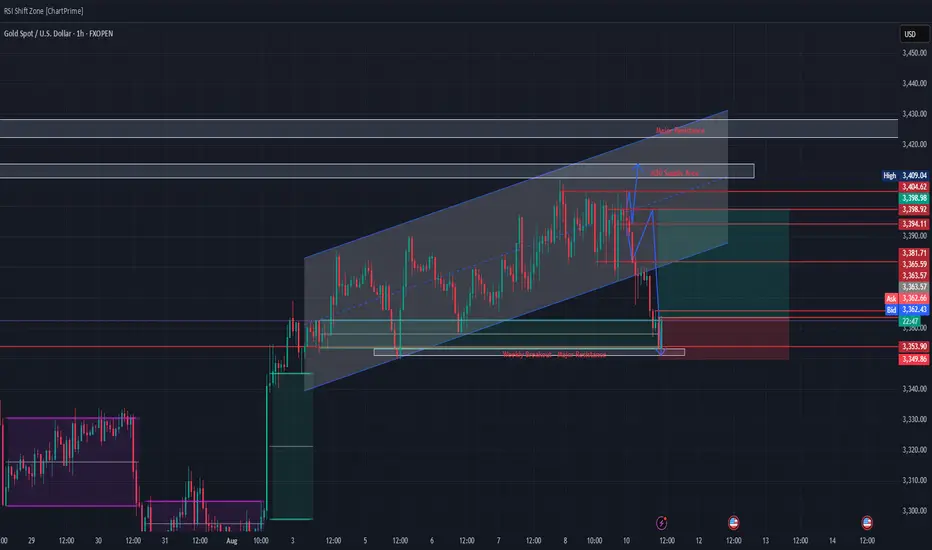
XAUUSD has broken out of the channelBased on my analysis, XAUUSD has broken out of the channel and reached the weekly breakout zone. I anticipate a retracement back into the channel, followed by a decline.
GOLD Reacts Perfectly at Reversal Zone — What’s Next? GOLD Reacts Perfectly at Reversal Zone — What’s Next?
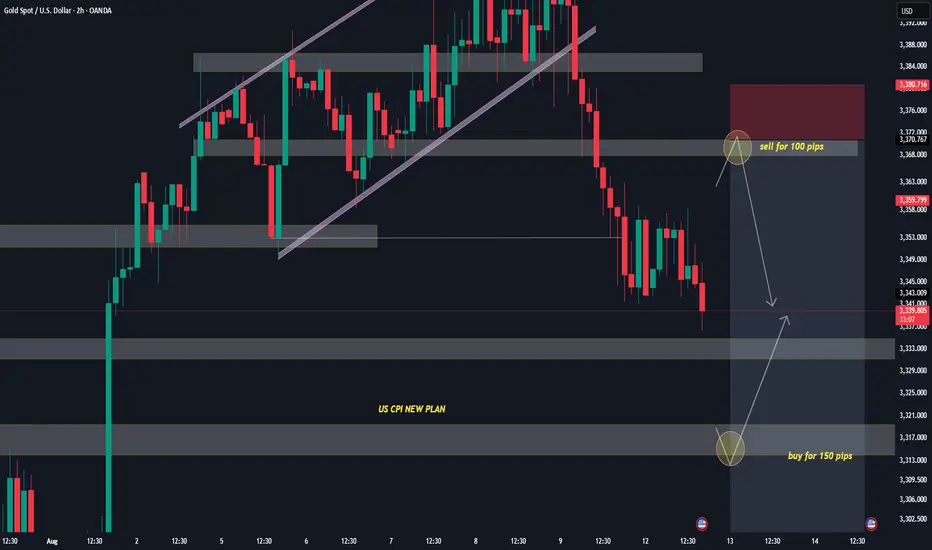
As anticipated in Friday’s analysis, Gold delivered a clean bearish move, dropping from 3400 to 3350 after reacting precisely within our identified reversal zone.
Looking ahead, I expect further downside potential in the coming days. However, a short-term correction may occur ahead of the U.S. CPI release, as markets recalibrate expectations.
Caution is advised — volatility may increase around the data event, and any retracement could offer new entry opportunities for the next leg lower.
You may watch the analysis for further details!
Thank you and Good Luck!
PS: Please support with a like or comment if you find this analysis useful for your trading day

Gold 30Min Engaged ( Bearish & Bullish Entry Detected )Time Frame: 30-Minute Warfare
Entry Protocol: Only after volume-verified breakout
🩸Bearish From now Price - 3373
🩸Bullish Reversal : 3341
➗ Hanzo Protocol: Volume-Tiered Entry Authority
➕ Zone Activated: Dynamic market pressure detected.
The level isn’t just price — it’s a memory of where they moved size.
Volume is rising beneath the surface — not noise, but preparation.
🔥 Tactical Note:
We wait for the energy signature — when volume betrays intention.
The trap gets set. The weak follow. We execute.

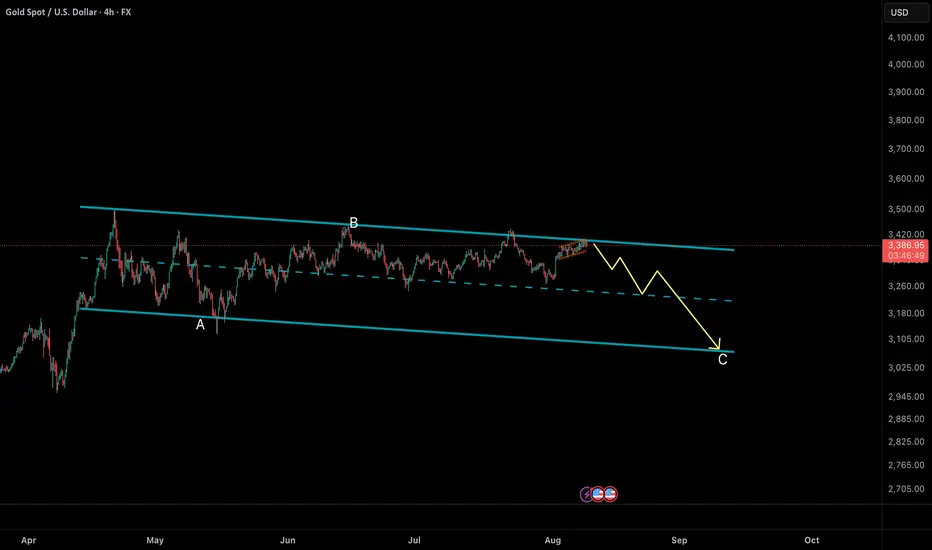
Bearish trend for GoldAre you ready for bearish trend of Gold?
After touching upper line of channel, Gold is ready for starting bearish trend.
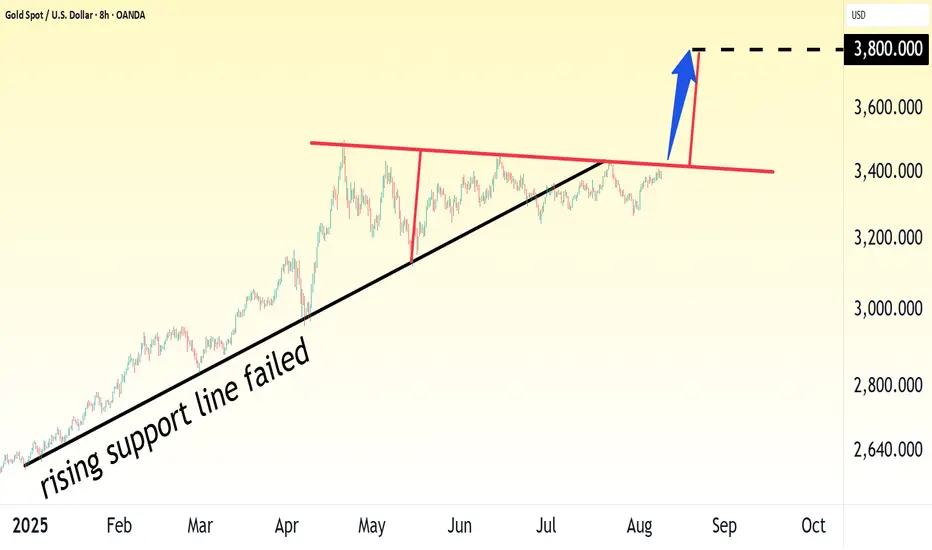
Gold prices continue to rise, and the next target is $3800!The gold chart made VERY simple.
$3800 target POSSIBLE once we get a confirmed continuation breakout.