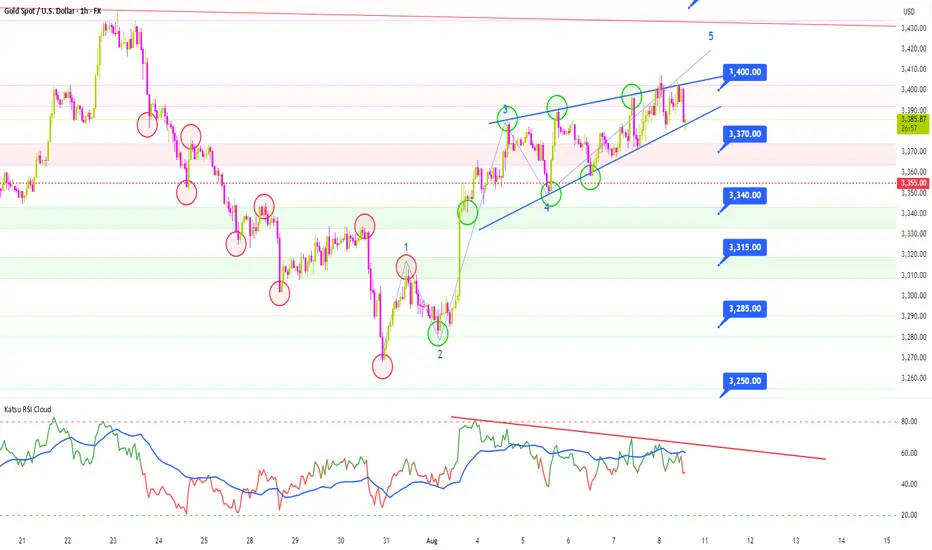
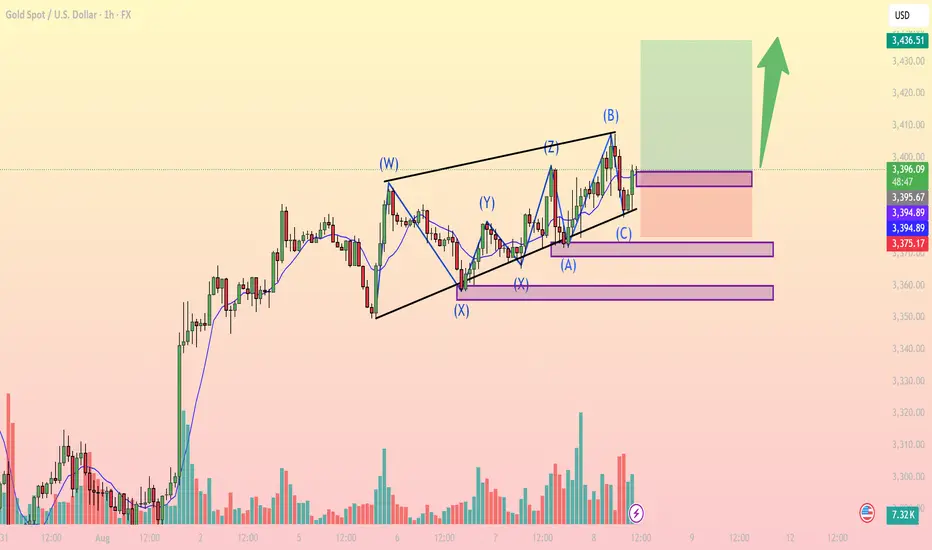
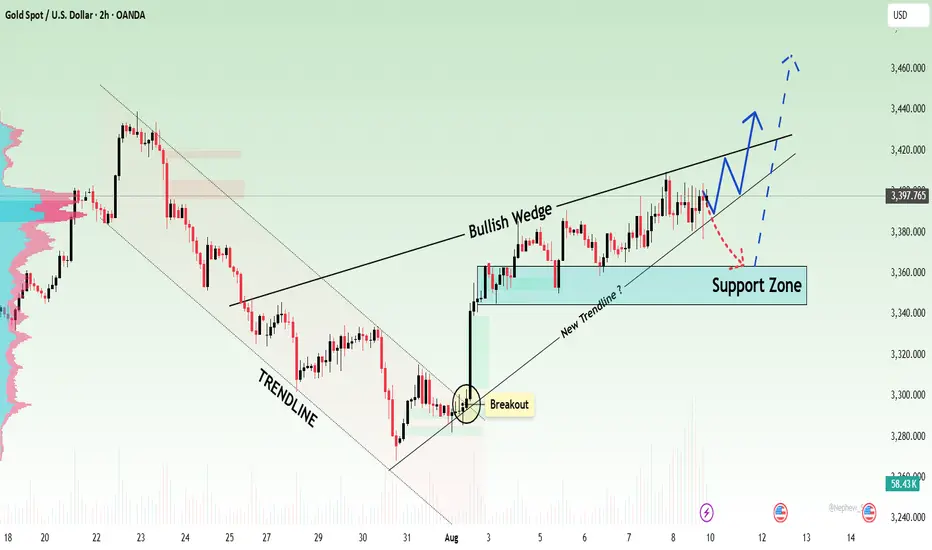
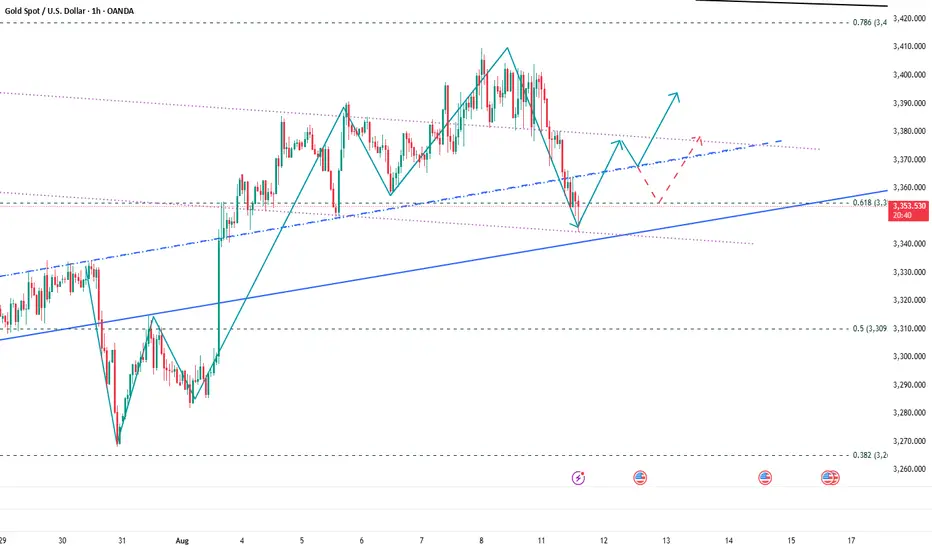
Gold completes corrective structureXAUUSD August 8: Gold completes corrective structure – Buy opportunity on breakout
On the 1H chart, Gold (XAUUSD) has been consolidating within a complex WXYXZ corrective pattern following the strong bullish rally from August 1st. The recent (A)(B)(C) correction within wave Z appears to have completed, with price currently bouncing from a key demand zone around 3,394 – 3,395 USD.
Key bullish signals:
Corrective pattern completed: Wave (C) touched the lower trendline and showed a bullish reaction, suggesting end of the correction.
EMA bounce: Price is finding support from the short-term EMA, indicating a potential return of bullish momentum.
Rising volume: Especially after testing the 3,375 support zone, buying volume has increased, confirming accumulation.
Fibonacci confluence: The 3,394 level aligns with the 61.8% retracement of the previous bullish leg – a strong support zone for long entries.
Important price levels:
Immediate support: 3,394 – 3,395 (ideal buy zone).
Stronger support: 3,375 (stop-loss placement).
Resistance / Take Profit: 3,436 (previous high and supply zone).
Suggested Trading Strategy:
Bias: Long (Buy)
Entry: 3,395
Stop-loss: 3,375
Target: 3,436
Risk/Reward Ratio: ~1.99 – solid for an intraday setup.
Note: If price breaks below 3,375 with high volume, consider exiting early to avoid deeper downside toward 3,333.
Conclusion: Gold is likely resuming its uptrend after a complex corrective phase. This presents a potential long opportunity with a favorable risk/reward ratio if executed properly within the marked levels.
Follow for more high-quality trading setups – and don’t forget to save this idea if it fits your trading plan.
XAUUSD trade ideas
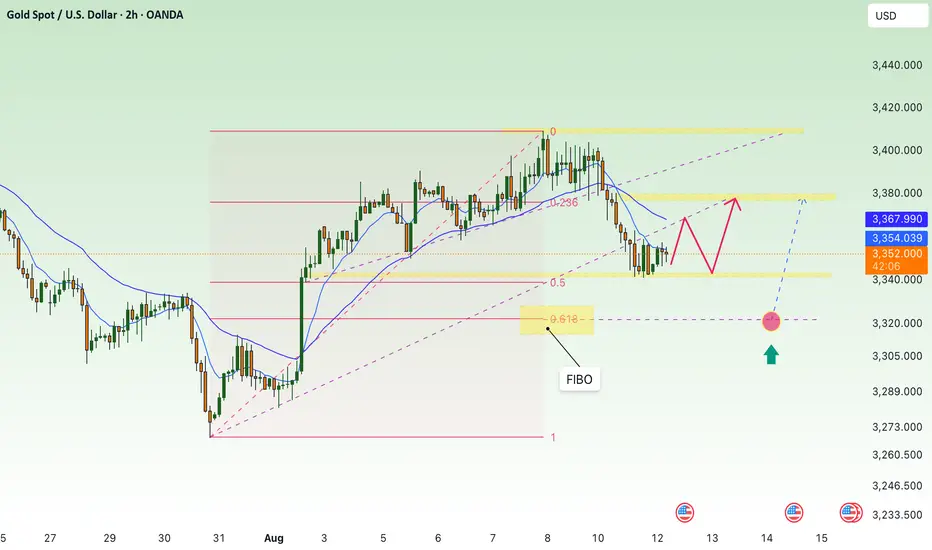
GOLD-SELL strategy monthly chart Reg. ChannelGOLD is poised to correct medium-term. The market has carried away as usual, and based on move beyond the channel, and overbought status, we should expect a solid correction downward.
Strategy SELL @ $ 3,340-3,900 and take profit near $ 2,875 for now.
$GOLD: Projections of Compression & Release 🏛️ Research Notes
Price is at fib boundary derived from its structure that covers growth patterns. Several attempts were taken place to push higher and ended up as lower highs.
Contraction of fractal cycles and amplitude.
Topologically, the compression to a point of proportional release in fibonacci proportions and scaling law 1:1 to original triangle would look like a cube. And let's limit for now with that horizon.
Probabilistic Filter - Another layer of fibonacci channels to inherit roughness of observed temporal pattern which then rhymes with extended series.
The longer the price fluctuates in these geometric boundaries, the more accurate the colors tend to reflect the outcome.
For measuring percentages of swings I used this modification of Zig Zag.
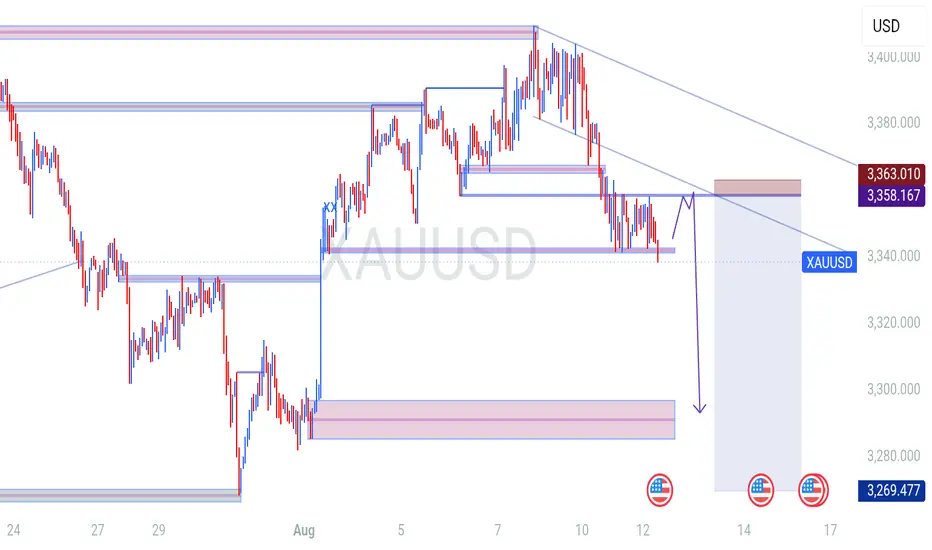
GOLD SELL BIOSthis setup depends on CPI data.
dollar is going long
so we should expect.gold to drop from 3358 sl 3363
tp 3266
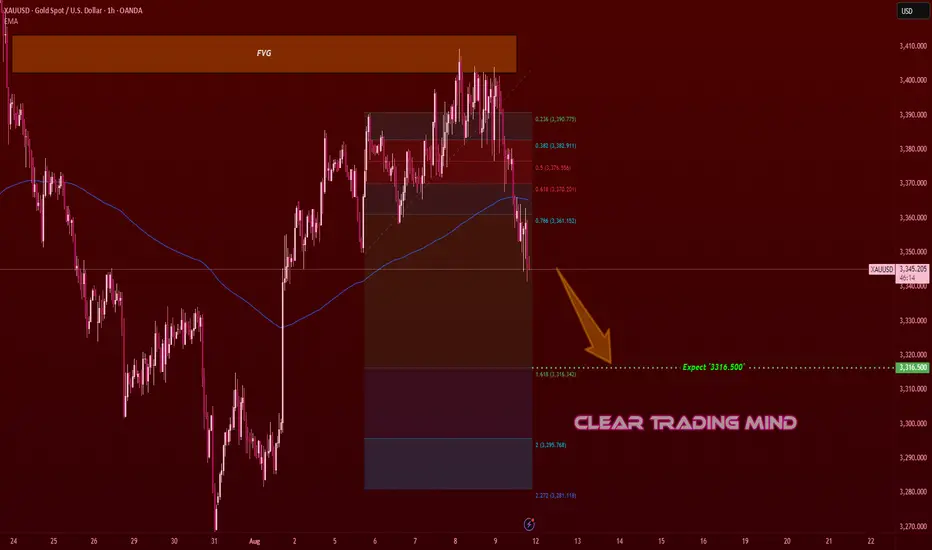
XAUUSD – Bears Eye 3316 as 200 MA CracksOn the 1H chart, Gold (XAUUSD) just confirmed a break below the 200 EMA, signaling a potential momentum shift in favor of sellers. Price previously retraced into the Fair Value Gap (FVG) and failed to sustain above, which adds to the bearish sentiment.
With the rejection from the FVG and fib-based projections, my expectation is for price to push down towards the 1.618 Fib extension at 3316.50. If bearish momentum remains strong, further downside levels could be in sight at 3299 (Fib 2.0) and 3281 (Fib 2.272).
📉 Bias – Bearish
📍 Key Resistance – FVG zone
🎯 Target Levels – 3316.50 → 3299 → 3281
H4 XAUUSD OutlookHello traders,
Gold continues to trade within a tight but decisive H4 structure, where every reaction is refining the path for the next impulsive move. This week’s chart is showing us well-defined supply and demand areas, each backed by clear order block structure, liquidity positioning, and confluences that align with both macro sentiment and intraday price action.
📊 Macro Context
USD Strength: The dollar remains pressured after recent US data hinted at slowing inflation momentum, keeping gold supported above key demand zones.
Geopolitical Tension: Ongoing Middle East tensions and mixed market sentiment keep safe-haven demand alive.
Upcoming Catalyst: US CPI later in the week could trigger a breakout from the current compression phase.
🎯 H4 Bias
Primary Bias: Bullish continuation while holding above 3345–3365 demand.
Secondary Bias: Bearish retracement possible only if we break below 3345 with conviction.
📍 Key H4 Structural Zones
🔴 Supply Zones
3418 – 3439 → Primary H4 Supply OB
Base: Last strong sell-off zone inside the HTF 3350–3439 supply.
Confluences: OB + liquidity grab + unfilled FVG.
3468 – 3490 → Intermediate H4 Supply OB
Base: Consolidation before the April drop, inducement above 3460.
Confluences: OB + partial FVG + RSI overbought H1/H4.
3500 – 3520 → Extended H4 Supply OB
Base: HTF OB overlap with unfilled imbalance.
Confluences: OB + D1 RSI overbought + Fibo extension 1.618.
🟢 Demand Zones
3345 – 3365 → Primary H4 Demand OB
Base: Multiple rejections + strong bounce origin.
Confluences: OB + EMA200 support + liquidity sweep.
3305 – 3325 → Intermediate H4 Demand OB
Base: Last bullish impulse before breaking 3345.
Confluences: OB + FVG fill + RSI oversold region.
3250 – 3275 → Extended H4 Demand OB
Base: Weekly/Daily OB alignment.
Confluences: OB + deep liquidity pocket + major swing low zone.
📌 Outlook Summary
Holding above 3345–3365 keeps the bullish scenario valid, targeting first 3418–3439, then 3468–3490.
A clean break below 3345 could open a deeper pullback towards 3305–3325.
Supply at 3500–3520 remains a major HTF target if both 3439 and 3490 get cleared.
Stay patient, wait for confirmation inside these high-probability zones, and remember — liquidity hunts often come before the real move.
💬 Let me know how you see Gold playing out from here — drop your thoughts,🚀🚀🚀 and follow for more structured updates!
— GoldFxMinds
Disclosure: This analysis is based on the Trade Nation feed and is for educational purposes only.
GOLD ROUTE MAP UPDATEHey Everyone,
Another PIPTASTIC day on the charts!!!
After completing our Bullish target 3370 yesterday, we stated that we are now waiting for ema5 lock to confirm gap to 3392.
We got the ema5 lock above 3370 opening 3392. A nice drop into the lower zone just above our bearish gap allowed us to buy dips inline with our plans. We got the push up all the way into 3390 just short of 3392 gap, so this remains open.
We will keep the above in mind when taking buys from dips. Our updated levels and weighted levels will allow us to track the movement down and then catch bounces up.
We will continue to buy dips using our support levels taking 20 to 40 pips. As stated before each of our level structures give 20 to 40 pip bounces, which is enough for a nice entry and exit. If you back test the levels we shared every week for the past 24 months, you can see how effectively they were used to trade with or against short/mid term swings and trends.
The swing range give bigger bounces then our weighted levels that's the difference between weighted levels and swing ranges.
BULLISH TARGET
3370 - DONE
EMA5 CROSS AND LOCK ABOVE 3370 WILL OPEN THE FOLLOWING BULLISH TARGETS
3392
EMA5 CROSS AND LOCK ABOVE 3392 WILL OPEN THE FOLLOWING BULLISH TARGET
3416
EMA5 CROSS AND LOCK ABOVE 3416 WILL OPEN THE FOLLOWING BULLISH TARGET
3429
EMA5 CROSS AND LOCK ABOVE 3429 WILL OPEN THE FOLLOWING BULLISH TARGET
3439
BEARISH TARGETS
3348
EMA5 CROSS AND LOCK BELOW 3348 WILL OPEN THE FOLLOWING BEARISH TARGET
3328
EMA5 CROSS AND LOCK BELOW 3328 WILL OPEN THE FOLLOWING BEARISH TARGET
3313
EMA5 CROSS AND LOCK BELOW 3313 WILL OPEN THE SWING RANGE
3296
3281
As always, we will keep you all updated with regular updates throughout the week and how we manage the active ideas and setups. Thank you all for your likes, comments and follows, we really appreciate it!
Mr Gold
GoldViewFX

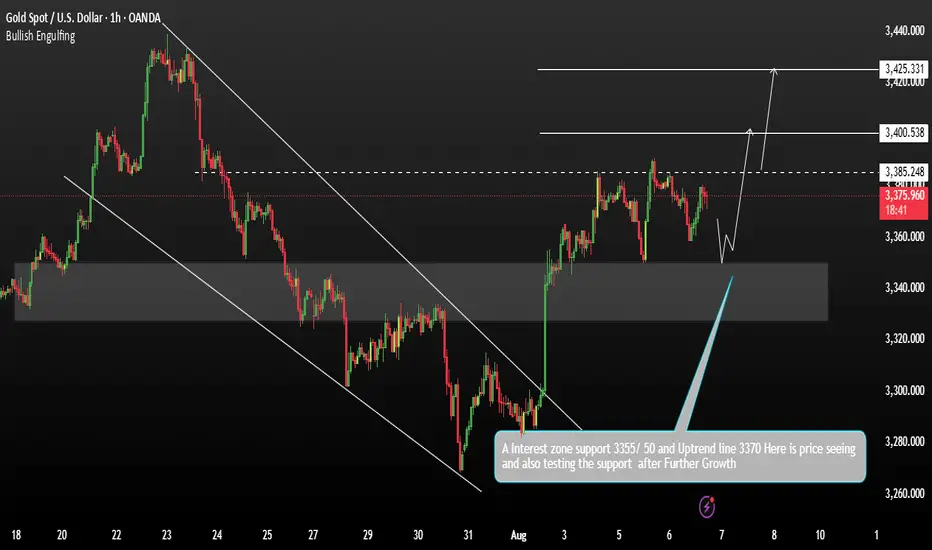
Gold: Is a Bullish Wedge Brewing?Yesterday, gold once again reversed from the resistance level of 3,400 USD. However, a vague "bullish wedge" pattern is forming on the chart...
Gold price has dropped from its two-week high due to profit-taking. The correction was intensified after the United States imposed tariffs on imported gold bars (1 kg), which could disrupt supply from Switzerland and London.
Key supporting factors: Weak U.S. employment data and expectations that the Fed will cut interest rates in September are putting significant pressure on the USD, making gold more attractive to investors seeking a safe-haven asset.
Risk: Short-term volatility ahead of U.S. CPI data next week. However, the underlying bullish momentum remains intact.
The issue with the bullish wedge pattern is that it forms a vague shape. We have an upward movement, but this pattern could easily reverse the local bullish trend due to the difficult resistance zone at 3,390-3,410.
Currently, the lower boundary of the wedge is acting as support. If the price holds above this level, the main scenario remains a bullish move towards the 3,433 to 3,450 USD resistance zone. On the other hand, if the support of the wedge pattern is broken, the price could return to the 3,350 USD level before the bullish trend resumes.
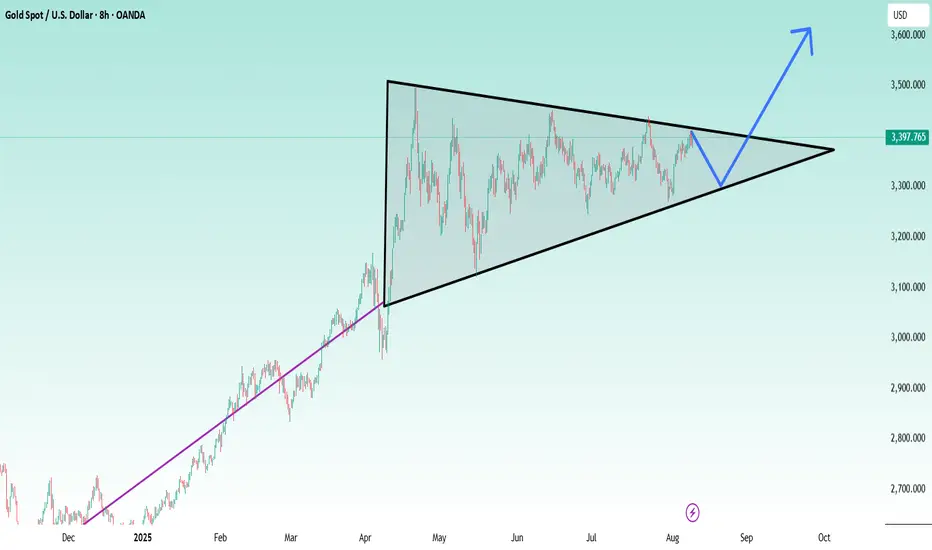
XAUUSD-symmetrical triangle patternsymmetrical triangle pattern of XAUUSD. It is consolidating in narrow area within Trangle.
Gold Price Drops After Rally – What’s Next?Hello everyone, let's take a closer look at today's gold price
Gold has unexpectedly dropped significantly today after a notable rise early last Friday. The market's initial concerns stemmed from rumors that the U.S. would impose an import tax on gold, which caused some panic. However, after the White House officially clarified its position and assured the market, the initial worries eased
From a technical perspective, gold has broken through the upward trendline and is moving swiftly. According to Dow Theory, a short-term correction might occur soon, but if the price remains below key resistance levels, the decline could extend toward the Fibonacci 1.272 region, or even down to the Fibonacci 1.618 level if the downtrend persists.
Do you agree with this outlook? Share your thoughts in the comments below.
Good luck and happy trading!

GOLD Potential Bullish Fallowing the PullbackGold is currently forming a trading range, with recent price action indicating a test of support, which may mark the end of the recent pullback. Yesterday, gold retraced toward the 3391 level, showing signs of short-term recovery.
Key Market Focus
The market is closely watching developments around the Federal Reserve appointment, including the potential replacement of Chair Powell. Trade-related comments from Donald Trump are also creating uncertainty. These geopolitical and macroeconomic factors may trigger a new correction or volatility phase in gold.
Resistance: 3400 / 3425
Support: 3355 / 3350
Price action confirmed a false breakout to the downside, with strong buying interest near the 3350–3355 support zone. If the price holds above this support, it strengthens the case for a bullish continuation. A break and close above 3400 could pave the way toward 3425 and potentially higher Growth.
You may find more details in the chart.
Trade wisely Best of Luck Buddies.
Ps: Support with like and comments for better analysis Thanks
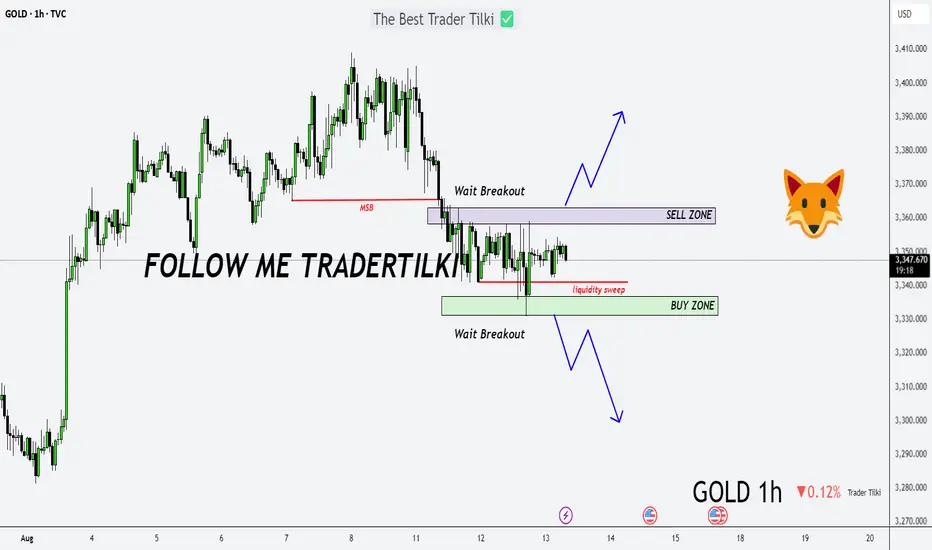
XAUUSD TRADE SETUPWait for retest the entry level and bullish momentum candle then take a trade for Buy otherwise skip this setup
THE KOG REPORT - UpdateEnd of day update from us here at KOG:
What a mission with gold, swings one way, swing the other, taking liquidity within the range and yet sticking with the illustration posted. We managed to get the move upside, pin point short into the level we wanted and then a bounce from the 3350 level again! We had a target lower, but suggested we wait for the 3370-5 level which we weren't happy with and ultimately broke, only then to give us the long into the LiTE and Excalibur targets and to complete most of the red box targets.
We now have support here at the 3375 level with extension in 3368 which are the levels that need to hold us up, then break the red box and we can attempt the higher levels.
KOG’s bias for the week:
Bullish above 3340 with targets above 3370✅, 3373✅, 3379✅ and above that 3384✅
Bearish on break of 3340 with targets below 3330, 3320 and below that 3310
RED BOXES:
Break above 3365 for 3372✅, 3375✅, 3379✅, 3384✅ and 3390✅ in extension of the move
Break below 3350 for 3346, 3340, 3335 and 3330 in extension of the move
As always, trade safe.
KOG

Gold price drops, selling pressure and CPI news⭐️GOLDEN INFORMATION:
Gold (XAU/USD) found some buying interest in the Asian session, rebounding from Monday’s steep drop to the $3,341 level — its lowest in over a week. The U.S. Dollar struggled to build on its two-day advance as traders stepped to the sidelines ahead of the release of the latest U.S. consumer inflation data later today.
The Consumer Price Index (CPI) report will be pivotal in shaping expectations for the Federal Reserve’s rate-cut trajectory, which will, in turn, influence the Greenback’s direction and could provide fresh momentum for the non-yielding yellow metal.
⭐️Personal comments NOVA:
CPI expected to increase, DXY increases, selling pressure on gold. Market recovers briefly before US trading session
⭐️SET UP GOLD PRICE:
🔥SELL GOLD zone: 3379- 3381 SL 3386
TP1: $3367
TP2: $3355
TP3: $3342
🔥BUY GOLD zone: $3320-$3318 SL $3313
TP1: $3332
TP2: $3344
TP3: $3356
⭐️Technical analysis:
Based on technical indicators EMA 34, EMA89 and support resistance areas to set up a reasonable BUY order.
⭐️NOTE:
Note: Nova wishes traders to manage their capital well
- take the number of lots that match your capital
- Takeprofit equal to 4-6% of capital account
- Stoplose equal to 2-3% of capital account
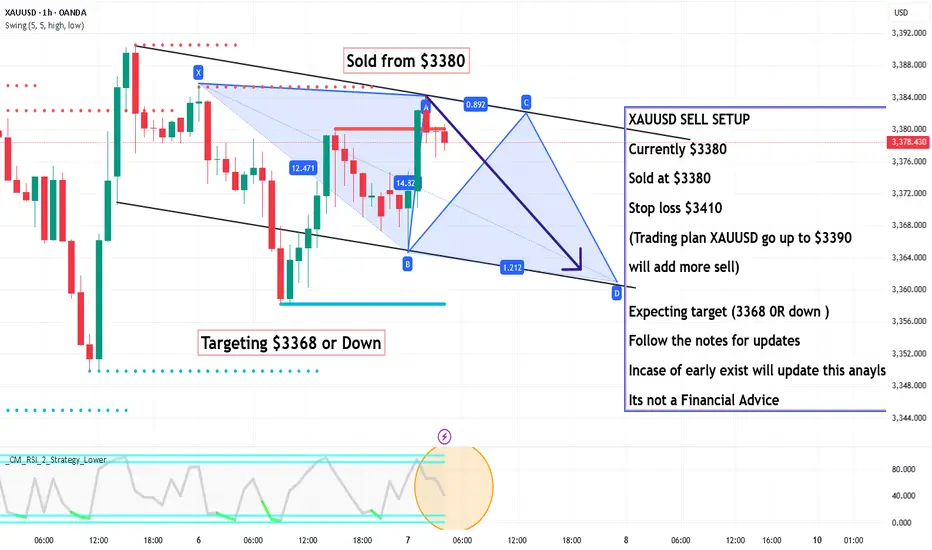
XAUUSD SELL SETUP ,Sold at $3380XAUUSD SELL SETUP
Currently $3380
Sold at $3380
Stop loss $3410
(Trading plan XAUUSD go up to $3390
will add more sell)
Expecting target (3368 0R down )
Follow the notes for updates
Incase of early exist will update this anaylsis
Its not a Financial Advice
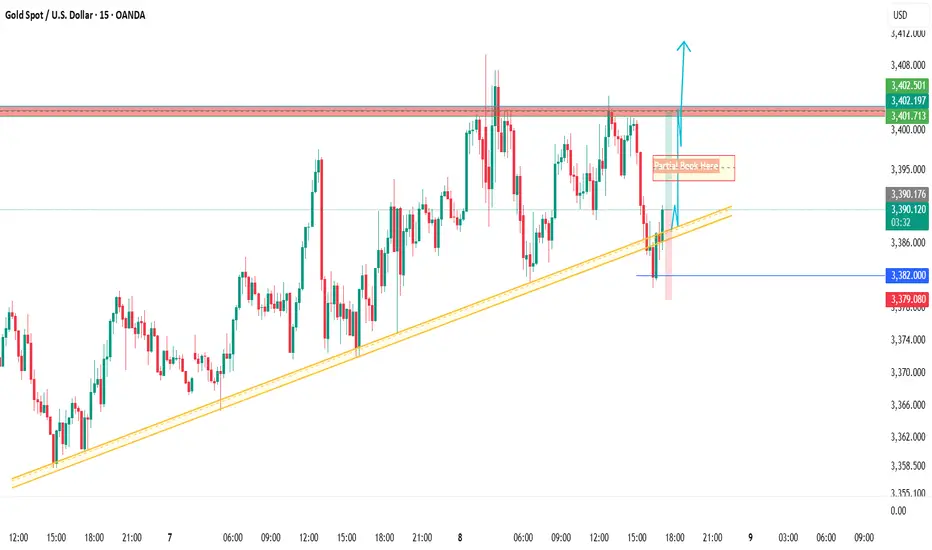
XAUUSD GOLD Buy Trade
Buy trade condiational buying on Restest and confirmation of bullish candle
Chart shows SL TP Entry point
Partial booking is suggested risk free trade as soon possible ap per risk reward
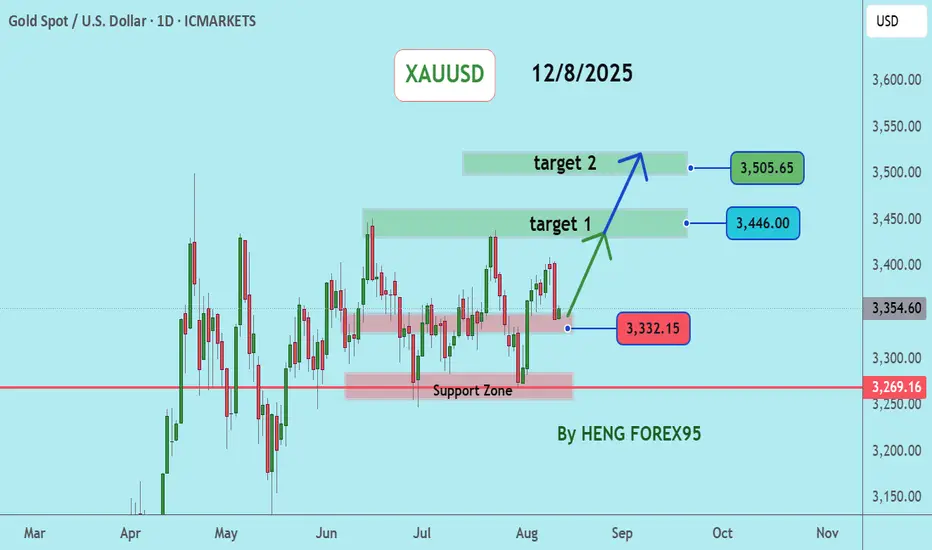
XAUUSDGold Price Update: As of July 31, 2025, the gold price has risen to test the resistance level at $3,408, or an increase of +139 USD as expected.
And the price could not break through the 3408 level, there was short-term selling pressure coming back in, so the price dropped.
However, if the price can hold above 3249, I still expect gold to remain in an uptrend, considering buying in the red zone.
🔥Trading futures, forex, CFDs and stocks carries a risk of loss.
Please consider carefully whether such trading is suitable for you.
>>GooD Luck 😊
❤️ Like and subscribe to never miss a new idea!
Gold’s Drop: The Calm Before the SurgeThe bulls have been defeated all the way, and the current lowest has fallen to around 3350. However, after gold touched around 3350, the downward momentum has slowed down. I think it is not appropriate to be overly bearish on gold in the short term.
It can be clearly seen during the day that gold started to fall from around 3401, and the decline reached $51 around 3350. In the absence of any major negative news, I believe that the intraday retracement space has reached its upper limit, and the structural support line for gold bulls happens to be in the 3350-3340 area, so the room for gold to continue to retrace will not be too large.
Moreover, gold has recently fallen under pressure several times after standing above 3340, proving that the upper resistance still exists. In addition, there is a certain amount of selling, which has hindered the bullish momentum to a certain extent, resulting in the lack of momentum for gold bulls. After the current pullback and technical repair, due to the increase in gold liquidity and accumulation of strength, it may be more conducive for gold to hit 3400 again or even higher targets.
Therefore, in the short term, I think it is not advisable to chase gold too much; instead, we can accumulate enough cheap chips during the gold pullback, and then wait patiently for gold to rebound and hit 3380-3390 again.
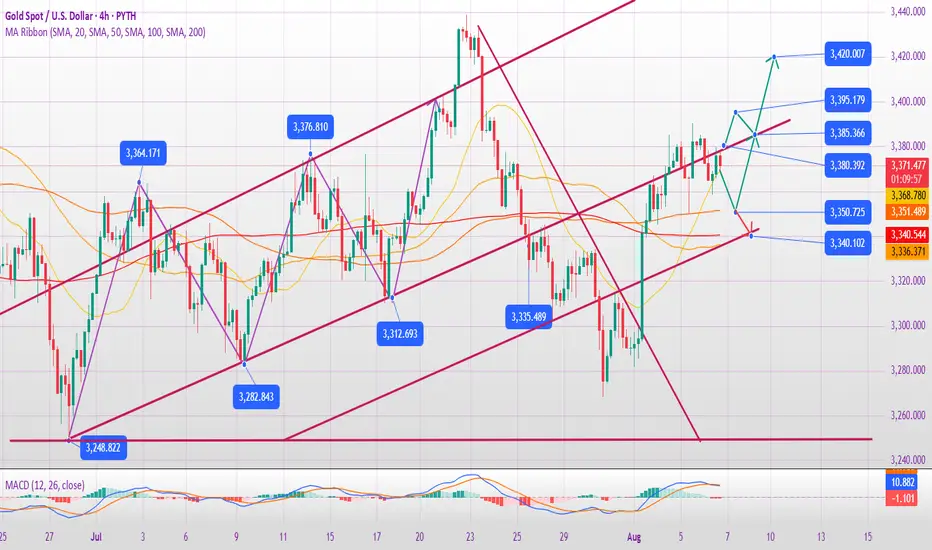
Will gold break out of its range-bound trading on August 7th?
📌 Core Logic: High-level fluctuations, be wary of a pullback risk
News support for gold prices
Expectations of a Fed rate cut: Weak US economic data (employment, services) reinforce expectations of a rate cut, putting pressure on the US dollar (around 98.7), benefiting gold.
Safe-haven demand: Trump’s policy uncertainty (tariffs, personnel changes) has increased market risk aversion, and gold has been sought after as a safe-haven asset.
Key Technical Signals
Resistance: 3390-3400 (nearly two-week high, bullish risk zone; a breakout targets 3420-3450).
Support: 3370 (short-term bull-bear boundary), 3360-3350 (key support for pullbacks).
Short-term Trend:
4-Hour Chart: Price is under pressure after approaching the acceleration line, indicating a high risk of chasing higher prices.
30-minute chart: Double top resistance at 3390. If it fails to break through, it may retest 3370. A break below 3370 signals weakness, with a target of 3350.
🎯 Today's Trading Strategy
1. Short Opportunity (Priority)
Entry Point: 3385-3395 (Test short position with a small position)
Stop Loss: 3402 (Short position expires if it breaks through 3400)
Target: 3370 → 3360 (If it breaks below 3360, hold to 3350)
2. Long Opportunity (Buy low after a pullback)
Entry Point: Go long if it stabilizes at 3360-3350
Stop Loss: 3345 (Prevent false breakouts)
Target: 3380-3390 (Hold if it breaks through 3400)
⚠️ Key Market Signals
If the Asian and European sessions continue to fluctuate above 3380, the US session may see another push towards 3400, but avoid chasing long positions. Wait for shorting opportunities at higher levels. If it quickly breaks below 3370, then turn short-term bearish and follow through to 3360-3350.
If it stabilizes at 3400 → Set stop loss for short position and switch to long position if it stabilizes on a pullback, with target at 3420-3450.
Key Levels Set: Where Will Gold End This Race?Good morning, my friends,
Gold is currently moving sideways. Let me tell you this: if gold breaks above the 3363 level and closes a candle there, the next target will be 3380 or even 3390.
However, if gold breaks below 3330 with a candle close, then the target will shift to 3310 or 3300.
Right now, gold is in a tight squeeze — bulls and bears are battling it out. Let’s see who wins and who puts the final stamp on this move. We’ll all witness it together.
My friends, every single like you send is my biggest source of motivation to keep sharing these analyses. Thank you so much to everyone who supports me with a like.
Gold Reverses After Hitting Resistance–Bearish Correction Ahead?GOLD – Market Overview
Gold reached our resistance target perfectly, rallying nearly $50 from 3349 to 3400, as previously projected.
Now, price has reversed from the resistance zone and is stabilizing below 3380, which supports a potential bearish correction toward 3365.
A break below 3365 would likely extend the move down to 3349.
For bullish momentum to resume toward 3402, we need a clean break above 3385.
Pivot Line: 3380
Support: 3365 – 3349
Resistance: 3391 – 3402
previous idea:
The Golden Wedge – Prelude to a Silent Collapse1. Chapter: The Plot Twist – The Traitorous Funnel (Rising Wedge)
A new and extremely sneaky pattern has emerged in the golden constellation.
My eyes are sharper than a hawk’s, and what I’ve spotted might just be the key to today’s entire story. This isn’t just technical analysis anymore—this is a psychological thriller.
Forget the comfortable parallel channel!
Gold has wandered into a rising wedge, one of the most deceptive traps in the world of chart patterns.
What’s a rising wedge?
Imagine the bulls charging up a narrowing mountain pass. At first, they’re full of energy, but as the walls close in, they lose momentum, get out of breath, and their excitement fades. Each new high is just slightly higher than the last. The power fades.
And that’s the trap: Even though the structure points upward, it’s a classic bearish reversal pattern.
It’s like a wolf in golden sheep’s clothing.
Statistically, it breaks down more often than up, and usually with a sharp move.
And it fits perfectly with the end of wave 5, just as I mentioned yesterday.
This is what we call an ending diagonal—the textbook sign of a fading trend. A final push... that’s not really a push anymore.
2. Chapter: The Evidence
A massive red neon sign is flashing on the trend strength and RSI indicators: BEARISH DIVERGENCE!
What does this mean? While the price keeps climbing to new highs, the indicator (RSI) has already started pointing downward.
And let’s not forget — on the 1-hour chart, there’s barely a trace of trend strength left.
The momentum has already left the building. To me, that’s a strong sign the bulls’ party might soon come to an end.
🔮 My Take – Place Your Bets on Collapse?
Opening a long position now?
That would be like buying a ticket for a sequel to the Titanic, called “Unsinkable 2 – This Time We Really Mean It.”
Sure, price might go a bit higher, but the iceberg (breakdown) is already visible on the horizon.
Opening a short position?
Logically, it’s the move that fits the script.
But a wise trader never shoots blindly.
The keyword here is: CONFIRMATION.
The Entry Command:
Don’t short until price breaks below the lower support line of the wedge. Wait for a candle to close below that rising support line—that’s your green light for entry!
Target: The first logical target after a breakdown would be the base of the wedge, around the Wave 4 low, which sits in the 3,340–3,350 zone.
Not financial advice, but that’s the setup I’m watching like a hawk.
From here on, the analysis continues in my native language – Hungarian
A csillagtérképen egy új, és rendkívül alattomos jelenséget fedeztem fel. A szemem élesebb, mint egy sólyomé, mert amit észrevettem az a kulcsa az egész mai történetnek. Ez a regény ma egy igazi pszicho-thriller lesz!
1. Fejezet: A Cselekmény Fordulata – Az Áruló Tölcsér (Az Emelkedő Ék)
Felejtsük el a biztonságos, párhuzamos csatornát! Az arany behajtott egy emelkedő ékbe, ami a technikai alakzatok egyik legalattomosabb csapdája.
Mi az az emelkedő ék? Képzeld el, hogy a bikák egy egyre szűkülő, meredek hegyi szurdokban rohannak felfelé. Az elején még nagy volt a lendület, de ahogy a falak közelednek, egyre jobban lelassulnak, elfogy a levegő, és a lelkesedésük is. Újabb és újabb csúcsokat érnek el, de minden egyes csúcs csak egy kicsivel van magasabban, mint az előző. A mozgásból lassan elfogy az erő.
A csapda természete: Bár az alakzat felfelé mutat, ez egy tipikus medvés (bearish) fordítós alakzat. Olyan, mint egy farkas báránybőrben. A statisztikák szerint az esetek többségében lefelé szokott kitörni, és gyakran heves esés követi.
Ez a jelenség tökéletesen illik az 5-ös hullám végére, amiről beszéltem tegnap. Ezt hívják "befejező diagonálnak", ami a trend kifulladásának klasszikus jele. Ez a végső-roham, ami már nem is igazi roham. Az idő majd megmondja mennyire gondoltam jól.
2. Fejezet: A Bizonyítékok
A Trend erő és RSI indikátoron is egy hatalmas, vörös neonfelirat villog: MEDVÉS DIVERGENCIA!
Mit jelent ez? Miközben az árfolyam még felfelé halad, újabb csúcsokra mászik, az indikátorok (az RSI) már rég lefelé tartanak. Arról nem is beszélve, hogy 1 órás charton Trenderőnek nyoma nincs.
Az erő már rég elhagyta a támadást. Ez egy erős bizonyíték arra, hogy a bikák partijának hamarosan vége.
Szerintem... – Fogadjunk az Összeomlásra?
Vételi (Long) pozíciót nyitni? Most longot nyitni olyan lenne, mint jegyet venni a Titanicot is gyártó cég legújabb, "Garantáltan Elsüllyeszthetetlen 2" nevű hajójára. Lehet, hogy megy még egy kicsit felfelé de a jéghegy (a lefelé kitörés) már ott van a láthatáron.
Eladási (Short) pozíciót nyitni? A forgatókönyv alapján ez a logikus lépés. De egy jó stratéga sosem lő vaktában. A kulcsszó a MEGERŐSÍTÉS!
A Belépési Parancs: Nem kezdünk el shortolni, amíg az árfolyam a biztonságot nyújtó ékben van. Megvárjuk, amíg egyértelműen és határozottan letöri az ék alsó, emelkedő vonalát. Az a gyertya, amelyik ez alatt a vonal alatt zár, az a mi belépési parancsunk!
Célpontok: A kitörés után az első logikus célár az ék kiindulási pontja, vagyis a 4-es hullám alja, a ~3,340-3,350-es zóna.
Nem bef. tanács, de én ezt fogom csinálni.